Proceeding Paper

Quenching of Fluorescence Caused by Graphene Oxide as an Immunosensing Platform in a Microwell Plate Format †

by
Edwin J. Ortiz-Riaño
,
Mariana D. Avila-Huerta
,
Diana L. Mancera-Zapata
and
Eden Morales-Narváez
*
Biophotonic Nanosensors Laboratory, Centro de Investigaciones en Óptica A.C., 37150 sLeón, Mexico
*
Author to whom correspondence should be addressed.
Presented at the 1st International Electronic Conference on Biosensors, 2–17 November 2020; Available online: https://iecb2020.sciforum.net/.
Proceedings 2020, 60(1), 60; https://doi.org/10.3390/IECB2020-07017
Published: 2 November 2020
(This article belongs to the Proceedings of The 1st International Electronic Conference on Biosensors)

Abstract

:
Immunoassays are, at present, an important tool for diagnostics, drug development, and environmental monitoring. However, most immunoassays involve procedures that require many elements for their development. We introduce a novel biosensing platform based on fluorescence quenching caused by graphene oxide (GO) for the detection of Human-IgG and Prostate-Specific Antigen (PSA). We employ a single antibody for the capture and detection processes, avoiding washing steps. FITC fluorophore was conjugated with antibodies for H-IgG detection, whereas quantum dots were conjugated with antibodies for PSA detection. The simple biosensing platform consists of covering a 96-well microplate (with a polystyrene bottom) with GO. The graphene oxide adhesion is possible by way of electrostatic interactions between the plate surface modified with amino groups (positively charged) and the graphene oxide (negatively charged). This proposal showed an excellent response for the detection of Human-IgG, with acceptable precision (from 0.27% to 5%). The limit of detection reached for H-IgG was 3.35 ng m L 1 . In the same manner, for PSA detection, the limit of detection reached was 0.02 ng m L 1 and the precision range was from 0.7% to 15.2%. Furthermore, this biosensing platform was demonstrated to operate with real samples of human urine doped with different concentrations of prostate-specific antigen.

1. Introduction

Nowadays, immunoassays are used to detect chemical or biological species; therefore, they are an essential tool in a wide range of applications such as drug development, clinical diagnostics, environmental monitoring, or food quality control [1]. However, conventional immunoassays, such as Enzyme-Linked ImmunoSorbent Assay (ELISA), require several procedures such as blocking, separations, and washing steps. Thus, it takes at least 6 h to obtain the respective results. Besides this, it involves two antibodies and a sensing surface to attach and label the biochemical target (analyte). Fluorescence Resonance Energy Transfer (FRET) is a very useful phenomenon to improve immunosensing sensitivity and avoid cumbersome procedures due to its simplicity. Graphene and its derivatives have been used as acceptors in FRET due to their wide absorption spectra, which make them outstanding quenchers of fluorescence [2]. With this in mind, we developed a novel and single-step biosensing platform based on fluorescence quenching caused by graphene oxide, which was used for the detection of two analytes: H-IgG (which is one type and also the most common antibody found in human blood circulation) and prostate-specific antigen (PSA). A single antibody conjugated with a fluorophore (FITC for H-IgG detection and quantum dots for PSA detection) is used in the capture and detection processes. When the analyte and the antibody (conjugated with the fluorophore) are added, a kinetic analysis is performed for 2 h with real-time interrogation of the respective fluorescence intensity, showing that the higher the analyte concentration, the less quenching of the fluorescence of the immunosensing probe takes place (antibody–fluorophore immunocomplex). This is due to the low affinity and the relatively long distance between GOµWs (microwell plate coated with Graphene Oxide) and the immunosensing probe [3].

2. Materials and Methods

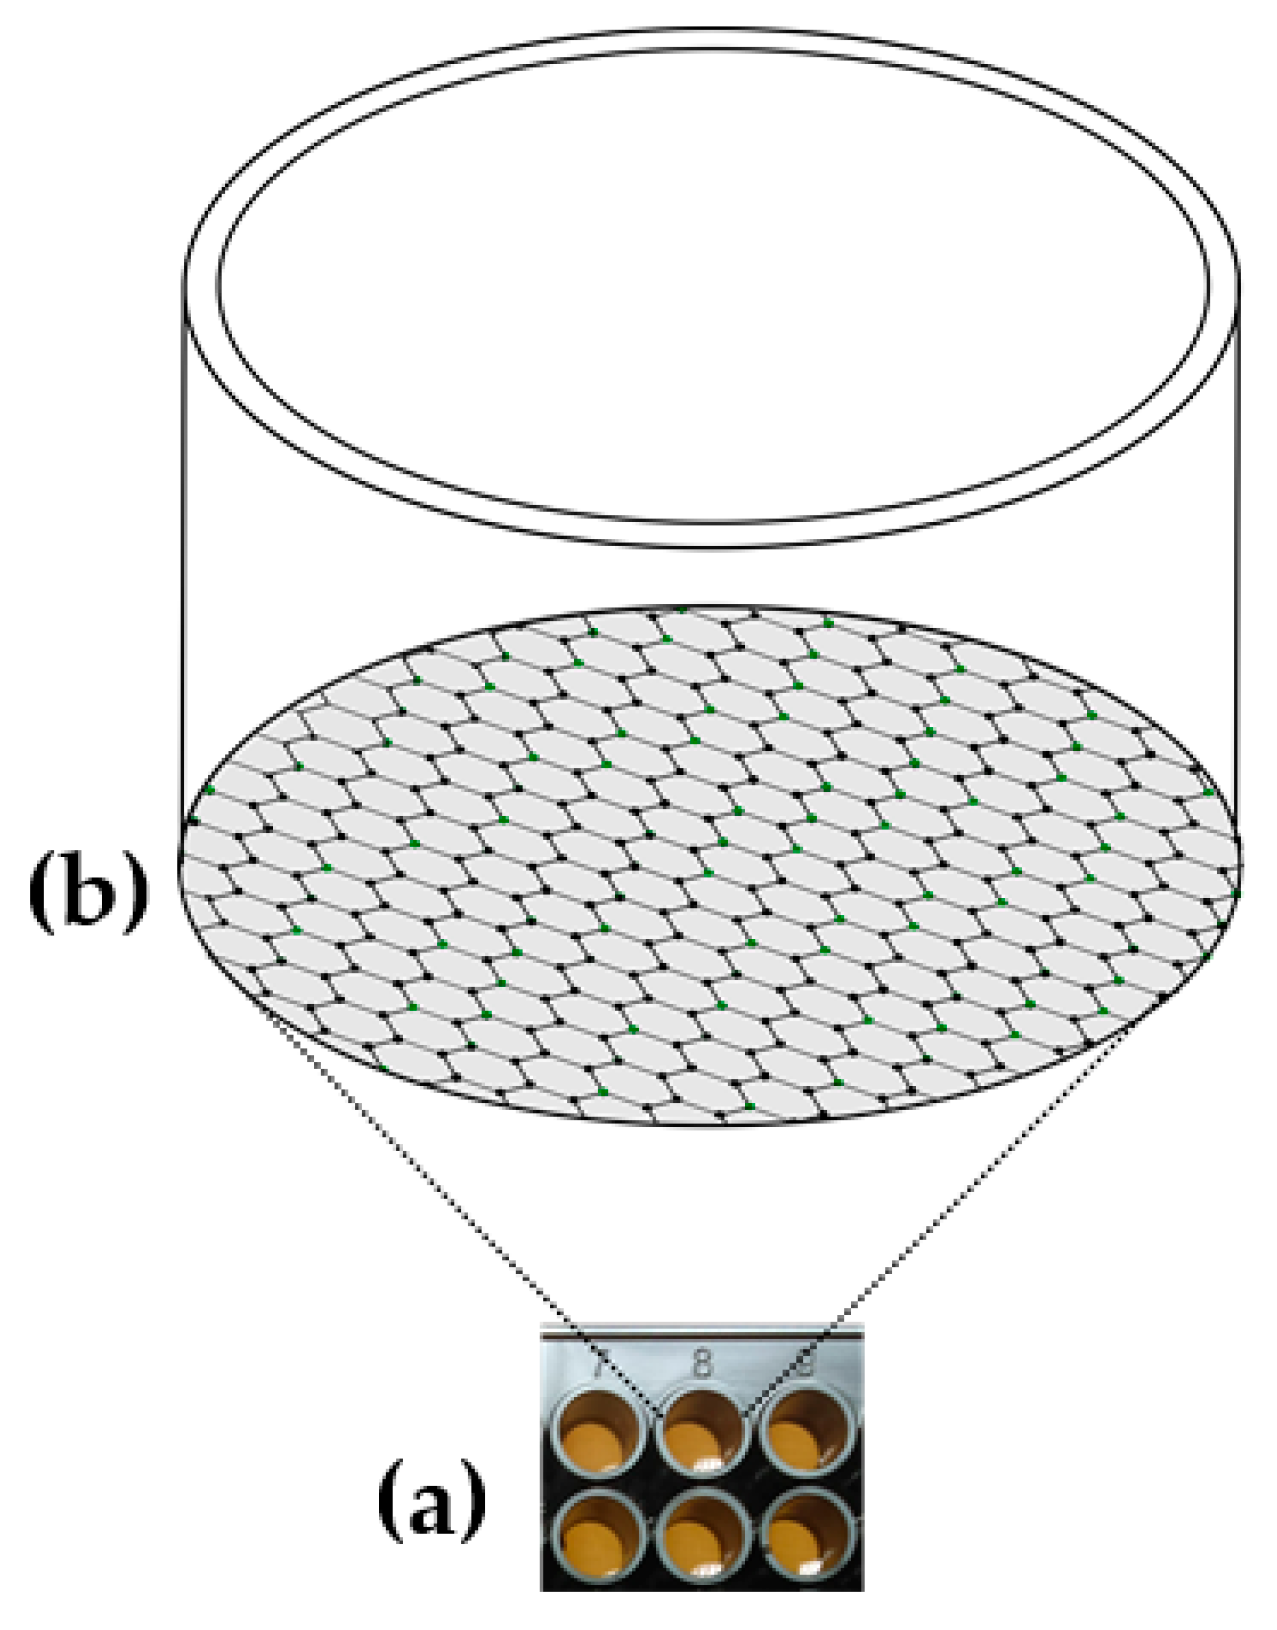
2.1. GO-Coated Microwell (GOµW) Plates

A total of 100 μL of GO per microwell was added in microwell plates and the plates were left overnight, aiming to coat the microwell surface with GO, see Figure 1a. The microwell surface of the plate was modified with amino groups (thus positively charged) following specification afforded by the supplier, and GO has a negative charge on aqueous suspension. Therefore, the coating of GO onto every microwell’s surface was principally achieved via electrostatic interactions. After that time, three washing steps were made on every microwell plate with the intention of removing excess GO that did not attach, Figure 1b. In this way, the GOμW-based biosensing platform is ready-to-use.

2.2. GOµWs-Based Immunoassay

When the biosensing platform was ready, the detection was conducted by adding 50–100 μL of the photoluminescent biorecognition probe (antibody–fluorophore immunocomplex) and 50–100 μL of the analyte to be detected in a GOμW. We used different concentrations of the analyte (in serial dilutions). Blank samples were also included all the assays, and three parallel experiments were made for every concentration to evaluate the precision of the measurement. The microplate reader recorded the intensity of fluorescence of every GOμW every 5 min during a kinetic analysis of 2 h. FITC conjugated with the antibody was excited at 485 nm and had a maximum emission at 528 ± 10 nm, and the Qdot-conjugated antibody was excited at 365 nm and had a maximum emission at 665 ± 10 nm. For immunoassays using human urine, samples were diluted using a 1/4 ratio before the analysis.

2.3. Conjugation of QDs with Anti-PSA

A concentration of 8 nM of Qdot Streptavidin conjugate was mixed with concentrations at μg m L 1 range of anti-PSA conjugated Biotin for 45 min under gentle shaking. Both bioreagents were diluted in an immunobuffer.

3. Results and Discussion

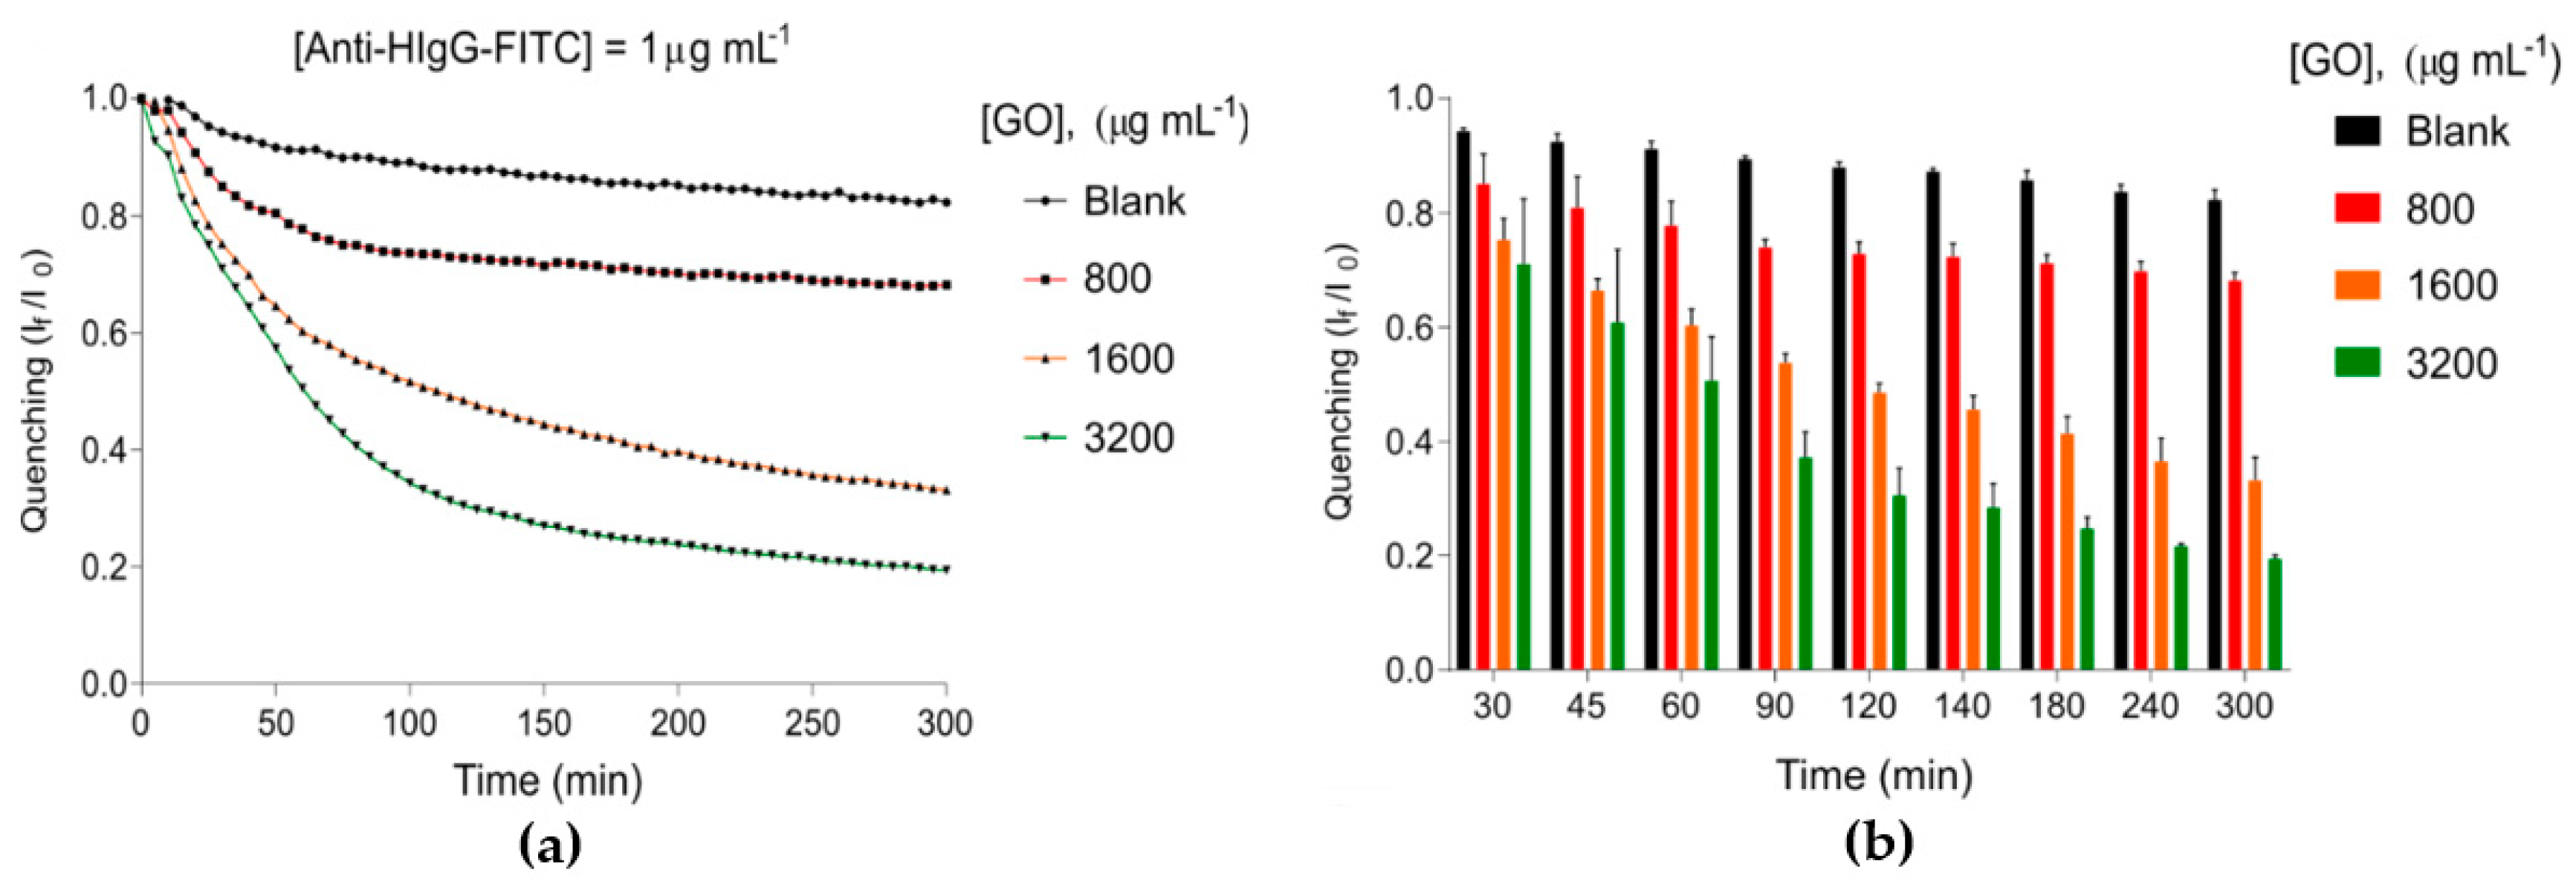
3.1. Characterization of Graphene Oxide-Coated Microwell Plates

With the intention of testing the photoluminescence-quenching capabilities of GOμWs produced under the experimental section, we conducted a kinetic analysis of 5 h with readings every 5 min of photoluminescence intensity. Compared with bare microwells (μWs), GOμWs with different GO concentrations (800, 1600, 3200 µg m L 1 ) were capable of quenching the photoluminescence of FITC conjugated with antibodies at a concentration of 1 µg m L 1 , Figure 2a. The photoluminescence intensity was normalized regarding the initial intensity I 0 to observe the quenching level at a certain time concerning the initial values.
As shown in Figure 2b, the higher the GO concentration, the lower the quenching of photoluminescence. On the other hand, for bare µWs, the weak quenching of fluorescence (around 20% less with respect to the initial value) is owing to the photobleaching phenomenon.

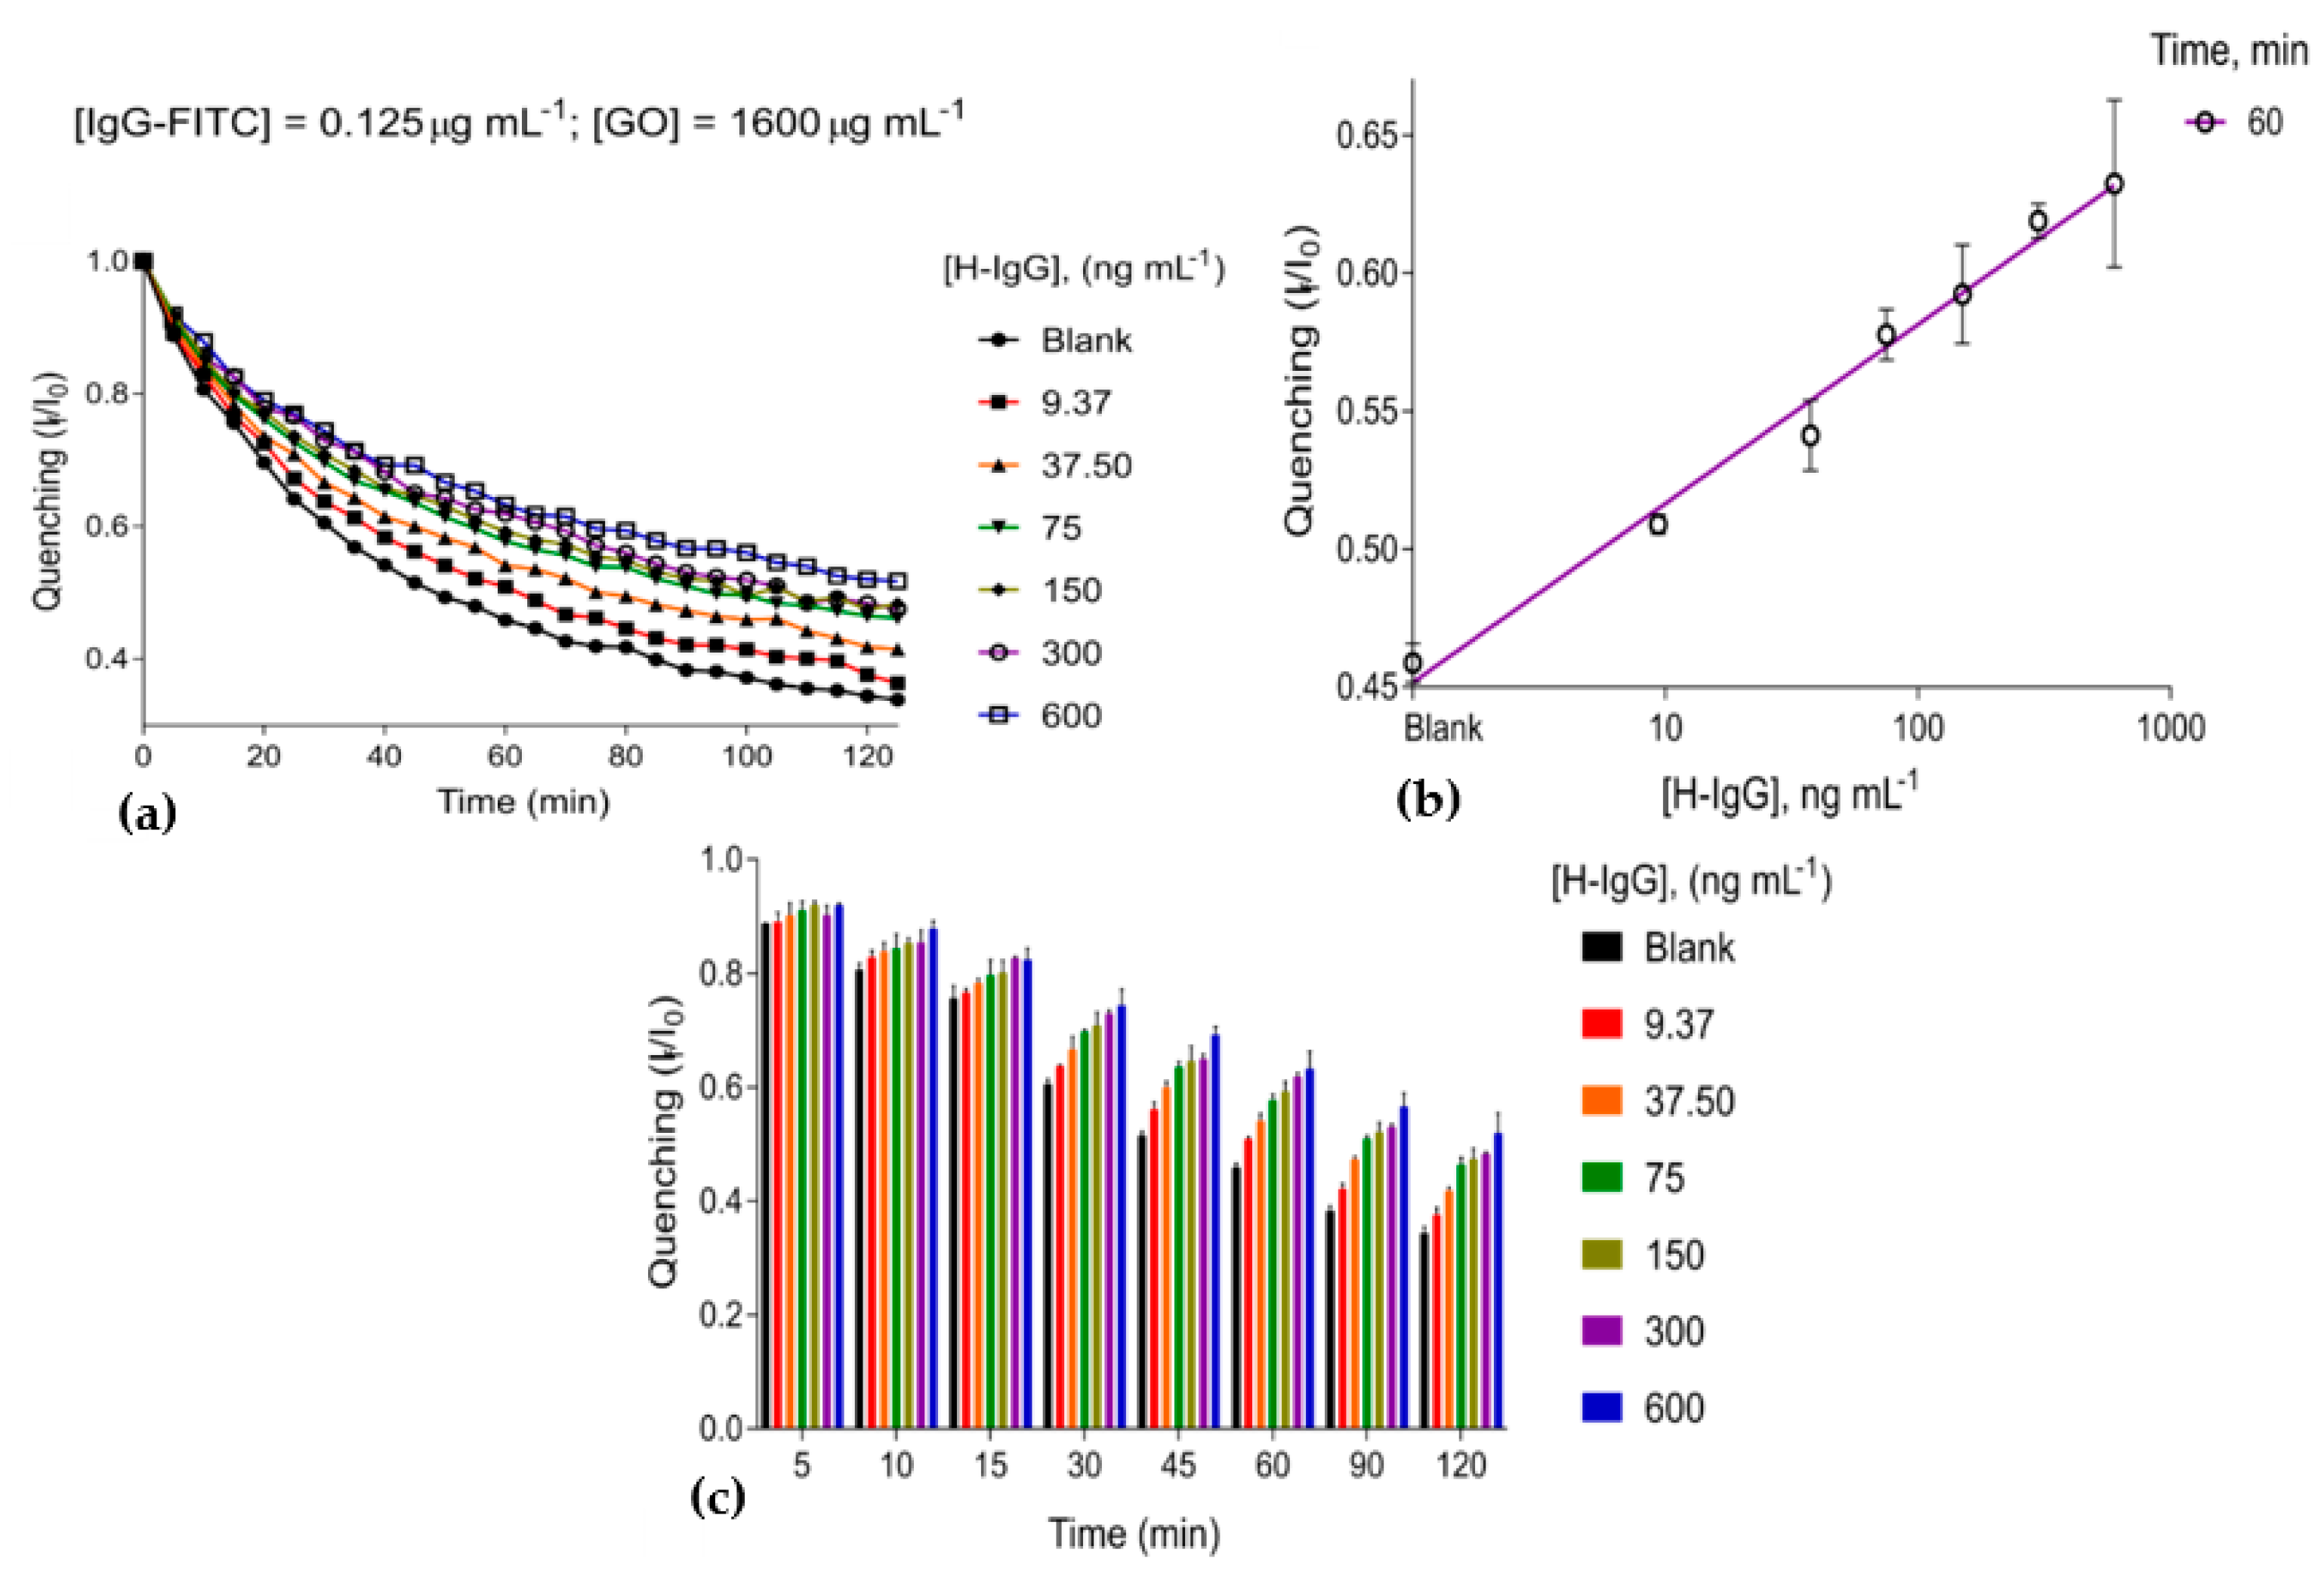
3.2. The Immunosensing Platform Targeting Human IgG

With the biosensing platform ready, we carried out an immunoassay to detect and explore the interaction of several concentrations of Human IgG (H-IgG) with FITC-conjugated, anti-Human IgG (Anti-H-IgG) when mixed within GOµWs, following the experimental parameters. Figure 3a shows that, for all concentrations of H-IgG, there is a difference in levels of photoluminescence quenching concerning the blank throughout the kinetic analysis.
From 60 min, it is evident that the biggest difference in fluorescence quenching levels between analyte concentrations begin, as depicted in Figure 3b. Table 1 shows some validation parameters for H-IgG detection.

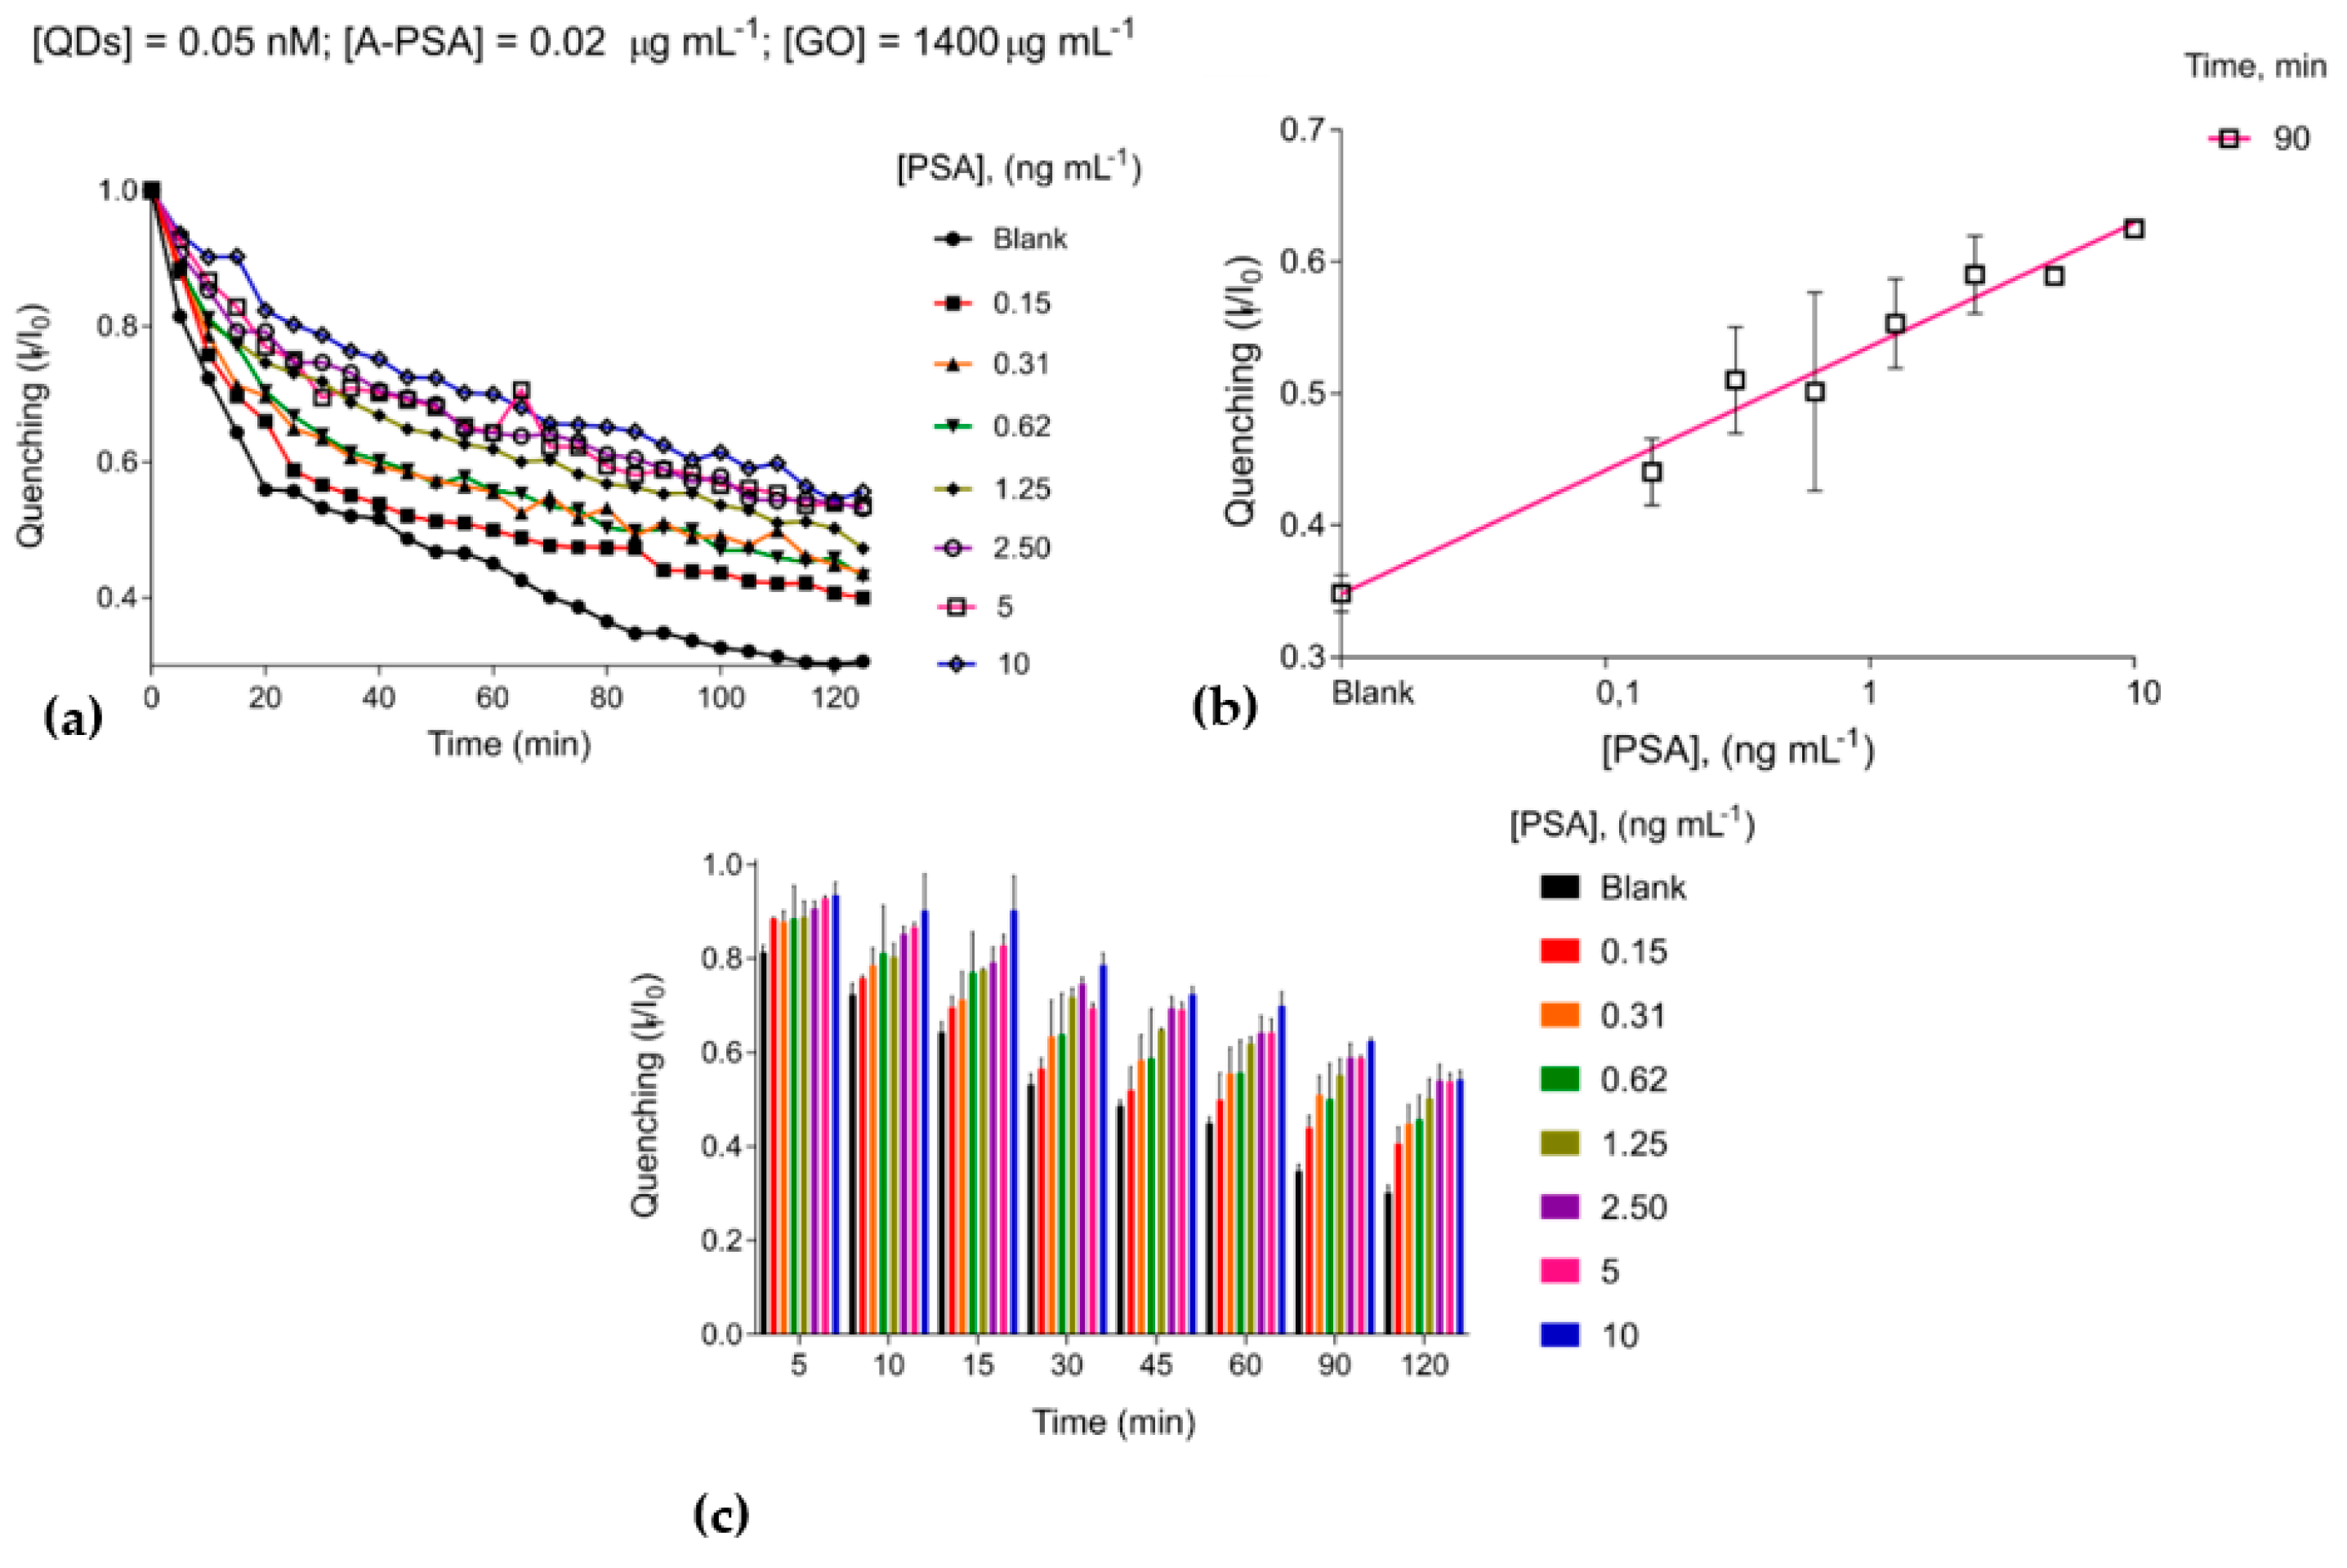
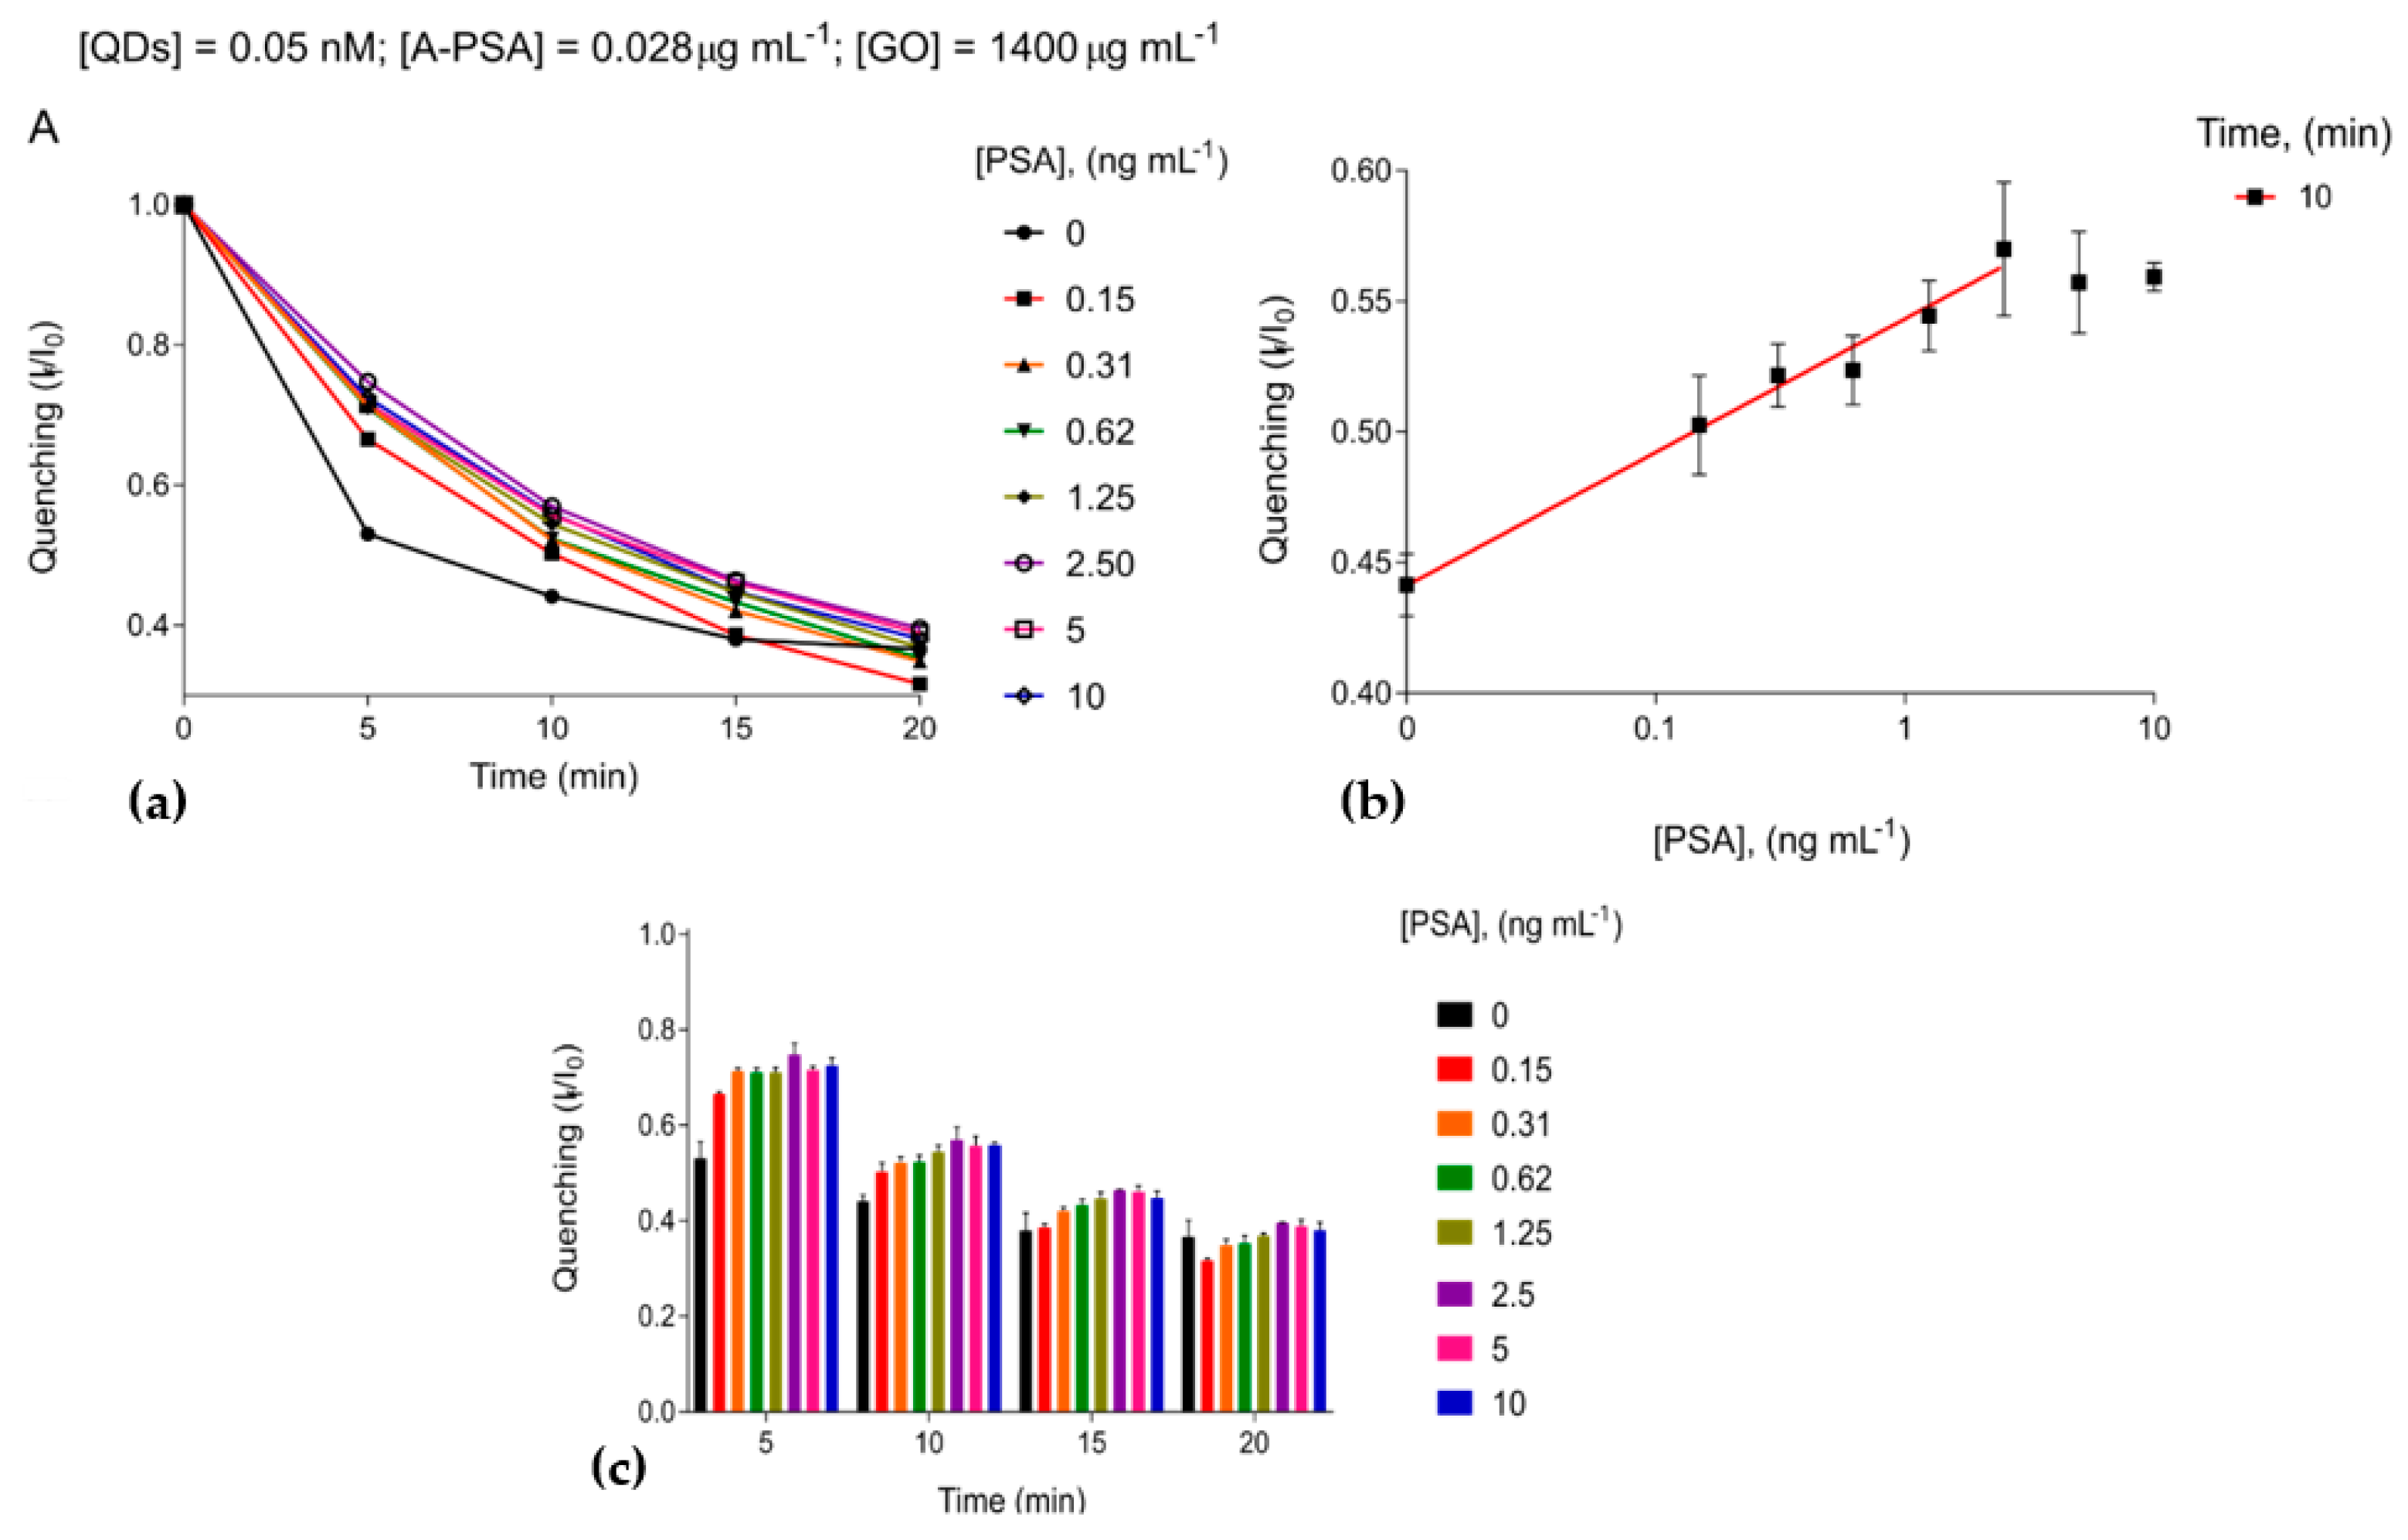
3.3. The Immunosensing Platform Targeting Prostate-Specific Antigen

We also designed a configuration of the immunosensing platform for the detection of the Prostate-Specific Antigen (PSA) to show that this enjoys highly transformative capabilities. In this configuration, the photoluminescence probe is composed of Streptavidin-Qdots and biotinylated monoclonal antibody (anti-PSA). It is worth mentioning that a serum PSA level of up to 4 ng m L 1 is generally considered normal. Figure 4a depicts the kinetic analysis behavior of fluorescence intensity for the PSA concentrations used. Some validation parameters for PSA detection are shown in Table 2.

3.4. Proof of Concept of Immunosensing Platform

Finally, we tested whether the biosensing platform proposed could detect urine samples doped with several concentrations of PSA (from 0 to 10 ng m L 1 ), as depicted in Figure 5a. According to Figure 5c, the best analytical performance regarding the limit of detection occurs before 20 min of the assay.
It is evident that the biosensing configuration is saturated from 2.5 ng m L 1 , see Figure 5b,c. This is due to a matrix effect undergone in the proposed immunoassay that harms antibody binding and assay performance. However, the analytical performance of the immunoassay quickly increases until 10 min and then decreases at around 20 min. Some validation parameters for PSA (in human urine) detection are shown in Table 3.

4. Conclusions

Taking advantage of the famous microwell plate format and the outstanding photoluminescence quencher represented by GO, we developed a breakthrough in immunosensing utilizing the studied graphene oxide-coated microwells. Given the proposed operational principle, as detailed in the introduction, the studied immunosensing platform enjoys a sensitivity comparable to that of ELISA and acceptable precision and accuracy. On the other hand, the biosensing platform is proposed to operate not only with different analytes but also with organic dye-decorated antibodies and streptavidin-functionalized QDs conjugated to biotinylated antibodies. The principal advantages of the innovative real-time immunosensing platform are that they operate with a single antibody and avoiding washing, blocking, and separation steps, thus, saving valuable reagents and time. The studied immunosensing platforms targeting H-IgG and PSA, respectively, reached their best analytical performance before 120 min of the assay.

References

  1. Prasad, P.N. Introduction to Biophotonics; Chapter 9: Optical Biosensors; John Wiley & Sons, Ltd.: Hoboken, NJ, USA, 2004; pp. 311–356. [Google Scholar]
  2. Morales-Narváez, E.; Merkoçi, A. Graphene Oxide as an Optical Biosensing Platform: A Progress Report. Adv. Mater. 2019, 31, 1805043. [Google Scholar] [CrossRef] [PubMed]
  3. Ortiz-Riaño, E.J.; Avila-Huerta, M.D.; Mancera-Zapata, D.L.; Morales-Narváez, E. Microwell plates coated with graphene oxide enable advantageous real-time immunosensing platform. Biosens. Bioelectron. 2020, 165, 112319. [Google Scholar] [CrossRef]
Figure 1. (a) microwell plates with graphene oxide (GO) in aqueous suspension (b) microwell covered with GO after washing steps.
Proceedings 60 00060 g001
Figure 2. The photoluminescence-quenching capabilities of GOµWs produced with different GO concentrations: (a,b) Experimental evidence of photoluminescent probes’ (FITC-labeled antibody) quenching monitored for 300 min. Adapted with permission from [3], Copyright 2020, Elsevier.
Proceedings 60 00060 g002
Figure 3. Analytical performance of the optimized immunosensing platform targeting H-IgG: (a) Real-time analysis of different concentrations of H-IgG and blank sample; (b) Calibration curve resulting at 60 min of the proposed immunoassay; (c) Behavior of the sensitivity of the resulting immunoassay across specific times. Adapted with permission from [3], Copyright 2020, Elsevier.
Proceedings 60 00060 g003
Figure 4. Analytical performance of the optimized immunosensing platform targeting PSA: (a) Real-time analysis of different concentrations of PSA and blank sample; (b) Calibration curve resulting at 90 min of the proposed immunoassay; (c) Behavior of the sensitivity of the resulting immunoassay across specific times. Adapted with permission from [3], Copyright 2020, Elsevier.
Proceedings 60 00060 g004
Figure 5. Analysis of human urine doped with different concentrations of PSA: (a) Real-time analysis of different concentrations of PSA in urine; (b) Calibration curve resulting at 10 min of the proposed immunoassay; (c) Behavior of the sensitivity of the resulting immunoassay across specific times. Adapted with permission from [3], Copyright 2020, Elsevier.
Proceedings 60 00060 g005
Table 1. Parameters of validation for H-IgG detection.
Limit of Detection
ng m L 1
Optimal Concentration GO
µg m L 1
Optimal Concentration Anti-H-IgG
µg m L 1
Range of Coefficient of Variation (Precision)
3.35 ± 1.0816000.1250.27–5%
Table 2. Parameters of validation for Prostate-Specific Antigen (PSA) detection.
Limit of Detection
ng m L 1
Optimal Concentration GO
µg m L 1
Optimal Concentration Qdot
nM
Optimal Concentration Anti-PSA
µg m L 1
Range of Coefficient of Variation (Precision)
0.0214000.050.020.7–15.2%
Table 3. Parameters of validation for PSA detection in human urine.
Limit of Detection
ng m L 1
Optimal Concentration GO
µg m L 1
Optimal Concentration Qdot
nM
Optimal Concentration Anti-PSA
µg m L 1
Range of Coefficient of Variation (Precision)
0.0514000.050.020.2–9.3%
Publisher’s Note: MDPI stays neutral with regard to jurisdictional claims in published maps and institutional affiliations.

