Proceeding Paper

Detection of Sub-Nanomolar Concentration of Trypsin by Thicken-Shear Mode (TSM) Acoustic Wave Biosensor †

1
Department of Nuclear Physics and Biophysics, Faculty of Mathematics, Physics and Informatics, Comenius University, Mlynska dolina F1, 84248 Bratislava, Slovakia
2
Department of Chemistry, University of Toronto, Lash Miller Laboratories, 80 St. George Street, Toronto, ON M5S 3H6, Canada
*
Author to whom correspondence should be addressed.
Presented at the 1st International Electronic Conference on Biosensors, 2–17 November 2020; Available online: https://iecb2020.sciforum.net/.
Proceedings 2020, 60(1), 6; https://doi.org/10.3390/IECB2020-07075
Published: 2 November 2020
(This article belongs to the Proceedings of The 1st International Electronic Conference on Biosensors)

Abstract

:
The determination of protease activity is very important for disease diagnosis, drug development, and quality and safety assurance for dairy products. Therefore, the development of low-cost methods for assessing protease activity is critical. Here, we demonstrate that an acoustic wave-based biosensor operated in the thickness-shear mode (TSM) enables the low-cost detection of protease activity in real time. The TSM sensor was based on a protein substrate (PS) β-casein immobilized on a piezoelectric quartz crystal electrode. The β-casein layer was immobilized onto a gold surface by a carboxylate terminated self-assembled monolayer (SAM) of 11-mercaptoundecanoic acid (MUA). The carboxylic acid terminal was activated by the reaction of a mixture of water- soluble N-(3-Dimethylaminopropyl)-N0-ethylcarbodiimide (EDC) and N–Hydroxysuccinimide (NHS) on the electrode surfaces. We demonstrated that β-casein can form a stable assembly on a piezoelectric quartz crystal electrode. After an enzymatic reaction with trypsin, it cleaved the surface-bound β-casein substrate, which increased the frequency of the crystal in a sigmoidal manner. Trypsin was detected in the range of concentrations from 1 to 50 nM. The limit of detection was 0.2 nM. Initial reaction rates measured at different enzyme concentrations have been used to construct a calibration curve. Considering the results obtained, we believe that the TSM biosensor is a useful tool for protease analysis.

1. Introduction

Peptidases, more frequently referred to as proteases, are a group of enzymes that irreversibly hydrolyze a peptide bond in an amino acid sequence through the nucleophilic attack and subsequent hydrolysis of a tetrahedral intermediate. They play critical roles in biological and physiological processes such as blood clotting, digestion, and a variety of cellular activities [1,2]. Proteases are highly involved in the dairy industry as well, where their activity is directly linked to the shelf life of dairy products [3]. Owing to their specificity, protease activity-based nanosensors are used in various diseases diagnostics [4,5,6]. Moreover, inhibitors of these proteases are successfully employed as therapeutic agents [2,7,8].
Trypsin is an extremely important serine protease of the chymotrypsin family. It is produced in the pancreas and it plays crucial roles in the small intestine. Trypsin catalyzes the hydrolysis of consumed proteins and activates protease proenzymes as part of the digestive system. It is highly specific toward the cleavage of peptide bonds at the carboxyl side of lysine or arginine. Trypsin is often used as a model protease because it is inexpensive and readily available [9,10,11]. Standard assays for the detection of proteases such as trypsin usually utilize fluorogenic and chromogenic substrates. Those assays are useful, practical, and highly sensitive. However, spectroscopic assays are incapable of measuring protease activity in highly colored and turbid samples such as cells, tissue lysates, or milk. Therefore, the development of a new label-free method for detecting protease activity without interruption from impurity inclusions is needed [1,10,12].
The thickness-shear mode (TSM) acoustic wave biosensor may present an attractive platform for the development of cost-effective and highly sensitive techniques for trypsin detection. The use of TSM devices is a well-established method for the detection of mass changes due to depositions or chemical/biochemical reactions on its surface as well of changes in the viscoelastic properties of the contacting material. Therefore, the TSM biosensor is a sensitive tool for the study of molecular interactions on surfaces [13]. Moreover, the coupling of a flow injection analysis (FIA) system to a TSM sensor device permits the monitoring of kinetic processes that take place at the surface of the sensor [14]. The TSM device applies a high frequency AC voltage across an AT-cut quartz crystal on which, due to the piezoelectric effect, an acoustic shear wave is generated and propagated through the sensing layer perpendicular to the surface of the crystal [15]. It has a low noise level and higher Q-factor in clinical liquids such as tissue fluids and serum, since the shear acoustic waves do not propagate in liquids. Compared to other common biosensing technologies, TSM electroacoustic resonators have the combined advantages of high sensitivity and low cost, label-free detection of analyte, and simple operation without the requirement of bulky detection systems [16]. Moreover, in contrast with traditional quartz crystal microbalance (QCM) techniques, the analysis of complex impedance spectra allows for the receipt of information about changes in the properties of layers even with the adsorption of relatively small molecules that do not contribute to the mass but only to the viscoelastic properties of the layer [17]. The multi-harmonic QCM method has previously been applied for the detection of plasmin and trypsin at the surface of β-casein layers [18]. This method allows for the detection of these proteases at the sub-nM level. However, the possible contribution of viscoelastic effects has not been analyzed.
In this work, we designed an analytical method based on the TSM biosensor for the real-time and label-free detection of trypsin. For this purpose, a SiO2 surface was modified by mercaptoundecanoic acid (MUA) for further immobilization of a native substrate of trypsin and a common protein of milk, β-casein, on a TSM crystal. Using TSM frequency responses, we investigated the assembly and stability of self-assembled β-casein layers on a quartz crystal electrode and measured the dynamics of TSM-response and changes in motional resistance during casein cleaving by the protease. The motional resistance allows for the analysis of trypsin’s possible contribution to the molecular slip at the surface during the cleavage of β-casein. Considering the results obtained, we believe that the proposed approach constitutes a useful tool for protease analysis.

2. Materials and Methods

2.1. Reagents

Ultrapure water obtained by reverse osmosis (Thermo Scientific, Waltham, MA, USA, ρ = 18.2 MΩ cm) was used for the preparation of all aqueous solutions. As a medium, 10 mM, pH 7.4 phosphate buffered saline (PBS) was used (10 mM Na2HPO4, 2 mM KH2PO4, 2.7 mM KCl and 137 mM NaCl), prepared from tablets (Sigma-Aldrich, Darmstadt, Germany). In the experiments, trypsin (Sigma-Aldrich, Mw ≈ 23,800 g/mol) served as a model protease. The concentration of bovine β-casein (≥98%, Sigma-Aldrich, Mw ≈ 24,000 g/mol) solutions, prepared in PBS, was 0.5 mg/mL. 11-mercaptoundecanoic acid (MUA, Sigma-Aldrich, Mw = 218.36), N-(3-Dimethylaminopropyl)-N0-ethylcarbodiimide (EDC, ≥98%, Sigma-Aldrich, Mw = 191.70), and N–Hydroxysuccinimide (NHS, Sigma-Aldrich, Mw = 115.09) were employed for casein immobilization. All experiments were carried out at 20 °C.

2.2. Cleaning and Modification of Gold Electrode-Coated Quartz Crystals

Symmetric gold electrode-coated quartz discs (Laptech Precision Inc., Bowmanville, ON, Canada, working area, 0.2 cm2) with a fundamental frequency of 9 MHz were soaked in a solution of 1% sodium dodecyl sulphate (SDS, Sigma-Aldrich, Mw = 288.37) for 30 min. The discs were then rinsed in a new portion of SDS for two minutes. Thereafter, they were rinsed three times with deionized water. Subsequently, they were rinsed three times in acetone. This process was successively repeated with ethanol and methanol. The discs were then dried with a gentle stream of nitrogen gas and plasma cleaned for three minutes. Further, the cleaned TSM crystals were immersed in 2 mM MUA and were incubated for 16 h to form a self-assembled monolayer. After this step, the crystals were rinsed several times with deionized water and dried under nitrogen, followed by incubation for 20 min in a 20 mM EDC and 50 mM NHS mixture in order to activate the carboxylic groups of MUA for further immobilization of bovine β-casein on the gold electrode of the quartz sensor.

2.3. TSM Measurements

AT-cut 9.0 MHz gold electrode-coated quartz crystals were incorporated into a home-built flow-through thickness shearing mode (TSM) acoustic wave device sensor system. The setup and general configuration of the flow-through system is described in reference [14]. One side of the crystal was exposed to liquid, the other one to air. The liquid was introduced using a syringe pump. Runs were performed with the crystals in the vertical position and at ambient temperature. The modified crystal was secured in the holder using two O-rings. The gold electrodes were kept in contact with the gold leads in the holder.
Resonance frequency f and motional resistance Rm were determined based on the Butterworth–van Dyke (BVD) model of a quartz crystal resonator [14]. The value of f represents the energy storage and reflects the mass changes of the oscillating layer, while Rm is related to the dissipation of energy and provides evidence of changes in the shearing viscosity of the layer [17]. The measuring procedure was as follows. Each slide was flushed through with PBS at a rate of 50 μL/min until a stable baseline was achieved (45 min), using the flow-through injection system. This step was necessary to remove any weakly adsorbed molecules of SAM at the TSM electrode surface. Next, the pump was momentarily stopped while the sample input tube was slowly placed into a β-casein solution (0.5 mg/mL in PBS) to minimize pressure effects to the system. β-casein was introduced at a rate of 50 μL/min for approximately 45 min. Once again, the pump was momentarily stopped, and the sample input tube was slowly placed back into the PBS solution. The PBS was re-introduced at a rate of 50 μL/min to remove any loosely bound casein until a stable baseline was achieved. Changes to the resonant frequency f and motional resistance Rm were noted. For proteolysis measurements, solutions with various concentrations of trypsin in PBS were flowed over TSM crystals with an immobilized β-casein layer at 50 μL/min flow rate. Trypsin and β-casein solutions were freshly prepared before each experiment.

2.4. Data Analysis

Origin version 7.5 software (Microcal Software Inc., Northampton, MA, USA) was used for curve-fitting and data analysis. Data were obtained from a minimum of 3 independent experiments.

3. Results and Discussion

In this study, we have monitored the activity of trypsin at various enzyme concentrations (from 1 to 50 nM) in the hydrolysis of a β–casein layer immobilized onto a gold surface by a carboxylate terminated self-assembled monolayer (SAM) of MUA using a TSM technique. MUA strongly binds to gold through thiol groups in a high level of molecular dimension order forming a stable SAM [19]. The formation of SAM itself enables the coupling of activated carboxylic groups with free amino groups in the β–casein, which is an effective method for immobilizing proteins on a gold surface [20,21,22].
Figure 1 illustrates a typical frequency-time plot obtained during the TSM experiment. Region 1–2 of the plot corresponds to the filling of the cell with buffer. The TSM crystal exhibited the sharp drop after exposure to casein, indicating the adsorption of the protein to the quartz crystal/liquid interface (region 2–3). The adsorption reached equilibrium in about 15 min (region 3–4). The frequency shift after the adsorption of the protein to the surfaces of the crystal was around −104.04 Hz and decreased to −75 kHz after the crystal was rinsed with buffer solution (region 5–6). The frequency did not recover to the original value obtained when the crystals were exposed to the buffer. This suggests there were two modes of casein binding to the SiO2 surface, a tightly bound layer and a weakly bound layer, and that only loosely bound casein layers were removed during the PBS washing [23]. Because the increase in fundamental frequency after PBS washing was so small, we can speculate that the majority of β-casein adsorbed on the SiO2 formed a stable immobilized layer, which makes it attractive for its potential applications in biosensors for the detection of protease activity. Further, the buffer was changed to a trypsin solution. The frequency increased asymptotically to reach a stable value indicating that the proteolysis process occurred, corresponding to the cleavage of casein (region 6–7). Then, Δf vs. time curves were recorded for different trypsin concentrations, each one with a new quartz crystal and a newly adsorbed β-casein layer.
Earlier works indicated that the Sauerbrey Equation (1) can be applied to obtain a rough estimate for the surface concentration of the adsorbed β-casein layer [18,24,25], which is valid only for the specific case of a crystal being loaded with rigid, well adhered layers in air with a minor contribution to the surface viscosity [14,26]. Therefore, for simplicity, yet with an awareness of the limitations stated above, Equation (1) was used to estimate the number of proteins on the surface (ΓQCM, ng/cm2) [24]. The average value of the frequency shift after the adsorption of the protein to hydrophilic surfaces was −165.26 ± 47.7 Hz. This average value decreased to −151.6 ± 54 Hz after rinsing with the buffer. Using these values, as well as S = 0.2 cm2 for the area of the electrode, ρ = 2.648 g/cm3 for the density of quartz, and μ = 2.947 × 10¹¹ g/cm.s2 for the shear modulus of an AT-cut quartz crystal, f0 = 9 MHz base frequency, a surface concentration of 165 ng/cm2 was obtained.
        Γ Q C M = S µ p Δ f 2 f 0 2 ,
This is in good agreement with earlier experimental works based on ellipsometry that reported 200–300 ng/cm2 for a full-coverage monolayer of β-casein [28,29]. Furthermore, QCM studies by Tatarko and co-workers estimated that the immobilized β-casein monolayer has a mass density of 350 ng/cm2 [18]. These results support the interpretation that the value of 165 ng/cm2 obtained by TSM measurements corresponds to monolayer formation.
Krisdhasima et al. developed a model for the irreversible adsorption of proteins consisting of two steps [30]. This model included an initial reversible adsorption step, followed by a surface-induced conformational change yielding an irreversible adsorbed form. Romanszki and co-workers suggested an adsorption mechanism of β-casein on hydrophilic quartz expressed in the form of a triple exponential decay with three-time constants [27]. In our case, data from β-casein assembly on hydrophilic quartz can be well fitted with a single exponential decay curve with only one-time constant τ1 (Equation (2)).
Δ f = Δ f 1 exp ( t τ 1 ) + Δ f n   ,
The fitting parameters are listed in Table 1. Our β-casein adsorption results (Figure 2) are in good agreement with previous finding of Tatarko et al., who have demonstrated a single exponential behavior of casein during the self-assembly on hydrophilic quartz crystal surfaces [18].
The response of the casein following the addition of various concentrations of trypsin in terms of relative changes of frequency is depicted in Figure 3. Protease exposure occurred at time = 0 min. The TSM signal variations were recorded during the exposure of casein to concentrations of trypsin varying from 1 to 50 nM. Upon the introduction of trypsin, the frequency rose in a sigmoidal manner, which we attribute to the cleavage of the surface-bound β-casein substrate. As expected, a higher concentration of trypsin resulted in more rapid proteolysis than a lower concentration of the protease. The limit of trypsin detection calculated from the signal to noise ratio was 0.2 nM, which is like those obtained by Tatarko et al. [18].
The TSM signal variations were recorded in terms of Rm shifts as well (Figure 4). In all experiments, after the addition of trypsin, a decrease in resistance was observed, suggesting the cleavage of casein by trypsin. The decrease in motional resistance is associated with a change in the viscoelastic properties of the sensing casein monolayer during hydrolysis. The sensing layer became more rigid, thus shielding the molecular slipping at the surface [15].
The trypsin activity curves were analyzed according to the method suggested by Romanzki et al. [27]. Curves corresponding to a certain trypsin concentration were fitted with the Hill function (Equation (3)) in order to estimate the initial reaction rate of trypsin activity.
Δ f = Δ f m a x t n k n + t n ,
where Δf max is the final frequency shift after trypsin cleavage, and k and n are fitting parameters.
Further, the fitted curves were numerically differentiated, and calibration curve was plotted against the trypsin concentration (Figure 5). An inverse Michaelis–Menten (MM) Equation (4) has been used to fit the obtained calibration curve, in which the concentration of the interfacial enzyme and substrate are interchanged. For further details, see cited reference [27]. Previously, it was demonstrated that an inverse MM model can provide a good approximation in systems where the enzyme is in excess [31]. In this case, mass conservation is also reversed so that it accounts for the substrate rather than the enzyme, leading to a symmetric equation for the initial steady state rate, which the authors term an inverse MM equation.
δ f δ t = v m a x C T R Y C M + C T R Y ,
where δ f δ t is the rate of change of frequency, v m a x  represents the maximum rate achieved by the system, CTRY is the concentration of trypsin, CM is the characteristic constant equal to the trypsin concentration that achieves half of v m a x . The fitting of calibration plots corresponding to the hydrophilic surface yielded Vmax = 0.1688 s−2 and CM = 24.38 nM.
Within the analyzed concentration range of trypsin, the initial reaction rate of the hydrolysis process taking place on the surface of the hydrophilic quartz crystal clearly demonstrated a non-linear character with respect to enzyme concentration, indicating that the specific activity of the trypsin depends on its concentration within the analyzed concentration range.

4. Conclusions

We have shown that β-casein forms a stable monolayer via an 11-mercaptoundecanoic acid (MUA) cross-linker at a gold surface. The obtained β-casein layer enabled a detection limit of 0.2 nM for trypsin. The hydrolysis of casein immobilized on the gold surface resulted in an increase of resonant frequency and a decrease of motional resistance. The obtained results can be considered as a first step toward the application of a TSM sensor based on β-casein for the detection of protease trypsin activity without the application of optical markers.

Author Contributions

Investigation, validation, formal analysis, writing—original draft preparation, S.M.; methodology, conceptualization, writing—review and editing, supervision, project administration, funding acquisition, T.H.; methodology, project administration, writing—review and editing, M.T. All authors have read and agreed to the published version of the manuscript.

Funding

This work was supported by European Union’s Horizon 2020 research and innovation programme under the Marie Sklodowska-Curie grant agreement No 690898 and by Science Grant Agency VEGA, project No. 1/0419/20.

Conflicts of Interest

The authors declare no conflict of interest.

References

  1. Gemene, K.L.; Meyerhoff, M.E. Detection of protease activities by flash chronopotentiometry using a reversible polycation-sensitive polymeric membrane electrode. Anal. Biochem. 2011, 416, 67–73. [Google Scholar] [CrossRef] [PubMed]
  2. Siklos, M.; Aissa, B.; Thatcher, G.R.J. Cysteine proteases as therapeutic targets: Does selectivity matter? A systematic review of calpain and cathepsin inhibitors. Acta Pharm. Sin. B 2015, 5, 506–519. [Google Scholar] [CrossRef] [PubMed]
  3. Glantz, M.; Rosenlow, M.; Lindmark-Månsson, H.; Johansen, L.B.; Hartmann, J.; Hojer, A.; Waak, E.; Lofgren, R.; Saeden, K.H.; Svensson, S.; et al. Impact of protease and lipase activities on quality of Swedish raw milk. Int. Dairy J. 2020, 107, 104724. [Google Scholar] [CrossRef]
  4. Verdoes, M.; Verhels, S.H.L. Detection of protease activity in cells and animal. Biochim. Biophys. Acta (BBA) Proteins Proteom. 2016, 1864, 130–142. [Google Scholar] [CrossRef]
  5. Ku, M.; Hong, Y.; Heo, D.; Lee, E.; Hwang, S.; Suh, J.-S.; Yang, J. In vivo sensing of proteolytic activity with an NSET-based NIR fluorogenic nanosensor. Biosens. Bioelectr. 2016, 77, 471–477. [Google Scholar] [CrossRef]
  6. Buss, C.G.; Dudani, J.S.; Akana, R.T.K.; Fleming, H.E.; Bhatia, S.N. Protease activity sensors noninvasively classify bacterial infections and antibiotic responses. Ebiomedicine 2018, 38, 248–256. [Google Scholar] [CrossRef] [PubMed]
  7. Mumtaz, T.; Qindeel, M.; Rehman, A.; Tarhini, M.; Ahmed, N.; Elaissari, A. Exploiting proteases for cancer theranostic through molecular imaging and drug delivery. Int. J. Pharm. 2020, 587, 119712. [Google Scholar] [CrossRef]
  8. Dunn, D.T.; Stöhr, W.; Arenas-Pinto, A.; Tostevin, A.; Mbisa, J.L.; Paton, N.I. Next generation sequencing of HIV-1 protease in the PIVOT trial of protease inhibitor monotherapy. J. Clin. Virol. 2018, 101, 63–65. [Google Scholar] [CrossRef]
  9. Kahler, U.; Kamenik, A.S.; Waibl, F.; Kraml, J.; Liedl, K.R. Protein-protein binding as a two-step mechanism: Preselection of encounter poses during the binding of BPTI and trypsin. Biophys. J. 2020, 119, 652–666. [Google Scholar] [CrossRef]
  10. Hou, S.; Feng, T.; Zhao, N.; Zhang, J.; Wang, H.; Liang, N.; Zhao, L. A carbon nanoparticle-peptide fluorescent sensor custom-made for simple and sensitive detection of trypsin. J. Pharm. Anal. 2020, in press. [Google Scholar] [CrossRef]
  11. Sato, D.; Kato, T. Novel fluorescent substrates for detection of trypsin activity and 541 inhibitor screening by self-quenching. Bioorg. Med. Chem. Lett. 2016, 26, 5736–5740. [Google Scholar] [CrossRef]
  12. Sao, K.; Murata, M.; Fujisaki, Y.; Umezaki, K.; Mori, T.; Niidome, T.; Katayama, Y.; Hashizume, M. A novel protease activity assay using a protease-responsive chaperone protein. Biochem. Biophys. Res. Commun. 2009, 383, 293–297. [Google Scholar] [CrossRef]
  13. Sakti, S.P.; Lucklum, R.; Hauptmann, P.; Bühling, F.; Ansorge, S. Disposable TSM-biosensor based on viscosity changes of the contacting medium. Biosens. Bioelect. 2001, 16, 1101–1108. [Google Scholar] [CrossRef]
  14. Cavic, B.A.; Thompson, M. Interfacial nucleic acid chemistry studied by acoustic shear wave propagation. Anal. Chim. Acta 2002, 469, 101–113. [Google Scholar] [CrossRef]
  15. Poturnayova, A.; Karpisova, I.; Castillo, G.; Mezo, G.; Kocsis, L.; Csámpai, A.; Keresztes, Z.; Hianik, T. Detection of plasmin based on specific peptide substrate using acoustic transducer. Sens. Actuators. B Chem. 2016, 223, 591–598. [Google Scholar] [CrossRef]
  16. Liu, J.; Chen, D.; Wang, P.; Song, G.; Zhang, X.; Li, Z.; Wang, Y.; Wang, J.; Yang, J. A microfabricated thickness shear mode electroacoustic resonator for the label-free detection of cardiac troponin in serum. Talanta 2020, 2015, 120890. [Google Scholar] [CrossRef] [PubMed]
  17. Šnejdárková, M.; Poturnayová, A.; Rybár, P.; Lhoták, P.; Himl, M.; Flídrová, K.; Hianik, T. High sensitive calixarene-based sensor for detection of dopamine by electrochemical and acoustic methods. Bioelectrochemistry 2010, 80, 55–61. [Google Scholar] [CrossRef] [PubMed]
  18. Tatarko, M.; Muckley, E.S.; Subjakova, V.; Goswami, M.G.; Sumpter, B.G.; Hianik, T.; Ivanov, I.N. Machine learning enabled acoustic detection of sub-nanomolar concentration of trypsin and plasmin in solution. Sens. Actuators B Chem. 2018, 272, 282–288. [Google Scholar] [CrossRef]
  19. Ahmadab, A.; Moore, E. Electrochemical immunosensor modified with self-assembled monolayer of 11-mercaptoundecanoic acid on gold electrodes for detection of benzo[a]pyrene in water. Analyst 2012, 37, 5839–5844. [Google Scholar] [CrossRef] [PubMed]
  20. Huenerbein, A.; Schmelzer, C.E.H.; Neubert, R.H.H. Real-time monitoring of peptic and tryptic digestions of bovine -casein using quartz crystal microbalance. Anal. Chim. Acta. 2007, 584, 72–77. [Google Scholar] [CrossRef] [PubMed]
  21. Yao, J.; Lin, C.; Tao, T.; Lin, F. The effect of various concentrations of papain on the properties and hydrolytic rates of -casein layers. Colloids Surf. B Biointerfaces 2013, 101, 272–279. [Google Scholar] [CrossRef] [PubMed]
  22. Murray, B.S.; Cros, L. Adsorption of β-lactoglobulin and β-casein to metal surfaces and their removal by a non-ionic surfactant, as monitored via a quartz crystal microbalance. Colloids Surf. B Biointerfaces 1998, 10, 227–241. [Google Scholar] [CrossRef]
  23. Ozeki, T.; Verma, V.; Uppalapati, M.; Suzuki, Y.; Nakamura, M.; Catchmark, J.M.; Hancock, W.O. Surface-bound casein modulates the adsorption and activity of kinesin on SiO2 surfaces. Biophys. J. 2009, 96, 3305–3318. [Google Scholar] [CrossRef] [PubMed]
  24. Goda, T.; Miyahara, Y. Interpretation of protein adsorption through its intrinsic electric charges: A comparative study using a field-effect transistor, surface plasmon resonance, and quartz crystal microbalance. Langmuir 2012, 28, 14730–14738. [Google Scholar] [CrossRef] [PubMed]
  25. Pérez-Fuentes, L.; Drummond, C.; Faraudo, J.; Bastos-González, D. Adsorption of milk proteins (β-casein and β-lactoglobulin) and BSA onto hydrophobic surfaces. Materials 2017, 10, 893. [Google Scholar] [CrossRef]
  26. Miodek, A.; Poturnayová, A.; Šnejdárková, M.; Hianik, T.; Korri-Youssoufi, H. Binding kinetics of human cellular prion detection by DNA aptamers immobilized on a conducting polypyrrole. Anal. Bioanal. Chem. 2013, 405, 2505–2514. [Google Scholar] [CrossRef]
  27. Románszki, L.; Tatarko, M.; Jiao, M.; Keresztes, Z.; Hianik, T.; Thompson, M. Casein probe–based fast plasmin determination in the picomolar range by an ultra-high frequency acoustic wave biosensor. Sens. Actuators B Chem. 2018, 275, 206–214. [Google Scholar] [CrossRef]
  28. Nylander, T.; Wahlgren, N.M. Competitive and sequential adsorption of β-casein and β-lactoglobulin on hydrophobic surfaces and the interfacial structure of β-casein. J. Colloid Interface Sci. 1994, 162, 151–162. [Google Scholar] [CrossRef]
  29. Nylander, T.; Tiberg, F.; Wahlgren, N.M. Evaluation of the structure of adsorbed layers of β-casein from ellipsometry and surface force measurements. Int. Dairy J. 1999, 9, 313–317. [Google Scholar] [CrossRef]
  30. Krisdhasima, V.; Vinaraphong, P.; McGuire, J. Adsorption kinetics and elutability of α-lactalbumin, β-casein, β-lactoglobulin, and bovine serum albumin at hydrophobic and hydrophilic interfaces. J. Colloid Interface Sci. 1993, 161, 325–334. [Google Scholar] [CrossRef]
  31. Kari, J.; Andersen, M.; Borch, K.; Westh, P. An inverse Michaelis-Menten approach for interfacial enzyme kinetics. Catalysis 2017, 7, 4904–4914. [Google Scholar] [CrossRef]
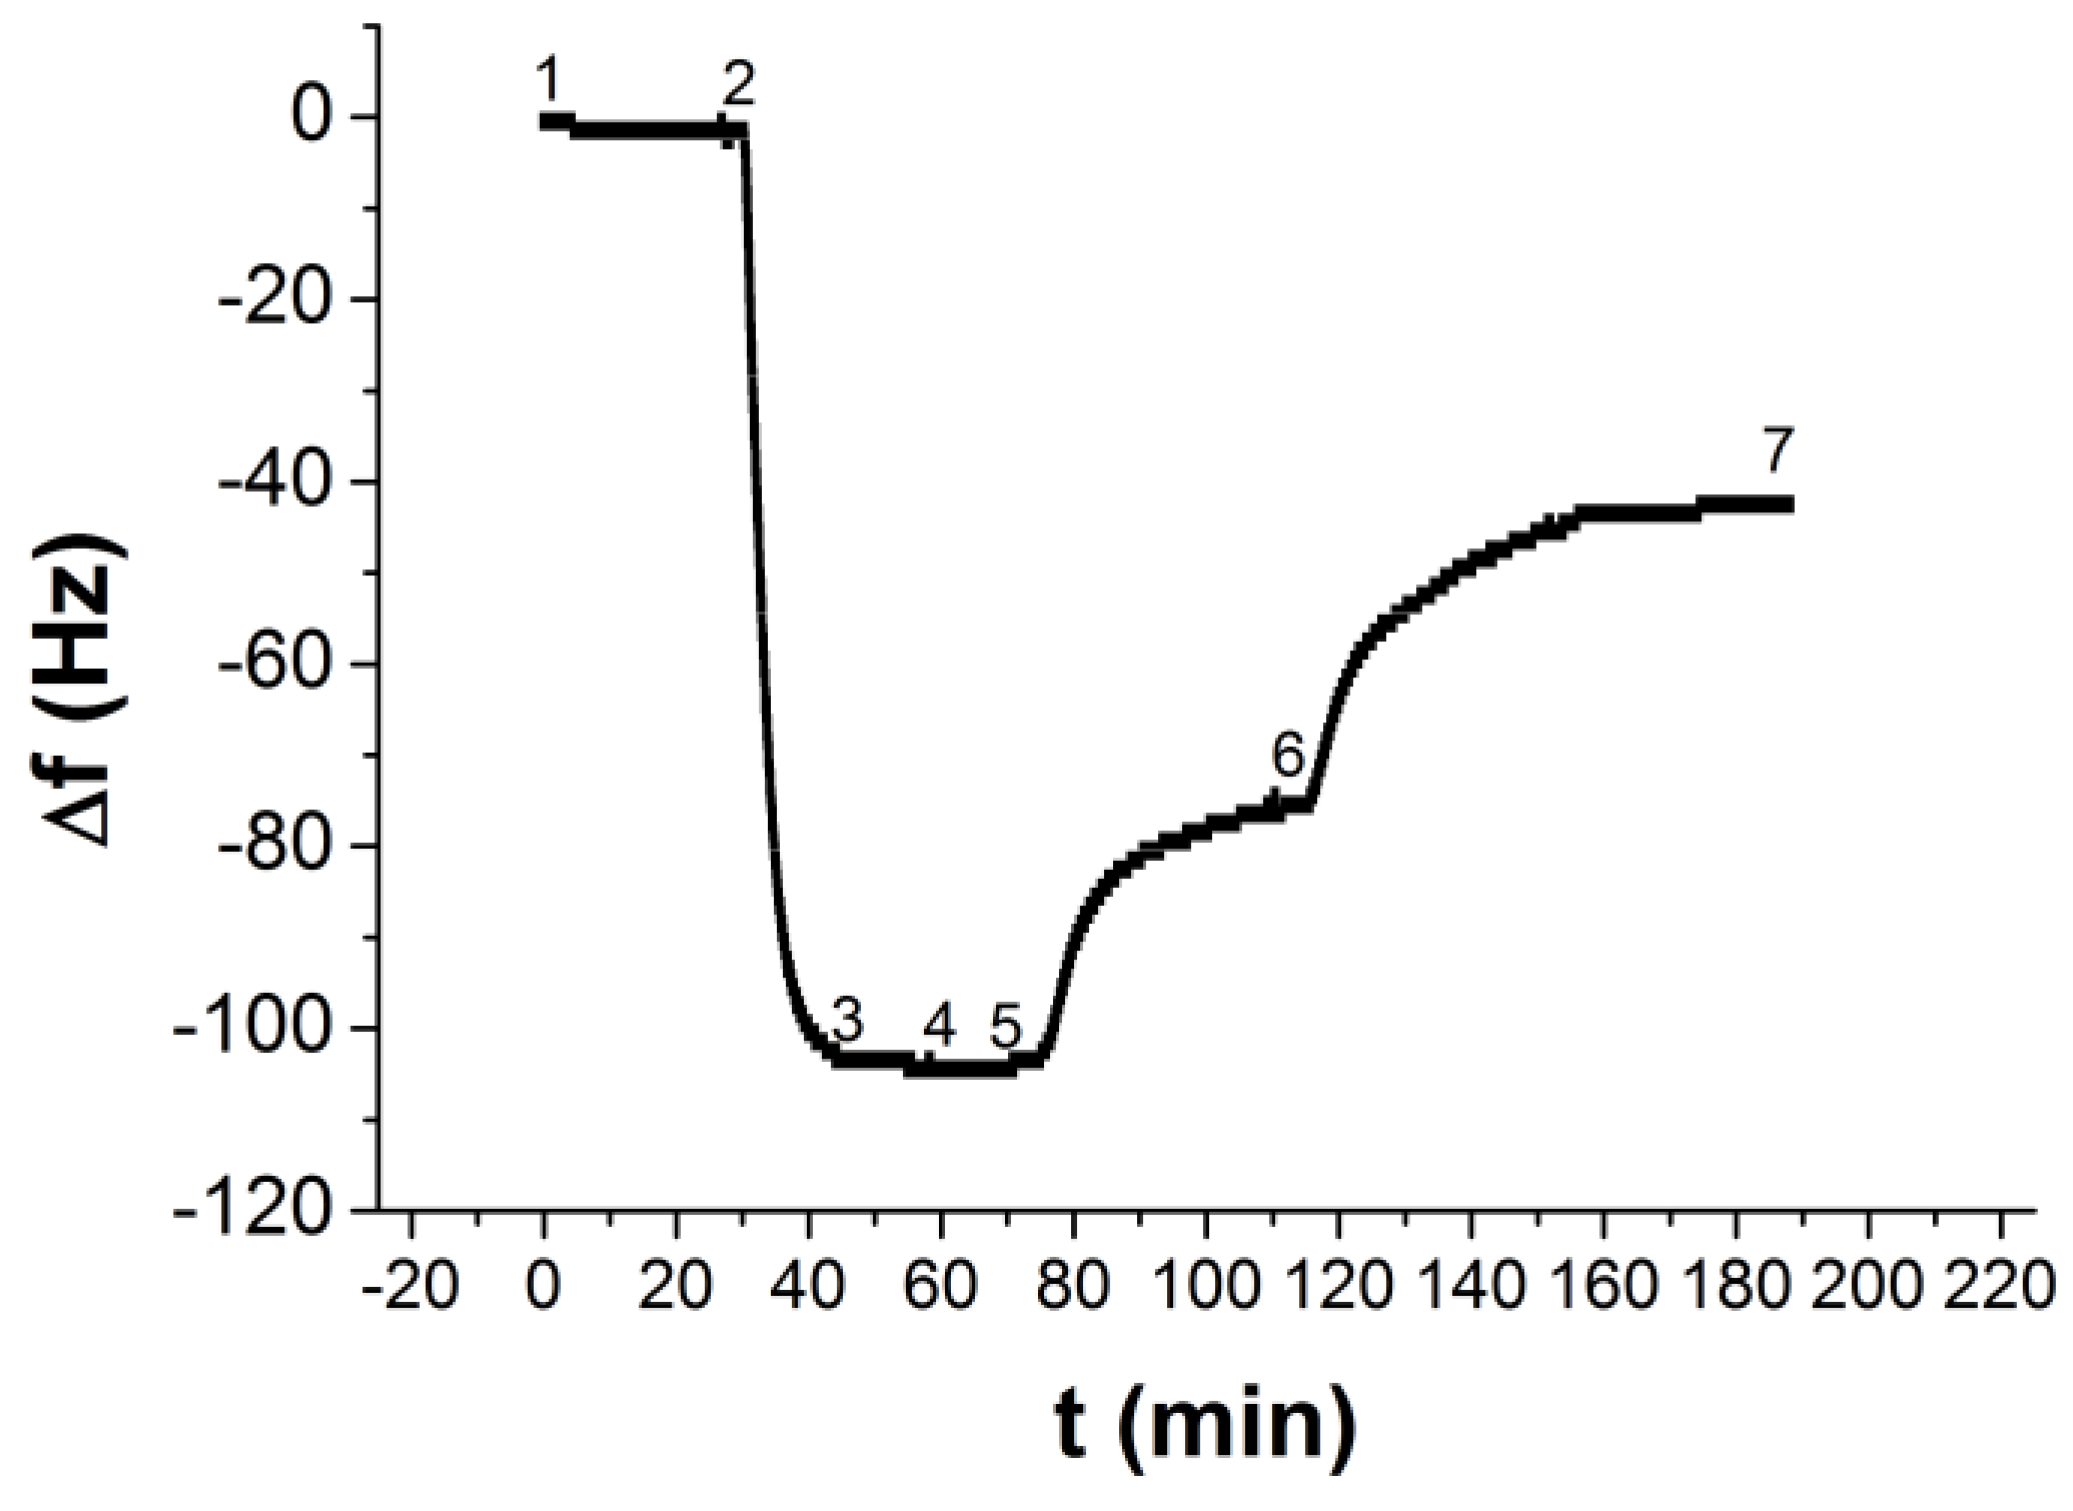
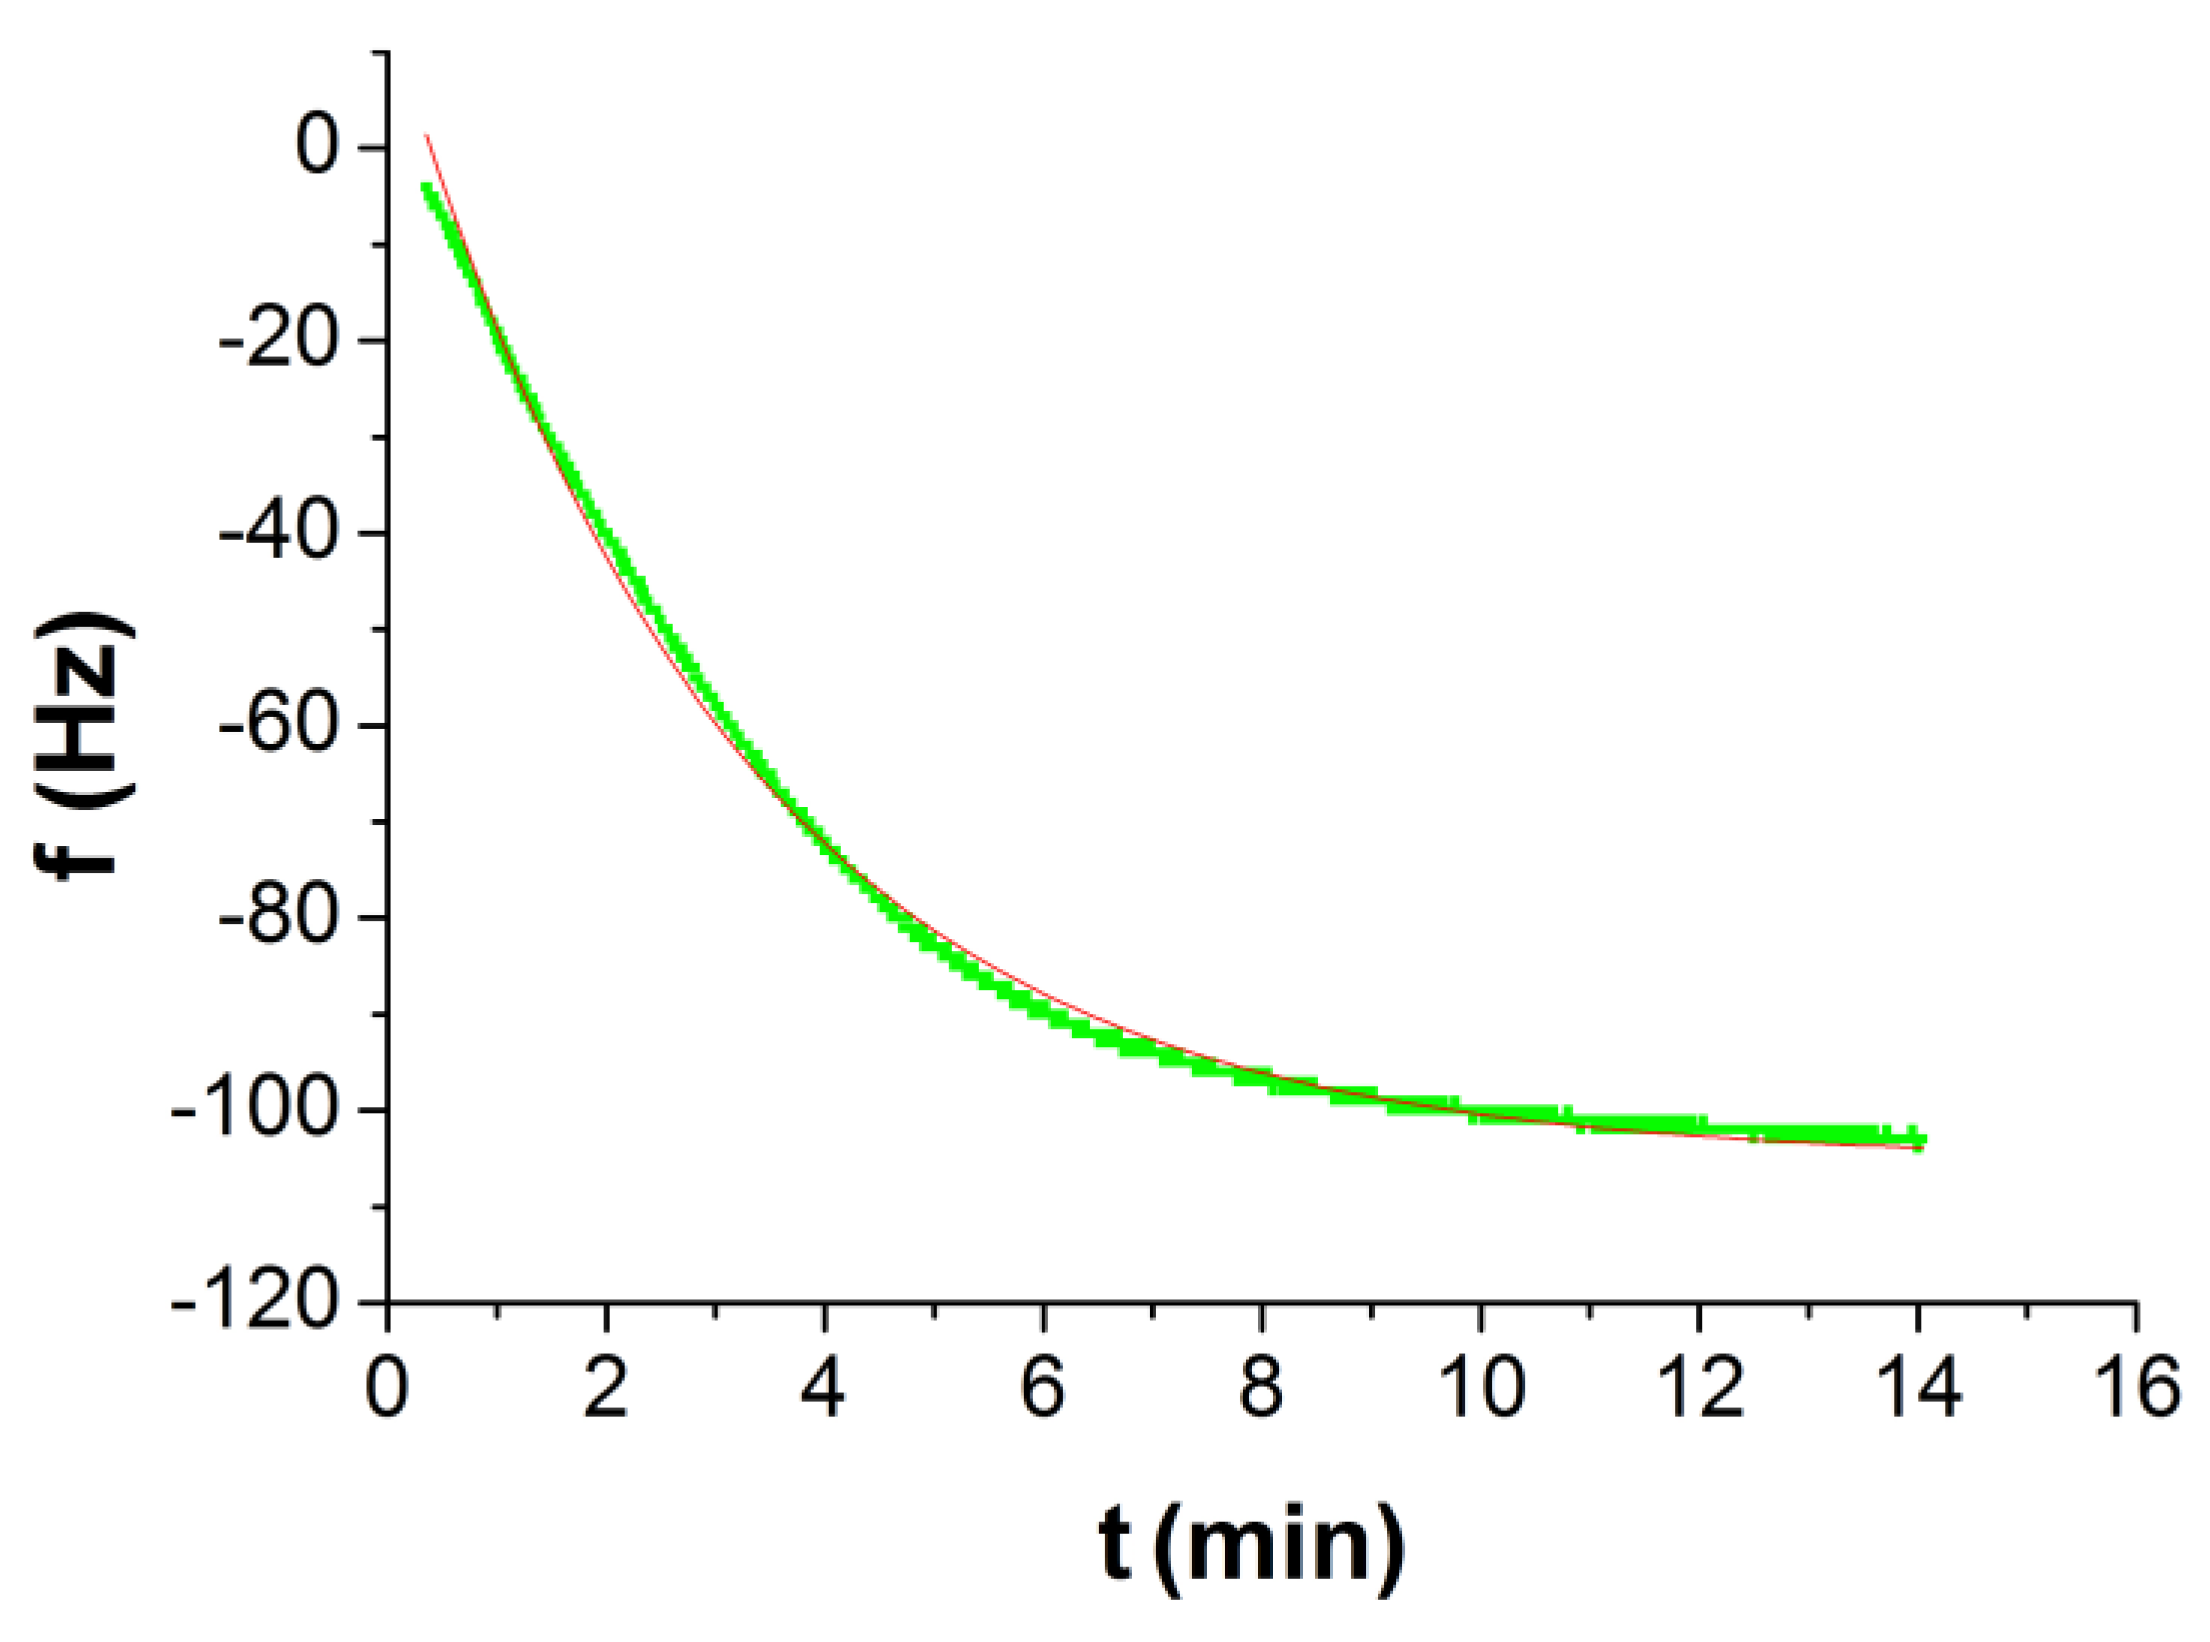
Figure 1. Typical frequency-time plot obtained during TSM experiment. 1–2: Stable baseline; 2–3: Adsorption of β-casein to the quartz crystal/liquid interface; 3–4: Adsorption of β-casein completed; 4–5: Stabilization of signal; 5–6: Washing with buffer; 6–7: Cleavage of β-casein layer by trypsin. In this experiment, 10 nM trypsin was used.
Proceedings 60 00006 g001
Figure 2. Adsorption curves of β-casein on 11-mercaptoundecanoic acid (MUA)-coated hydrophilic quartz crystal in terms of Δf frequency change. The fitted curve marked in red represents the single exponential function.
Proceedings 60 00006 g002
Figure 3. The time profile curves of trypsin activity on β-casein at different trypsin concentrations in terms of Δf frequency changes of a thickness-shear mode (TSM) crystal modified by MUA, points from TSM measurements, and fitted Hill curves.
Proceedings 60 00006 g003
Figure 4. The time profile curves of trypsin activity on β-casein at different trypsin concentrations in terms of changes in motional resistance, ΔRm, of the TSM crystal modified by MUA.
Proceedings 60 00006 g004
Figure 5. δf/δt rates of initial frequency change for the TSM crystal determined at different Ctrypsin trypsin concentrations. Symbols are experimental data and line is the best fit of Equation (4).
Proceedings 60 00006 g005
Table 1. Fitting parameters of the adsorption of β-casein hydrophilic quartz.
τ1 (s)Δf1 (Hz)Δfn (Hz)
186119.32−105.15
Publisher’s Note: MDPI stays neutral with regard to jurisdictional claims in published maps and institutional affiliations.

