Proceeding Paper

Development and Optimization of an Amperometric Immunosensor for the Detection of Banned Antibiotic Residues in Honey †

Anses, Laboratory of Fougeres, European Union Reference Laboratory (EU-RL) for Antimicrobial and Dye Residue Control in Food-Producing Animals, La Haute Marche-Javené, 35302 Fougères, France
*
Author to whom correspondence should be addressed.
Presented at the 1st International Electronic Conference on Biosensors, 2–17 November 2020; Available online: https://iecb2020.sciforum.net/.
Proceedings 2020, 60(1), 48; https://doi.org/10.3390/IECB2020-07019
Published: 2 November 2020
(This article belongs to the Proceedings of The 1st International Electronic Conference on Biosensors)

Abstract

:
Veterinary drugs could contaminate animal-derived food products for human consumption. Some antibiotic residues (e.g., chloramphenicol (CAP), nitrofuran metabolites) are banned in foodstuffs of animal origin (e.g., milk, honey, etc.) in the European Union because of toxicological risks for the consumer. Screening methods applied for food safety monitoring should be sensitive, specific, cheap, quick, and portable for field testing (e.g., self-control). Electrochemical biosensors make it possible to develop a promising and economically interesting approach. An innovative and cheap electrochemical method based on disposable screen-printed carbon electrodes (SPCE), coupled to magnetic beads (MB), that allows the simultaneous detection of three families of antibiotics in milk was published by a Spanish academic team. When the biosensor method was applied to detect CAP residues in honey, two major issues were identified: firstly, the very low levels of residues to reach (i.e., regulatory limits below 1 µg/kg), and secondly, the complexity of the honey matrix; there is not a single honey matrix. Honey composition and color vary considerably depending on the botanical origin. Moreover, some honey ingredients can interfere with the electrochemical detection, especially substances with antioxidant activities (e.g., polyphenols). Therefore, in parallel with the optimization of the electrochemical method, the reduction of matrix effects was a big challenge.

1. Introduction

Antimicrobial substances can be used to treat animals for preventive or curative purposes. The treatments could lead to the presence of residues because of the distribution of the active substance in the animal body, its metabolization, and its excretion. Therefore, antimicrobial residues could be found in animal derived food products (e.g., milk, meat, eggs, honey, etc.). For authorized antimicrobials, maximum residue limits (MRL) have been established for consumer protection based on toxicological data and food consumption [1]. Nevertheless, some antimicrobials with proven toxicity have been banned for use in livestock animals. For banned substances, minimum required performance limits (MRPLs) have been defined [2]. MRPLs correspond to the minimum content of an analyte in a sample, which at least has to be detected and confirmed. In order to monitor the presence of these residues in different foodstuffs, surveillance and control plans (SCPs) are put in place in each Member State according to Directive 96/23/EC [3], now replaced by Regulation (EU) No. 2017/625 [4]. Two types of methods are implemented in monitoring plans: firstly, screening methods, which generally give a qualitative result (positive (suspect) or negative (compliant)). If the result is positive, a confirmation step is required to identify and quantify the antimicrobial residues. Confirmatory methods are physico-chemical methods based on liquid chromatography coupled mass spectrometry in tandem (LC-MS/MS). MRPLs have been set to harmonize the analytical performance of these methods.
The screening step is crucial because it is the first step of the control. Screening methods should be cheap, quick, sensitive (<5% of false negative results), specific for banned antimicrobials, and with high throughput of samples. Chloramphenicol (CAP) is an efficient, cheap, and wide spectrum antimicrobial. It has been banned since 1993 because of the risks of aplastic anemia and bone marrow suppression [5,6]. Bees, like all animals, are susceptible to bacteria, viruses, and parasites (e.g., American foulbrood). Very few treatments are authorized in apiculture. Even authorized antimicrobials for other food-producing animals are not authorized in bee products. Chloramphenicol is also banned in honey and other bee products. However, the illegal use of CAP could lead to the presence of residues in honey. It is of the utmost importance to look for antimicrobial residues in honey. The monitoring of antimicrobials in honey is performed by official control laboratories and by industries for autocontrol purposes. The MRPL of CAP was set at 0.3 µg/kg for all animal-derived food products.
Immunological methods (i.e., ELISA kits, radioimmunoassays (RIA)) and LC-MS/MS methods are commonly used monitoring methods. ELISA tests are available for the screening of CAP in food products at or below the MRPL [7], and especially in honey [8,9,10]. Historically, immunological methods were the only ones used for the screening of CAP. For twenty years, LC-MS/MS methods have been used more and more for official controls. They have gradually replaced biological ones because they allow for the identification and quantification of a large number of antimicrobials with a single method (broad spectrum), with very good specificity and lower detection levels than those of biological methods. Each ELISA test is able to detect only one single compound [8,11]. On the other hand, multi-residue LC-MS/MS methods have been developed for the screening (identification) of several banned substances simultaneously [12,13,14]. However, LC-MS/MS methods need high cost equipment and specifically trained people. These systems are not fitted for field controls. The multiplexing potential of biosensors could be an alternative to LC-MS/MS methods for the simultaneous detection of several antimicrobial residues. A commercial system, named Evidence Investigator™ (Randox, United Kingdom), is based on biochip array technology (BAT) and on chemiluminescence detection. The detection of CAP in honey could be performed using a kit named AM III® (AntiMicrobial array), which is specific for the detection of CAP or AM V for the simultaneous detection of CAP and nitroimidazoles. However, it is a quite expensive method regarding the investment in the system and the cost of the kits. On the contrary, our project aimed to develop a cheap and sensitive biosensor for the detection of CAP. The perspective will be to develop an innovative multiplex amperometric biosensor for the simultaneous detection of CAP and nitrofuran metabolites in honey. Attempts have been made to develop optical biosensors (e.g., surface plasmon resonance (SPR) for the screening of CAP in different food matrices [15,16])). However, the high cost of investment has considerably slowed down the field applications of this system. Electrochemical biosensors represent a promising alternative to optical biosensors, especially for food safety applications, because they are cost-effective, quick and portable systems [17,18,19].
Most of the biosensors developed for the detection of CAP were optical (colorimetric, fluorometric) and electrochemical biosensors [20]. Colorimetric sensors are interesting because of their naked-eye potential, when fluorometric sensors require an instrumental reading. Optical biosensors are sensitive, specific, simple and quick biosensors for CAP detection. The detection capabilities of electrochemical sensors were shown to be lower than those of optical sensors. In particular, voltametric and electrochemiluminescent sensors were the most sensitive. Therefore, we decided to focus this work on electrochemical biosensors as a cheap, sensitive, and selective alternative to ELISA tests and LC-MS/MS methods. Electrochemical biosensors for the detection of antimicrobial residues were firstly developed based on antibodies as recognition elements (i.e., immunosensors). More recently, aptasensors have become more and more prevalent in the literature [20]. However, very few aptamers against antimicrobials are commercially available. The detection methods for electrochemical biosensors are diverse (i.e., amperometry, potentiometry, field-effect transistors (FETs), conductometry [21]). A Spanish team worked on the detection of different families of antimicrobial residues in milk by amperometric detection [22,23,24] and finally succeeded to develop a multiplex immunosensor for the detection of three families of antimicrobials simultaneously [25]. They obtained very promising results regarding the sensitivity of the developed methods. This immunosensor is based on the binding of antibodies against the antimicrobial residue to magnetic beads. Then, the analyte (i.e., the antimicrobial residue) competes with the horseradish peroxidase (HRP)-conjugate (HRP bound to the analyte) to bind to the antibodies. At the end, the electrochemical activity of the enzyme HRP is measured by amperometry on screen-printed carbon electrodes (SPCE). The concentration of antimicrobial residues is inversely proportional to the electrochemical signal because it is a competitive immunoassay. The aim of this work was to develop a similar bead-based amperometric immunosensor for the detection of chloramphenicol in honey.
The aim of this work was to develop and to optimize an amperometric biosensor for the detection of CAP in honey. The project consisted of two steps: optimization of the sensor and then development of an extraction protocol for honey samples to remove matrix interferences. The first results in buffer with simple amperometric conditions were very promising and satisfactory, as well as preliminary results in one single acacia honey sample. Different extraction protocols (liquid/liquid extraction (LLE)) were tested to obtain an optimal detection capability, at or below 0.3 ng/g (CAP MRPL). When analyzing honey samples from different botanical origins, with different colors and textures, high matrix effects were observed. Regarding each individual sample, it was possible to discriminate blank samples from samples spiked with CAP to 0.3 ng/g. However, a global analysis was impossible due to the high variability of honey samples and to high matrix interferences. We started to explore some paths to solve this issue, but a lot of work remains.

2. Materials and Methods

2.1. Antibiotic Standards

Chloramphenicol (CRM) (CAS (Chemical Abstracts Service) number: 56-75-7) was purchased from Sigma Aldrich (Saint-Quentin Fallavier, France).

2.2. Reagents

All buffer solutions were prepared with Milli-Q® water. PBS (Phosphate Buffered Saline) at pH 7.5 contained 0.01 M of phosphate buffer, 137 mM of NaCl (Acros Organics, reference 207790010) and 2.7 mM of KCl (Merck Chemicals, 104936). PBS-T (PBS-Tween) was derived from this PBS solution, to which 0.05% Tween 20 (Sigma Aldrich, Saint-Quentin Fallavier, France, reference P1379) was added. The phosphate buffered solutions at 0.05 M pH 6.0 and 0.1 M pH 6.0 were prepared from Na2HPO4·2H2O (Labosi, Fisher Scientific A4894351) and NaH2PO4 (Merck, 1.06345.1000).
Hydrogen peroxide (H2O2) (Sigma Aldrich, France, reference H-0904) and hydroquinone (Sigma Aldrich, France, reference H9003) were prepared in phosphate buffer.
The antibody anti-chloramphenicol (reference PAS 9681) and the conjugate CAP-HRP (reference HRP9263) were purchased from Randox Life Sciences (UK).
Magnetic beads (MBs) Protein G InVitrogen Dynabeads® (reference 10003D) were purchased from ThermoFisher Scientific (France). The magnetic beads contain protein G on their surface that facilitate the immobilization of antibodies by their Fc regions.
Poly(vinylpolypyrrolidone) (PVPP) was purchased from Sigma Aldrich (France, reference 77627).

2.3. Preparation of Spiked Honey

Honeys from different floral origins and from different suppliers have been collected. These honey samples have already been tested for the presence of antimicrobial residues with AM I and AM II kits (Randox, Crumlin, UK) with the Evidence Investigator™ system.
A stock solution of CAP at 1 mg/mL was prepared in methanol and stored at −20 °C for 1 year. Then, the stock solution was diluted to prepare spiking solutions at different concentrations. Spiking working solutions were prepared day-to-day. The final dilution in honey was always performed by adding 50 µL of spiking solution to 1 g of honey.

2.4. Materials

The potentiostat (STAT300) supplied by Methrom (Herisau, Switzerland) was connected via USB (Universal Serial Bus) to a computer installed with Dropview 8400 software (Methrom, Herisau, Switzerland).
Magnetic rack magnetic support (reference MAGNET16TUBE05) was purchased from DropSens (Oviedo, Spain). The thermoshaker (reference TS-100) was commercialized by BioSan (Guibeville, France).
Non-modified screen-printed carbon electrodes (SPCE) (reference DRP-110) and SPCE modified with carboxyl-functionalized multi-walled carbon nanotubes (MWCNT-COOH) (110CNT) were purchased from Methrom, Switzerland. An SPCE consists of a ceramic substrate incorporating the electrochemical cell. DRP-110 electrodes consisted of working (4 mm diameter) and counter electrodes made of carbon; the reference electrode was silver. The 110CNT carbon nanotubes consisted of a working electrode (4 mm diameter) made of multi-walled carbon nanotubes (MWCNT); the counter electrode was made of carbon, whereas the reference electrode and electric contacts were made of silver.

2.5. Sample Preparation for Analyses

Different extraction procedures for honey samples have been tested to find the optimized procedure. These different procedures are presented with the results.

2.6. Assay Protocol

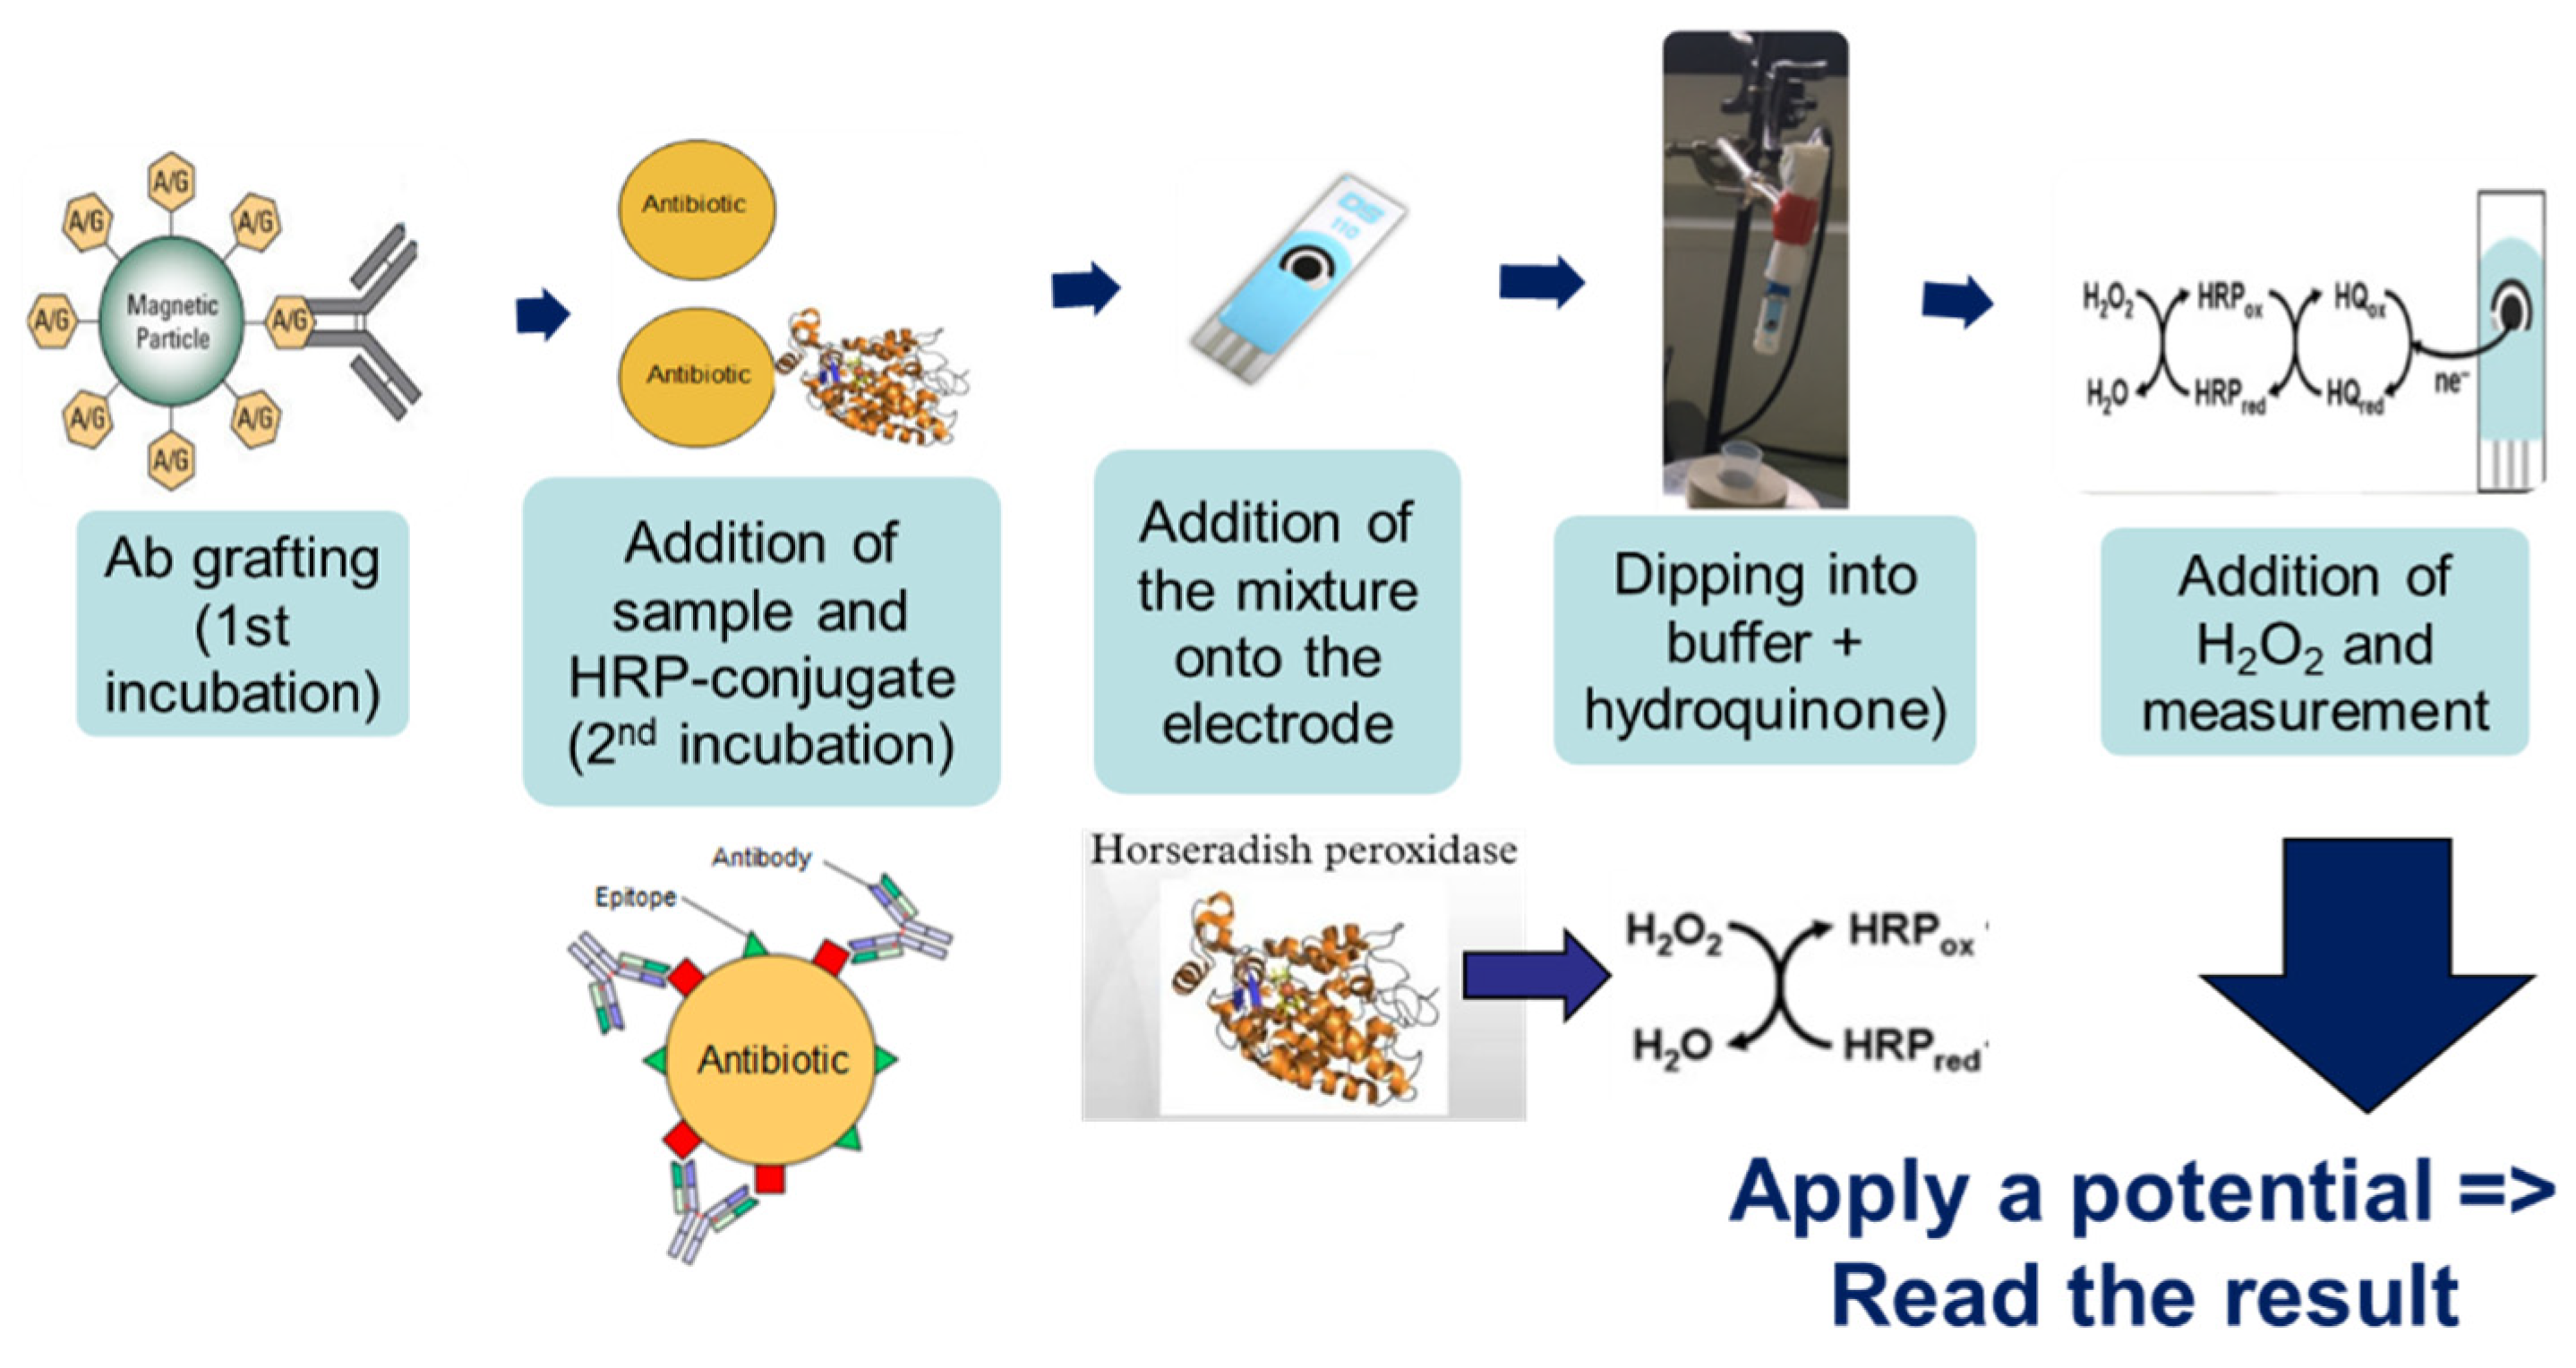
The method’s general principle was based on immuno-competition between the CAP–HRP conjugate and the antimicrobial present (or not) in the sample for binding to the antibodies (Ab) pre-grafted onto magnetic beads (Figure 1). If there was no CAP in the sample (blank sample), the conjugate was able to bind to the antibody, and so a large quantity of HRP could react with H2O2 during the electrochemical reaction, thus generating a large amperometric signal. On the other hand, if CAP was present in the sample, there was competition between CAP and the HRP-conjugate; therefore, less CAP–HRP was bound to Ab–MBs, and the amperometric signal decreased.
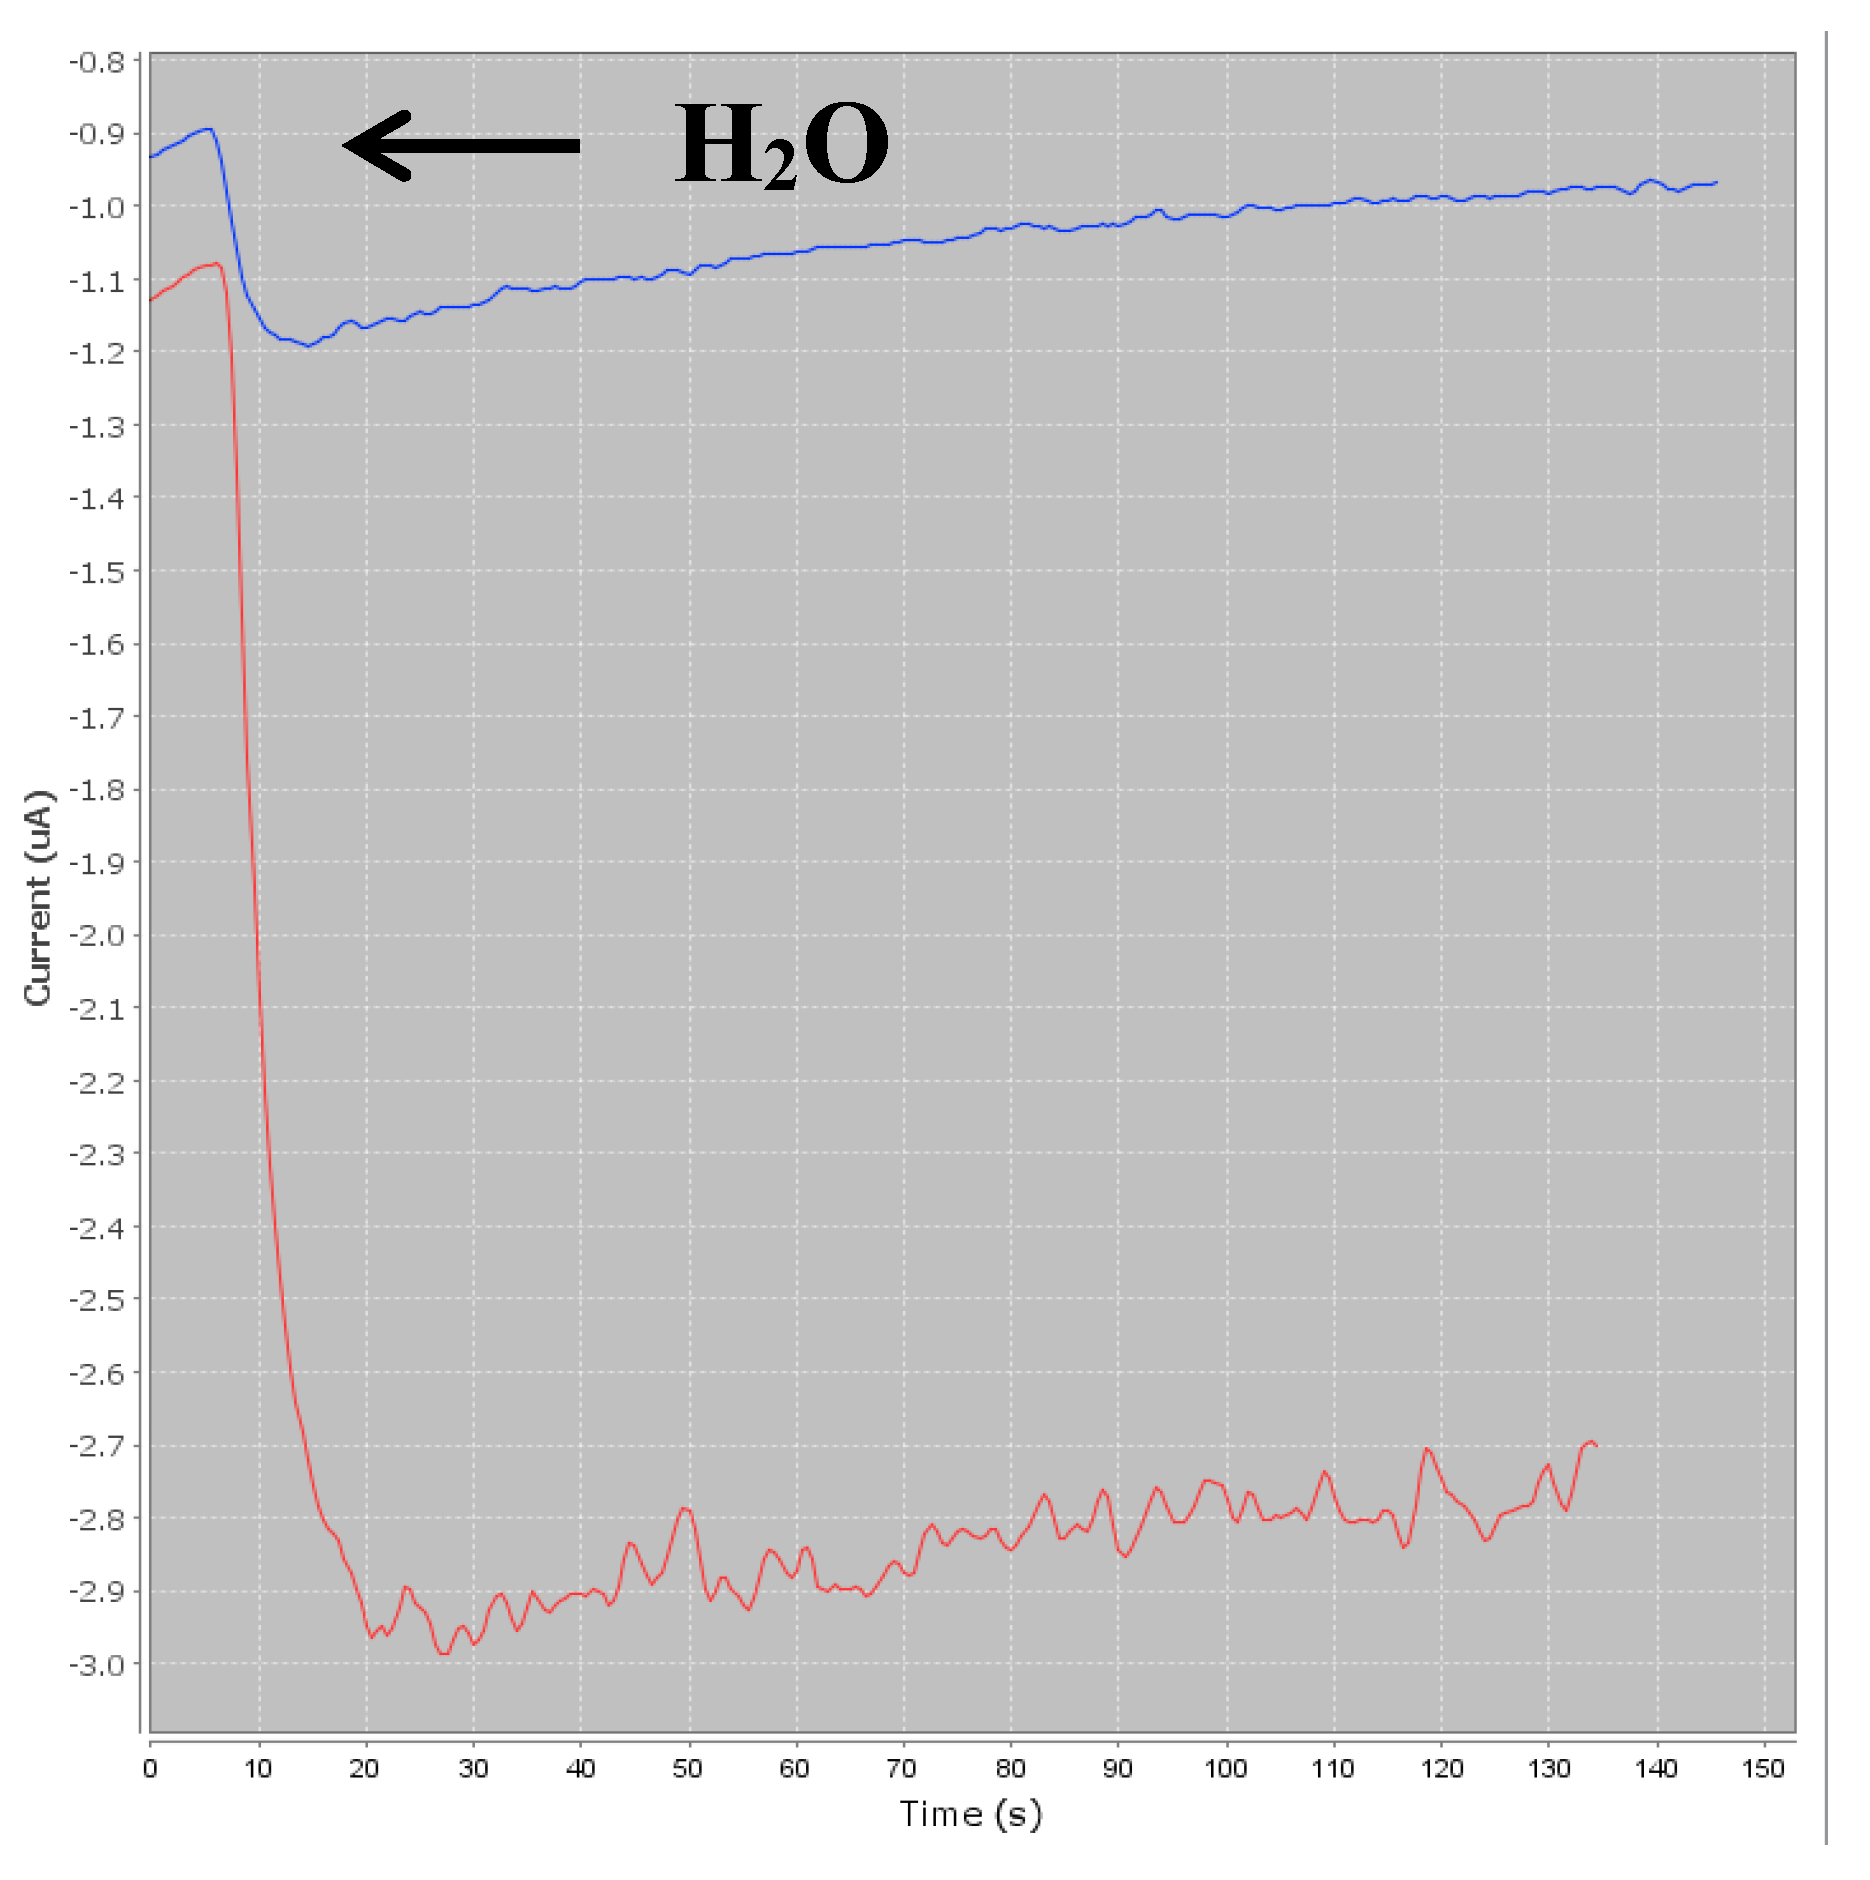
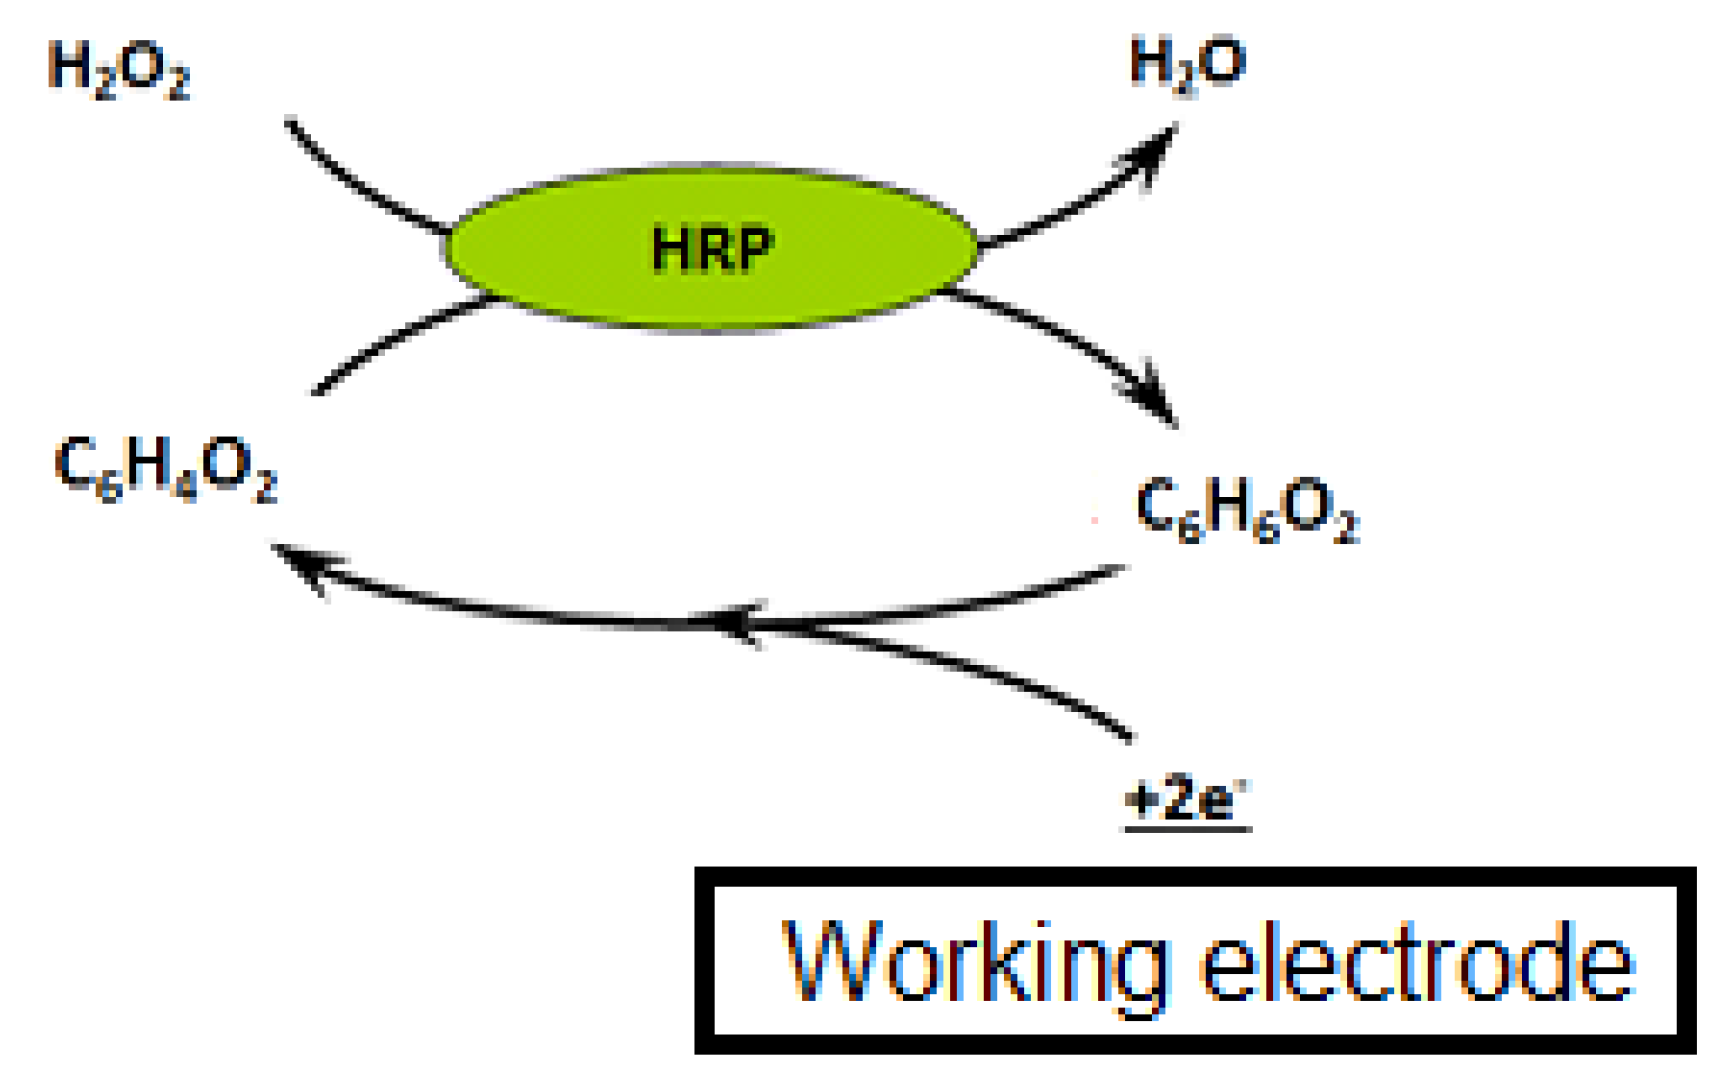
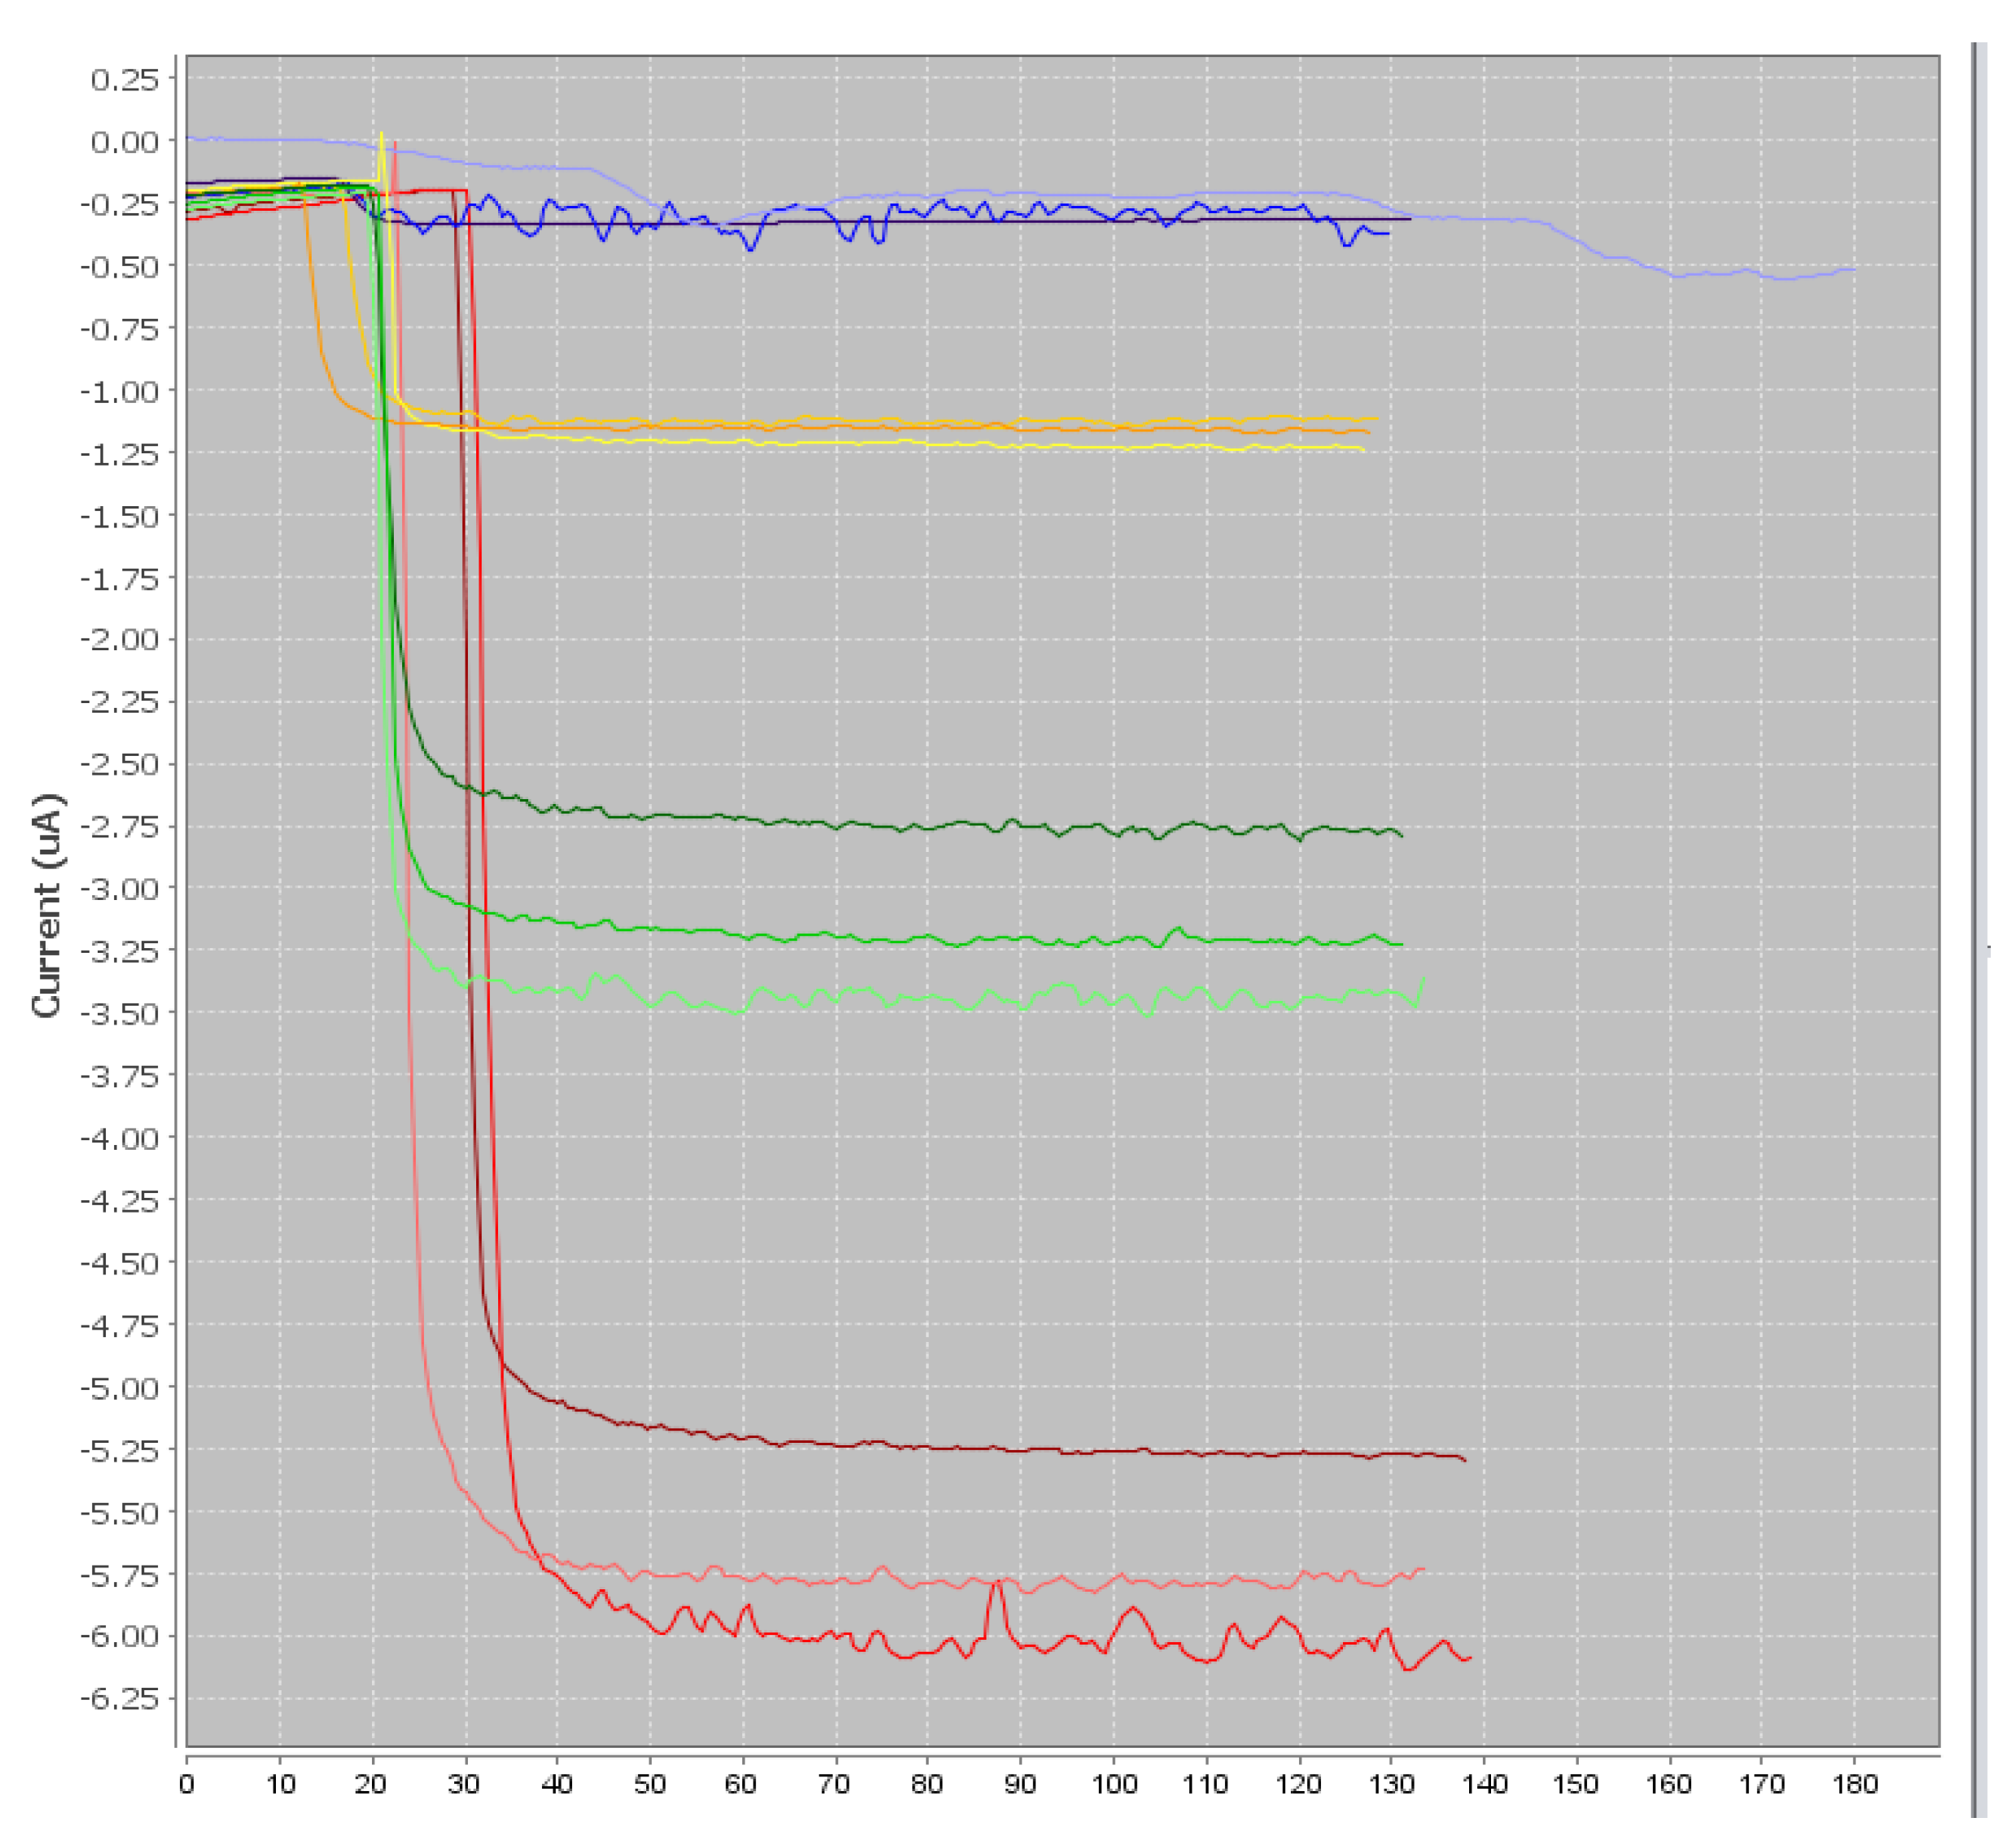
Three microliters of beads were rinsed twice with PBS to remove the sodium azide preservative, then the supernatant was separated from the beads using a magnetic support that retains the beads on the walls of the tubes. These beads were then placed in contact with 50 µL of antibodies. The antibodies were grafted in a thermoshaker for 30 min at 37 °C and at 1200 rpm. Then, the beads were washed twice in PBS-T to remove any unbound antibodies. Fifty microliters of a mix of PBS-T (or a CAP solution or honey sample) with CAP–HRP conjugate were added to the tube. While the incubation was taking place, a solution of hydroquinone (275 mg to 25 mL phosphate buffer) was prepared in phosphate buffer, as well as a solution of hydrogen peroxide (520 µL to 5 mL of phosphate buffer). After incubation, the beads were rinsed twice with PBS-T (100 µL) to remove compounds in excess that were not attached to the antibodies and the honey extract. Pending reading of the results, the beads were set aside in 50 µL of phosphate buffer. Then, 50 µL of magnetic beads were deposited on the electrode, which itself was attached to a magnetic support, which was plunged into an electrochemical cell containing 12 mL of phosphate buffer and 1300 µL of hydroquinone solution. Hydroquinone acts as an electron transducer to facilitate the redox reaction of hydrogen peroxide catalyzed by HRP. Electrons will be taken up by the hydroquinone, and therefore be taken up by the electrode, and this signal will be converted to a readable signal by the computer (Figure 2). A known potential (−0.25 V) was applied to the electrode and when a well-stabilized baseline appeared on the screen, 65 µL of H2O2 solution was added (Figure 3).

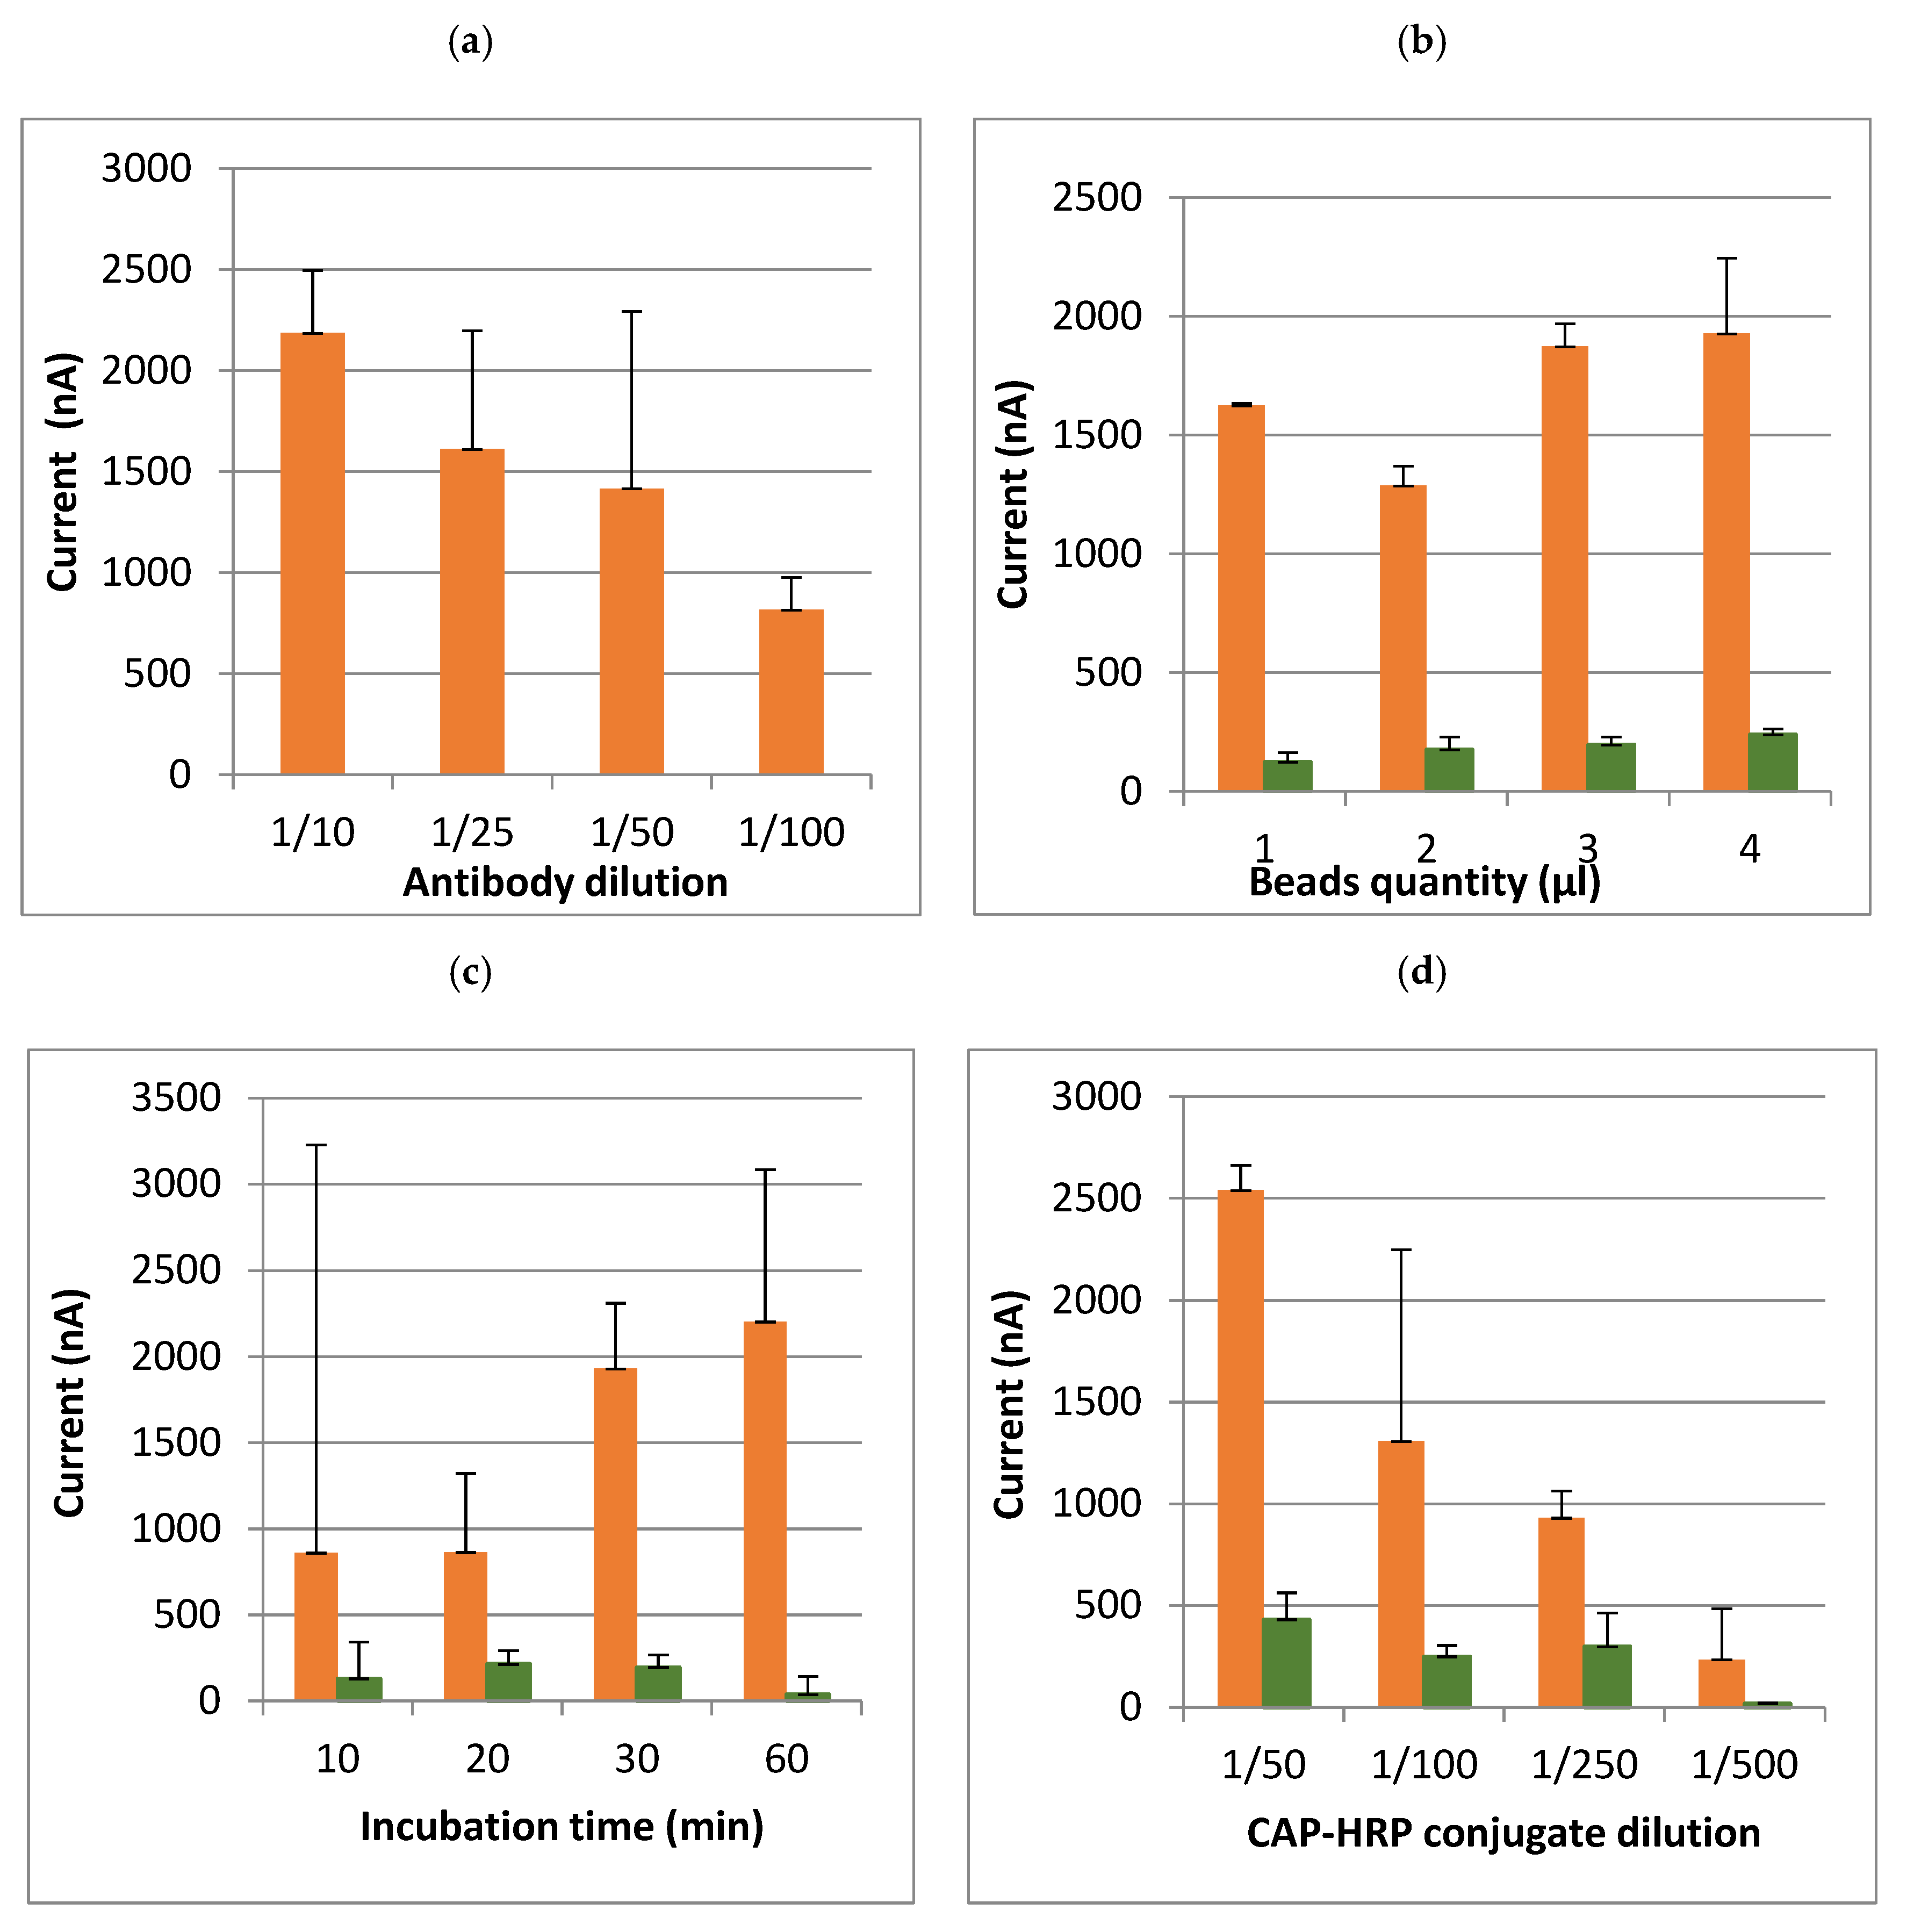
2.7. Optimization of Assay Conditions

Before starting the optimization, the first test was carried out with a moderate quantity of beads (5 µL) and a high concentration of antibodies and conjugate in PBS-T. Then, the assay conditions were optimized in buffer with a CAP concentration of 10 ng/mL.
The aim of the optimization was to determine the technical conditions that were a compromise between sensitivity (limit of detection, at least less than or equal to the regulatory limit), and cost of analysis. Several steps in the method have been optimized (
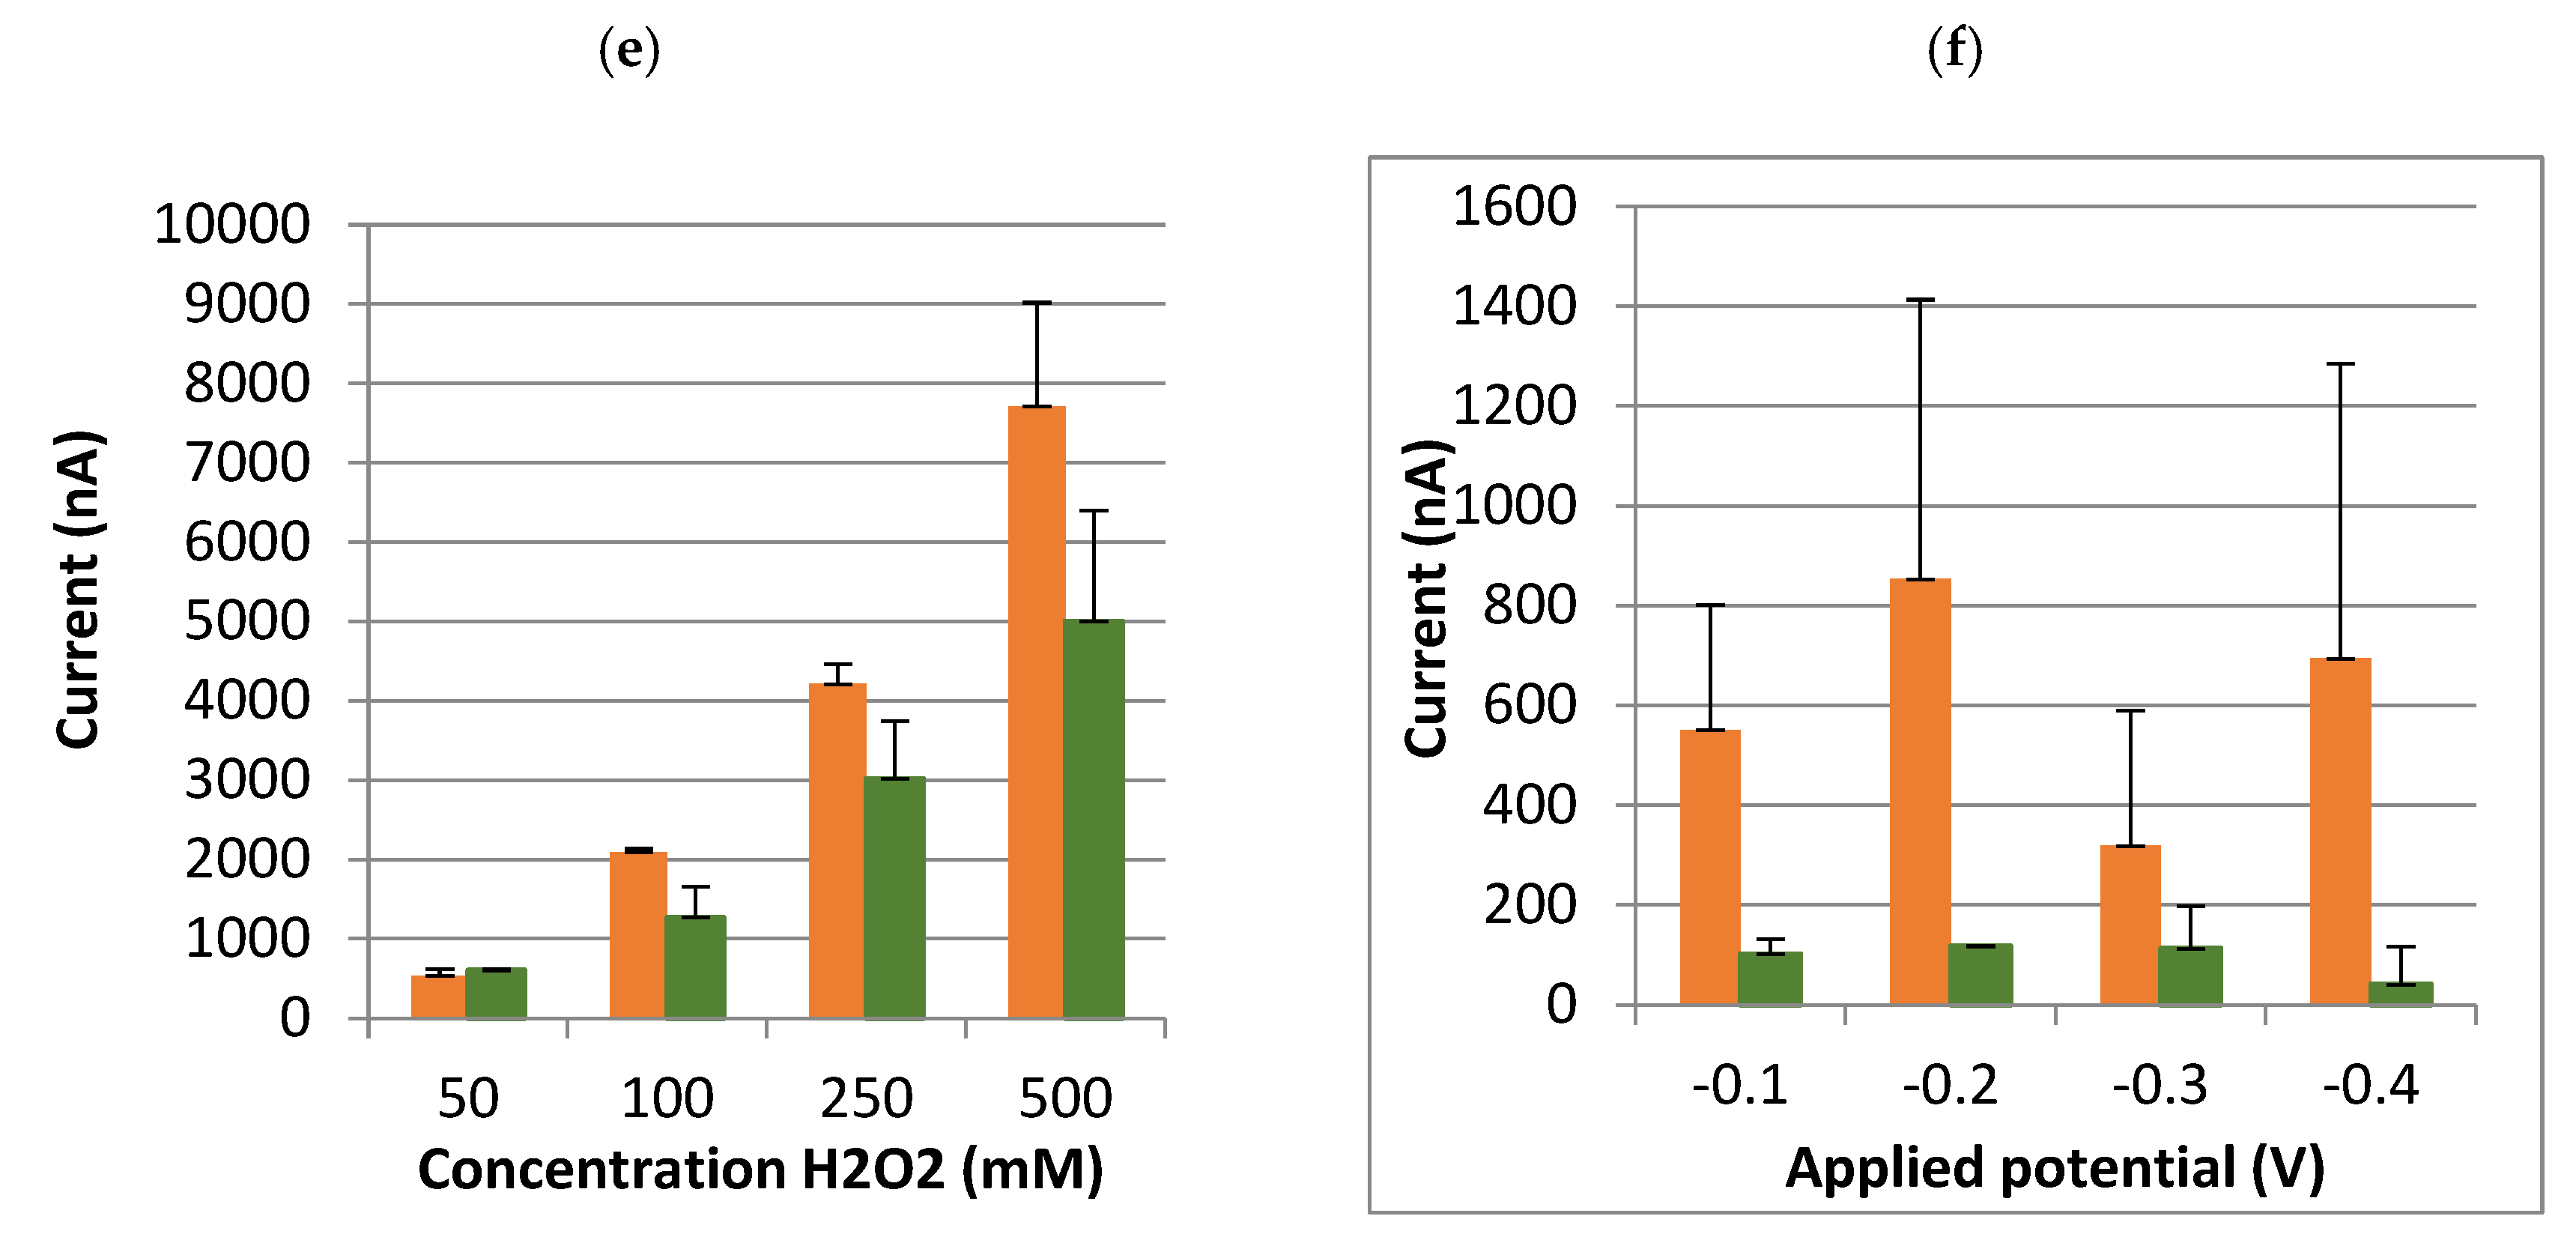
Table 1): quantity of magnetic beads, temperature, time and intensity of rotation for the antibody incubation with the beads, CAP–HRP conjugate, hydroquinone and hydrogen peroxide concentrations, and incubation methods (i.e., a single incubation or a sequential incubation). Lastly, it is possible to adjust the potential applied by the potentiometer (between −0.1 and −0.4 V).

2.8. Optimization of Honey Extraction

Once the method had been optimized in terms of the buffer, different extraction protocols from the literature were tested.
  • Dilution in water or buffer,
  • Extraction with acetonitrile and reconstitution in ultrapure water,
  • Dilution in buffer, then extraction with ethyl acetate and reconstitution in buffer,
  • Dilution in deionized water, then extraction with ethyl acetate to be repeated 3 times and reconstitution in buffer,
  • Dilution in buffer (PBS), then extraction with ethyl acetate repeated 3 times and reconstitution in buffer.

2.9. Data Analysis

The intensity of the current was measured. For each day of analysis, the mean, standard deviation (SD) and coefficient of variation (CV%) were calculated for a set of identical samples (blank or spiked samples). Then, a statistical approach which took into account the β error of 5% was chosen as it was recommended in the European guidelines for the validation of screening methods for veterinary drug residues [26].
The positivity threshold T (Equation (1)) and the cut-off value Fm (Equation (2)) were calculated.
T = B − 1.64 × SDB
where B is the mean and SDB is the standard deviation of the signal (Relative Luminescence Unit (RLU)) of the blank samples.
Fm = M + 1.64 × SD
where M is the mean and SD is the standard deviation of the signal (RLU) of the spiked samples.
The assay was considered valid only if T was higher than Fm.

3. Results

3.1. Measurements in Buffer before Optimization

A range of samples was prepared in PBS-T with four different concentrations of chloramphenicol in order to assess the potential of this method: blanks, 1 ng/mL, 10 ng/mL and 100 ng/mL, with three replicates per condition. The results presented in Figure 4 show that the spiked samples were clearly discriminated from the blank samples. Furthermore, the spiked samples can be differentiated from each other according to their concentration. Following these encouraging results, we decided to optimize the assay.

3.2. Optimization of Assay Conditions in Buffer

Some results of the optimization of some parameters are displayed as examples in Figure 5. The first tested parameter was the dilution of the antibody (Figure 5a), bearing in mind that it had already previously been diluted to 1/10. For this condition, we only used the blank samples in order to watch the signal fall. The optimal dilution was 1/10 in terms of the signal height (the greater the signal, the more sensitive the method); however, in order to reduce the experimental costs and because the signal from the blanks was sufficiently strong, a dilution to 1/50 was selected. For the other parameters, the measured current obtained after the analyses of blank samples (orange) and samples spiked to 10 ng/mL (green) were compared. The second tested parameter was the quantity of magnetic beads per tube. The more beads there are, the more antibodies can be immobilized, thereby increasing the signal. When the quantity of beads is lowered, the signal would decrease, but also the beads can be saturated with antibodies without overspending. Generally, a range from 1 to 10 µL of beads per tube is tested. The graph shows an optimal quantity between 3 and 4 µL (Figure 5b); the optimization continued with 3 µL of beads per tube for economic reasons.
The incubation time needed for the antibodies to be grafted onto the magnetic beads is a crucial parameter for optimal binding. The tested times were 10, 20, 30 and 60 min (Figure 5c). The time selected was a compromise between the sensitivity and rapidity of the assay. The selected optimal time was 30 min because it seemed sufficient to obtain discrimination in signal between blank and spiked milk samples.
CAP–HRP was previously diluted to 1/10. The graph presented in Figure 5d shows that the optimal dilution was 1/50. When the conjugate concentration was increased, the signal produced was maximized because all the free antibody paratopes were occupied. However, the competition with CAP could be too strong. Thus, a dilution to 1/100 was selected because the current obtained was sufficiently high and the cost of analysis was reduced.
Two types of incubation were tested:
  • a single incubation, i.e., the antibodies bound to beads were in contact with both CAP and CAP–HRP,
  • a sequential incubation, i.e., the antibodies bound to beads were initially put in the presence of CAP alone, and then halfway through the planned incubation time, the CAP–HRP conjugate was added. Thus, the antibodies had time to bind with CAP before any competition with the conjugate took place. It was hypothesized that the difference in signal between the blank samples (conjugate alone) and the spiked ones (conjugate and CAP) may increase.
Two incubation times (30 and 60 min), according to two incubation methods (simultaneous and sequential), were tested. The results seemed equivalent (data not shown). However, when looking at the curves, the results were highly variable for the 10 and 20 min timepoints. The selected incubation method was the simultaneous method, for an incubation time of 30 min.
We subsequently observed the effects of different concentrations of hydroquinone and H2O2. It was observed that the higher the concentration of hydroquinone, the smaller the signal difference between the blank and spiked samples (data not shown). We assumed that if the concentration of hydroquinone was increased without increasing that of H2O2, the signal difference between the blank and spiked samples would also have been smaller. Therefore, the highest concentration of hydroquinone (5 mM) was selected. Then, increasing concentrations of H2O2 were tested. The results presented in Figure 5e clearly show that a higher concentration of H2O2 yields stronger signals, while retaining a noticeable difference between the blank and spiked samples. We also compared two combinations of hydroquinone/H2O2 (5 mM/500 mM and 1 mM/H2O2 1 M) (data not shown). As the difference in signal was even greater, we therefore decided to continue with this last combination (1 mM/H2O2 1 M).
Lastly, the potential applied by the potentiometer was adjusted to between −0.1 and −0.4 V. The applied potential, −0.2 V, obtained the best signals and the best discrimination between the blank and spiked milks (Figure 5f).
These different experiments enabled us to determine the optimal conditions for detecting samples of milk spiked with chloramphenicol to 10 ng/mL:
  • 3 µL of beads per tube,
  • Antibodies diluted to 1/50 and incubated for 30 min,
  • CAP–HRP diluted to 1/100 and incubated for 30 min with the sample (i.e., simultaneous method),
  • Hydroquinone concentration of 1 mM and H2O2 of 1 M,
  • Applied potential of −0.2 V.

3.3. Optimization of Honey Extraction

3.3.1. Honey Dilution

We first diluted one sample of acacia honey in ultrapure water at 1/4, 1/5 and 1/10. Firstly, there was a decrease in the signal with increased concentrations of CAP, which was satisfactory (Figure 6). The current produced by the analysis of blank and spiked samples was higher when the sample was the more diluted (1/10), but the sensitivity was decreased. However, we observed a high variability in the measured current (around 20%), taking into account that it is a single acacia honey sample that was analyzed several times. When there was no error bars, the sample was analyzed only once. The threshold value T was calculated for a 1/5 dilution 15 at 822 nA and the cut-off Fm at 903 nA because of the variability. The assay failed because T is lower than Fm value. Regarding the high standard deviations at 3 ng/g, we assumed that the detection capability of the method would not be low enough to detect CAP below 0.3 ng/g.

3.3.2. Measurement of pH of Diluted Honey

It was assumed that the pH of honey could influence the capability of detection of the amperometric biosensor. Indeed, the honey samples are known to be all acidic and nectar honeys generally have a pH of between 3.5 and 4.5. Therefore, the pH of the honey samples from different botanical origins was determined after the dilution of honey samples at 1/10 in different solutions (water, PBS pH 7.5, PBS-T pH 7.5 and phosphate buffer pH 6.0) (Figure 7).
Figure 8 shows that dilution in ultrapure water led to different pH values between 4.0 and 5.0, depending on the botanical origin of the honey samples. Water did not have a buffering effect. On the contrary, the three buffers performed well their buffering function. The pH was between 6.5 to 7.0 for PBS and PBS-T, and between 5.5 to 6.0 for phosphate buffer. These results suggested that the pH of honey is not responsible for the high variability of the results because of the buffering effect after dilution in buffers.
Then, a dilution of the acacia honey sample was tested at 1/10 in 0.1 M PBS pH 7.0 by stirring for 20 min. The T value (4499) was lower than the Fm value calculated at 1 ng/g (4395) (failed), but higher than Fm at 3 ng/g (4303). However, this last concentration is ten times higher than the target concentration (MRPL = 0.3 ng/g). Therefore, the method was not sensitive enough. The dilution was abandoned to test the extraction protocols, as performed by classical analytical methods (e.g., ELISA, LC-MS/MS).

3.3.3. Honey Extraction

Extraction with Acetonitrile and Reconstitution in Ultrapure Water

One gram of acacia honey sample was treated with 3 mL of acetonitrile. The mixture was vortexed for 2 min and sonicated for 30 min, then centrifuged at 5000 rpm for 7 min. The supernatant was collected in a glass tube and was then evaporated to dryness at 50 °C under nitrogen stream. The obtained extracts were reconstituted with 200 µL of ultrapure water.
The T value (2495) (four repetitions) was higher than the Fm value calculated at 1 ng/g (1807) (three repetitions), and obviously higher than Fm at 3 ng/g (1296) (three repetitions). Therefore, this assay was very satisfactory and promising.
Then, the protocol was only modified by adding a heating step at 40 °C for 15 min before adding 3.0 mL of acetonitrile. Finally, the extracts were reconstituted in ultrapure water, in PBS-T or in phosphate buffer. The analysis of the acacia honey samples in the different conditions was repeated two to three times. The Fm value was calculated from the results of samples spiked with CAP to 1 ng/g (Table 2). After the reconstitution in water, the results were not satisfactory (T > Fm), while reconstitution in PBS-T and phosphate buffer gave satisfactory results at 1 ng/g.

Ethyl Acetate Extraction

After heating 1.0 g of acacia honey sample at 40 °C for 15 min, honey samples were treated with 3 mL of ethyl acetate. The mixture was vortexed for 2 min and sonicated for 30 min, then centrifuged at 5000 rpm for 7 min. The supernatant was collected in a glass tube and then was evaporated to dryness at 50 °C under nitrogen stream. The obtained extracts were reconstituted with 120 µL of PBS-T. The same day, the extraction in acetonitrile was also performed to compare both protocols. Honey samples were spiked to 0.5 and 1 ng/g. The results in acetonitrile were less satisfactory than the previous day, even if the assay was valid at 1 ng/g. However, the assay in acetonitrile failed at 0.5 ng/g (Table 3). The assay in ethyl acetate was valid at both CAP concentrations. To improve the sensitivity of the assay, the volume of solvent was increased from 3 mL to 7 mL. We could observe that the detection capability was better with 7 mL than with 3 mL for both acetonitrile and ethyl acetate extractions. The results were more repeatable with ethyl acetate. Therefore, we decided to continue with this solvent.
Then, to improve the sensitivity of the assay, the weight of acacia honey was increased from 1.0 g to 2.0 g. The extraction was performed with 3 mL and 7 mL of ethyl acetate for comparison. Honey samples were spiked to 0.3 and 0.5 ng/g. The assay was repeated twice (two different days). The results were globally better with 7 mL of ethyl acetate, except the first day at 0.3 ng/g of CAP. This unsatisfactory result was due to high variability of the three replicates at this concentration (23.4%) (Table 4).
The day after, five aliquots of 2.0 g of the same acacia honey sample were prepared and five aliquots of the same honey were spiked with CAP at 0.3 ng/g. The 10 samples were extracted as described previously with 7 mL of ethyl acetate and reconstituted in 120 µL of PBS-T. The threshold value T was equal to 2807 and the cut-off factor Fm to 1904; therefore, the assay was valid. The method was able to detect CAP at 0.3 ng/g in one sample of acacia honey.
Regarding these promising results, the same extraction protocol was applied to eight different honey samples from different botanical origins, with different colors and textures (i.e., acacia (two samples), chestnut, lavender, mountain, spring, lime tree, multifloral) (Table 5). The results were clearly different when honey samples from different botanical origins were analyzed (Figure 8). When calculating the threshold value T and the Fm value, the assay was not valid because T (1902) was lower than Fm (2905). This conclusion was logical because the coefficient of variation (CV) calculated on blank samples was 30% and 48% on spiked samples from different botanical origins. On the other hand, when only acacia samples were analyzed, the CV on blank samples was equal to 16% and 7% on spiked samples. However, when looking at individual results for each honey sample, the discrimination between the signals (current (nA)) from the blank honey and the same sample spiked with CAP to 0.3 ng/g is clear. It was highlighted here than even with an extraction procedure in ethyl acetate, the honey matrix effect was always strong, impeding and preventing a global analysis of honey from different botanical origins.

Dilution in Ultrapure Water and Ethyl Acetate Extraction

To solve the issue with botanical origins, a new extraction protocol was tested, inspired by an internal procedure for the screening and confirmation of CAP by LC-MS/MS. One milliliter of ultrapure water was added to 2.0 g of a honey sample, which was then vortexed and kept in contact for 10 min. Samples were treated with 6 mL of ethyl acetate. The mixture was vortexed for 2 min and stirred with rotary agitator for 10 min, then centrifuged at 5000 rpm for 5 min. The supernatant (5 mL) was collected in a glass tube and then was evaporated to dryness at 50 °C under nitrogen stream. The obtained extracts were reconstituted firstly with 0.6 mL of iso-octane, vortexed, and then 0.6 mL of water was added. The reconstituted extracts were gently mixed manually and centrifuged for 5 min at 50,000 rpm. Finally, 50 µL of the lower phase was taken. This extraction procedure was not satisfactory at all. There was no discrimination between blank and spiked samples, even if each sample was taken individually (data not shown).

Dilution in PBS and Ethyl Acetate Extraction

The extraction protocol develop by Yan et al. [27] was tested with slight modifications to solve this issue. Blank honey samples from different botanical origins (i.e., acacia, chestnut, forest, mountain, spring, lime tree) and the same samples spiked with CAP to 0.3 ng/g were analyzed over two days: 1 g of honey was mixed with 3 mL of PBS. Then, 4 mL of ethyl acetate was added and the samples were vortexed and centrifuged for 10 min at 4000 rpm. The supernatant was transferred to another tube. To enhance the extract efficiency, the extracting step for CAP was repeated three times. The collected supernatant was dried under nitrogen flow and then resuspended in 0.5 mL of phosphate buffer the first day and 1 mL of PBS the second day. In both cases, the threshold value T was lower than the cut-off Fm (data not shown). Therefore, the assays were not valid. When looking at the results for individual honeys, there was a discrimination between blank and spiked samples, except for mountain honey (Table 6).

Dilution in Water and Ethyl Acetate Extraction

A new protocol was tested, inspired by Xiao et al. [28]. One gram of honey was added into 3 mL of deionized water and vortexed for 5 min. The mixture was centrifuged at 4000 rpm for 10 min and the supernatant was extracted by 6 mL of ethyl acetate for three times. The collected supernatant was evaporated and mixed with 1 mL PBS (pH 7.5) by vortexing, and then filtered by a 0.22 μm membrane filter. The final extract was diluted 10-fold in PBS (pH 7.5). The threshold value T was lower than the cut-off Fm (data not shown). Therefore, the assays were not valid. When looking at the individual honey results, blank and spiked samples could be discriminated (Table 7). The repetition of the extraction in ethyl acetate three times was not adequate. Therefore, a similar protocol with water and ethyl acetate was tested, but with no repetition. One gram of honey was added to 4 mL of deionized water and vortexed for 10 min. Six milliliters of ethyl acetate was added to the mixture, which was then sonicated for 10 min. The mixture was centrifuged at 4000 rpm for 10 min and 3 mL of the upper phase was evaporated and mixed with 1 mL PBS (pH 7.5) by vortexing. Then, 1 mL of hexane was added to the reconstituted extract. This mixture was vortexed for 2 min and centrifuged at 4000 rpm for 10 min. The lower phase was used for the assay. Again, the threshold value T was lower than the cut-off Fm (data not shown). Therefore, the assays were not valid. Regarding individual results, the discrimination between individual blank and spiked samples failed for lavender and lime tree honey (Table 7).

PVPP and Ethyl Acetate Extraction

After testing many classical protocols for the extraction of CAP from honey, none were satisfactory for the analyses of honey samples from different botanical origins. It was assumed that the high variability of the current measures came from antioxidant substances naturally occurring in honey (e.g., polyphenols) that interfered with the detection of CAP. These substances were probably extracted in the same conditions as CAP and therefore perturbed the redox reaction that had to be measured. To remove this matrix effect, the use of poly(vinylpolypyrrolidoe) (PVPP) was tested. PVPP is a crosslinked homopolymer that binds with phenolic compounds by hydrogen bonding. PVPP can be used for the removal of phenolics and alkaloids from plant samples. PVPP is also used in wine to absorb some of the phenolic compounds and to eliminate some of the astringent tannins and molecules responsible for bitterness. The doses for using PVPP in wine vary from 10 to 30 g/hL to 20 to 50 g/hL.
Two different concentrations of PVPP (0.2 ng/g and 0.8 ng/g of honey) were tested by adding 1 mL and 4 mL of a solution of 20% PVPP in 1 g of honey. The samples and PVPP were kept in contact for 10 to 20 min at room temperature with continuous agitation. Then, the mixture was centrifuged at 10,000 rpm for 5 min. The supernatant was filtered onto Whatman paper. Then, the filtered supernatant was extracted with 7 mL of ethyl acetate. The mixture was vortexed for 2 min and sonicated for 30 min, then centrifuged at 5000 rpm for 7 min. The supernatant was collected in a glass tube and then was evaporated to dryness at 50 °C under nitrogen stream. The obtained extracts were reconstituted with 120 µL of PBS-T.
With 0.2 ng/g of PVPP, the T value was equal to 1422 and the Fm value to 2374. With 0.8 ng/g of PVPP, the T value was equal to 1582 and the Fm value to 1788. In both cases, T was lower than Fm, but the results seemed better when PVPP was added at the highest concentration (0.8 ng/g). When looking at the results for individual honey samples, all the blank samples were discriminated from the samples spiked with CAP to 0.3 ng/g (Table 8). The difference in percentage between the signal of the blank and spiked samples was higher for sunflower and scrubland honey samples when PVPP was used at 0.8 ng/g, and the results were similar for the other honey samples in both conditions.

Preliminary Test with modified Multi-Walled Carbon NanoTubes—Screen Printed Carbon Electrodes (MWCNT-SPCE)

After heating 2.0 g of acacia honey sample at 40 °C for 15 min, honey samples were treated with 7 mL of ethyl acetate. The mixture was vortexed for 2 min and sonicated for 30 min, then centrifuged at 5000 rpm for 7 min. The supernatant was collected in a glass tube and then was evaporated to dryness at 50 °C under nitrogen stream. The obtained extracts were reconstituted with 120 µL of PBS-T. The threshold value T (1182) was lower than Fm (2719); therefore, the assay was not valid. When looking at the results for individual honey samples, all the blank samples were discriminated from the samples spiked with CAP to 0.3 ng/g, except mountain and forest honeys (Table 9). When we compared the difference in percentage between the signal of the blank and spiked samples obtained previously with non-modified SPCE with the results obtained with these modified MWCNT-SPCE, the results were better with non-modified SPCE.
We finally tested the PVPP treatment and ethyl acetate extraction of honey samples from different botanical origins, followed by analysis with MWCNT-SPCE. The results were not satisfactory (T = 1287 > Fm = 2682). Even individual results for honey samples were less satisfactory than the previous test with PVPP and non-modified SPCE. Therefore, it seemed that MWCNT electrodes were not able to improve the detection capability of the assay in our study. To check if matrix effects are responsible for this issue, some tests should be performed without matrices to compare the results with non-modified and MWCNT-SPCE.

4. Discussion

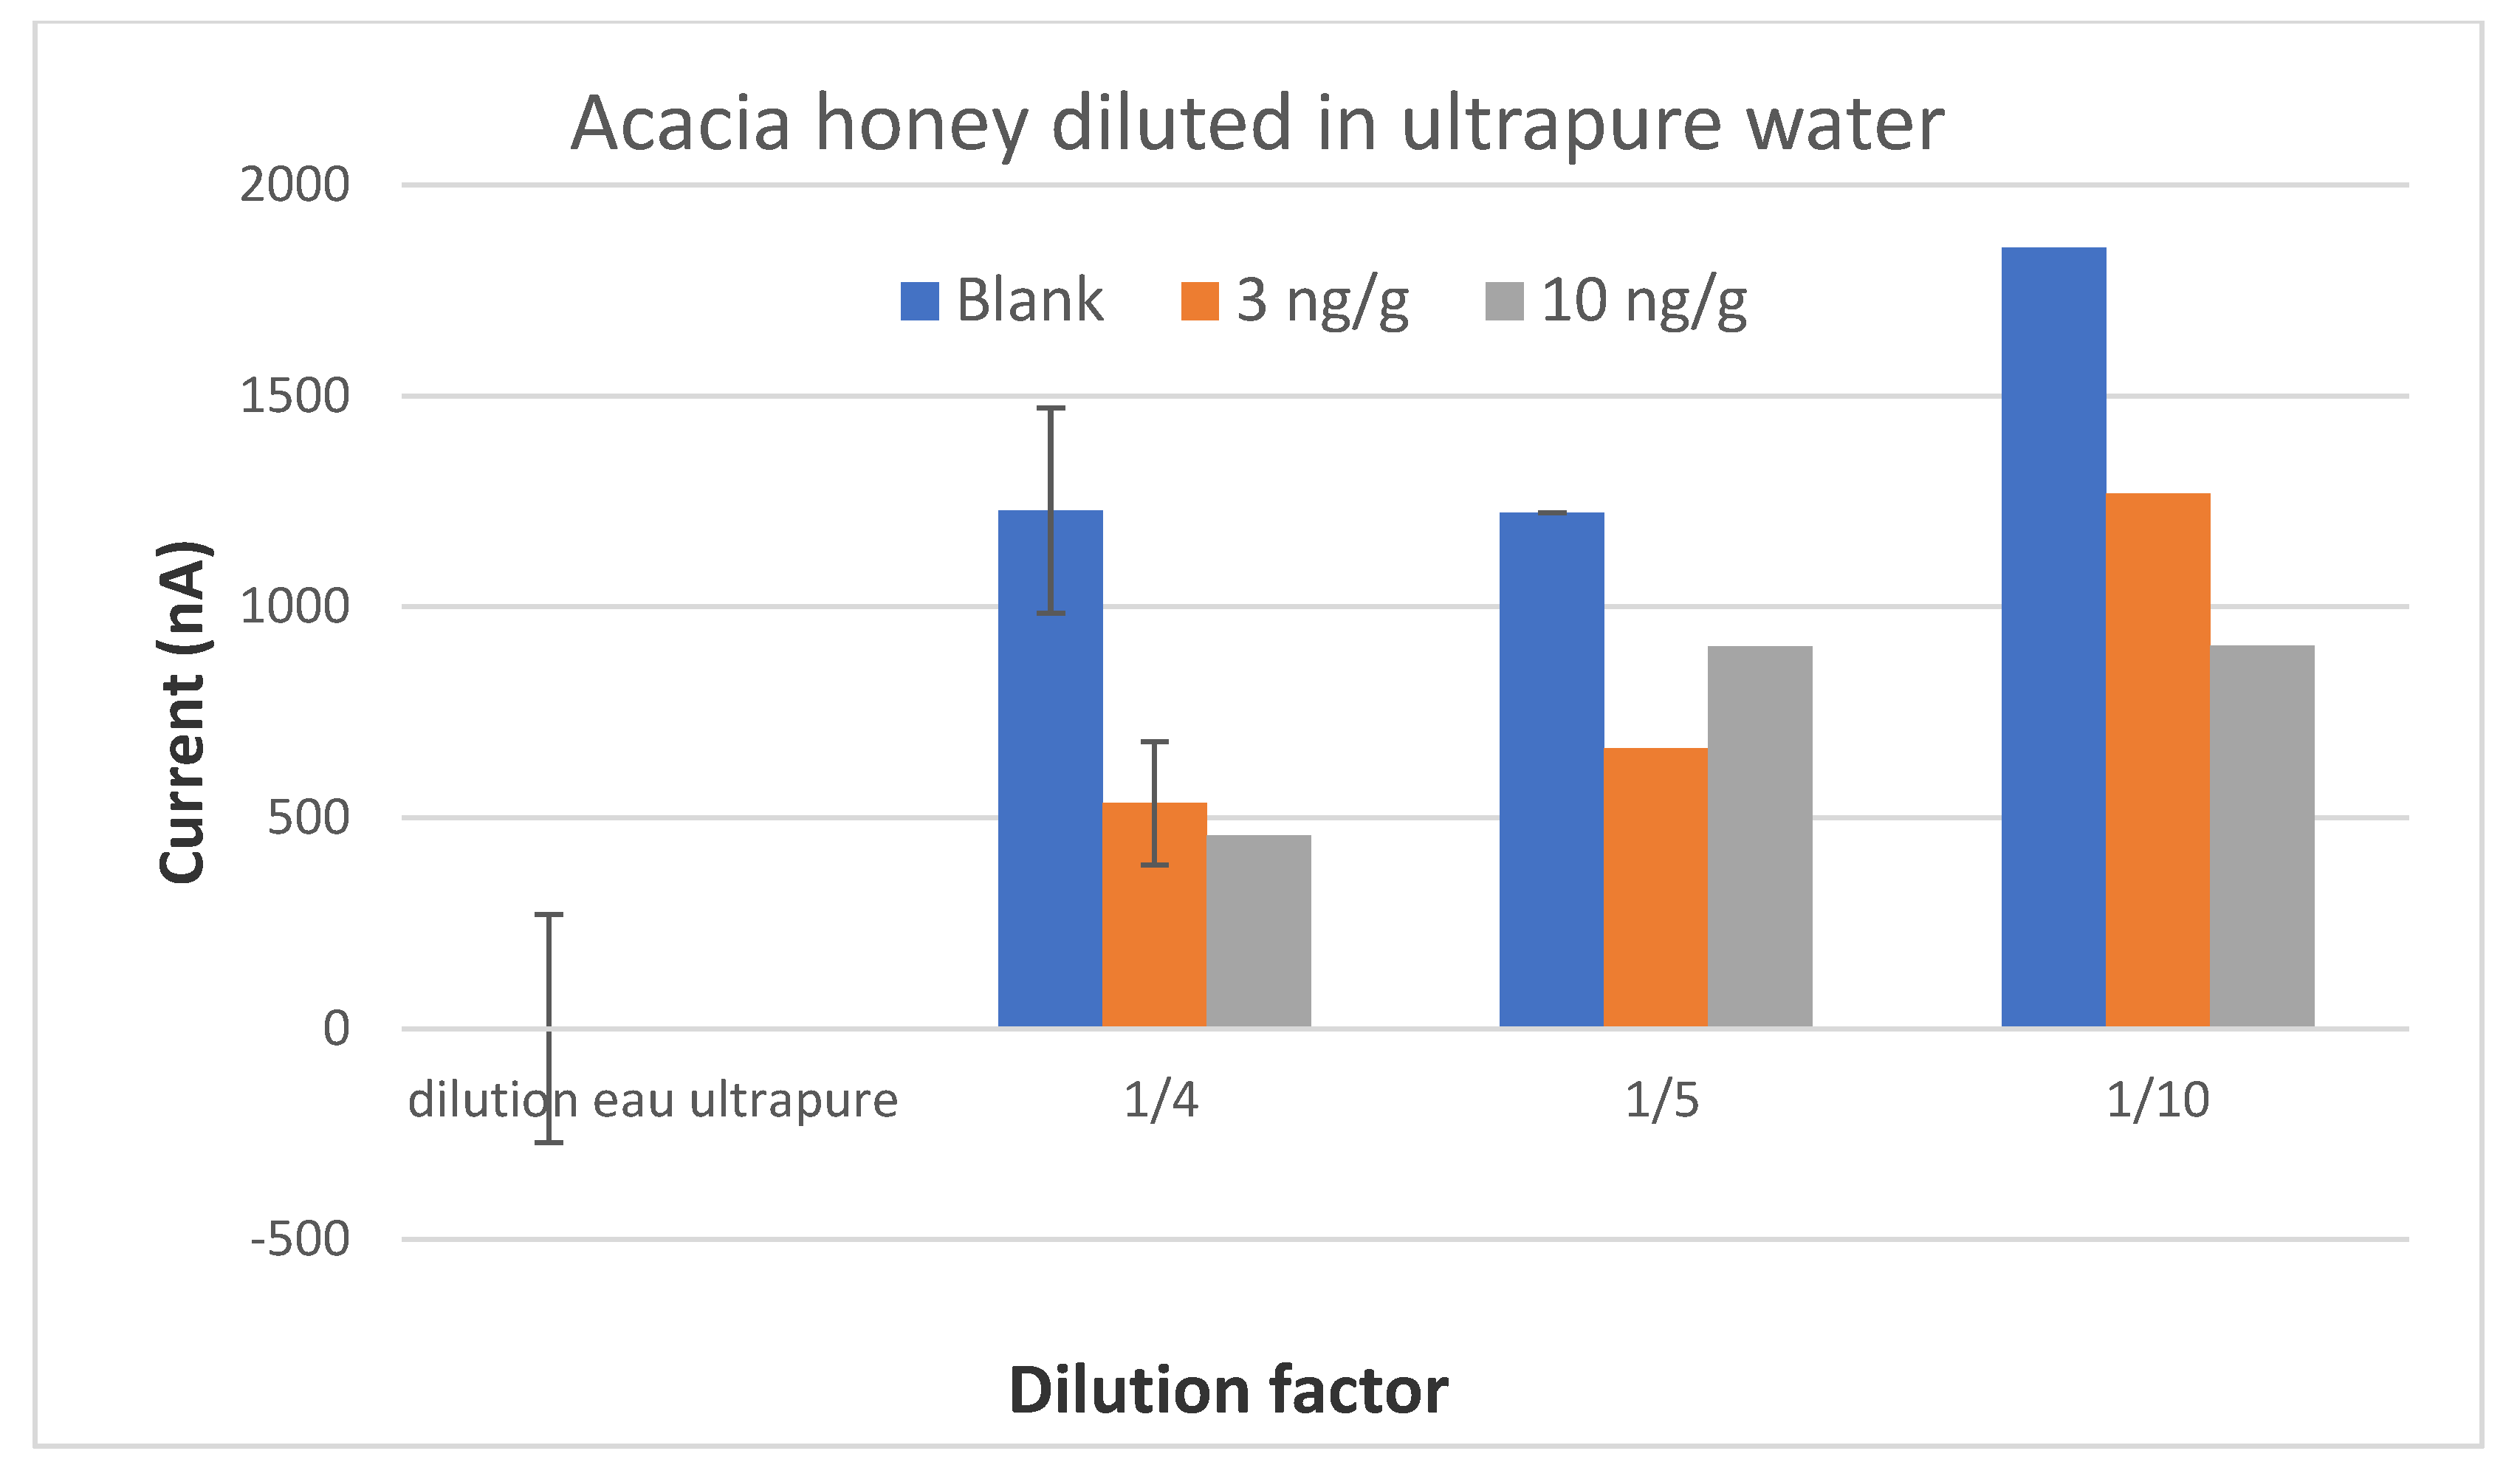
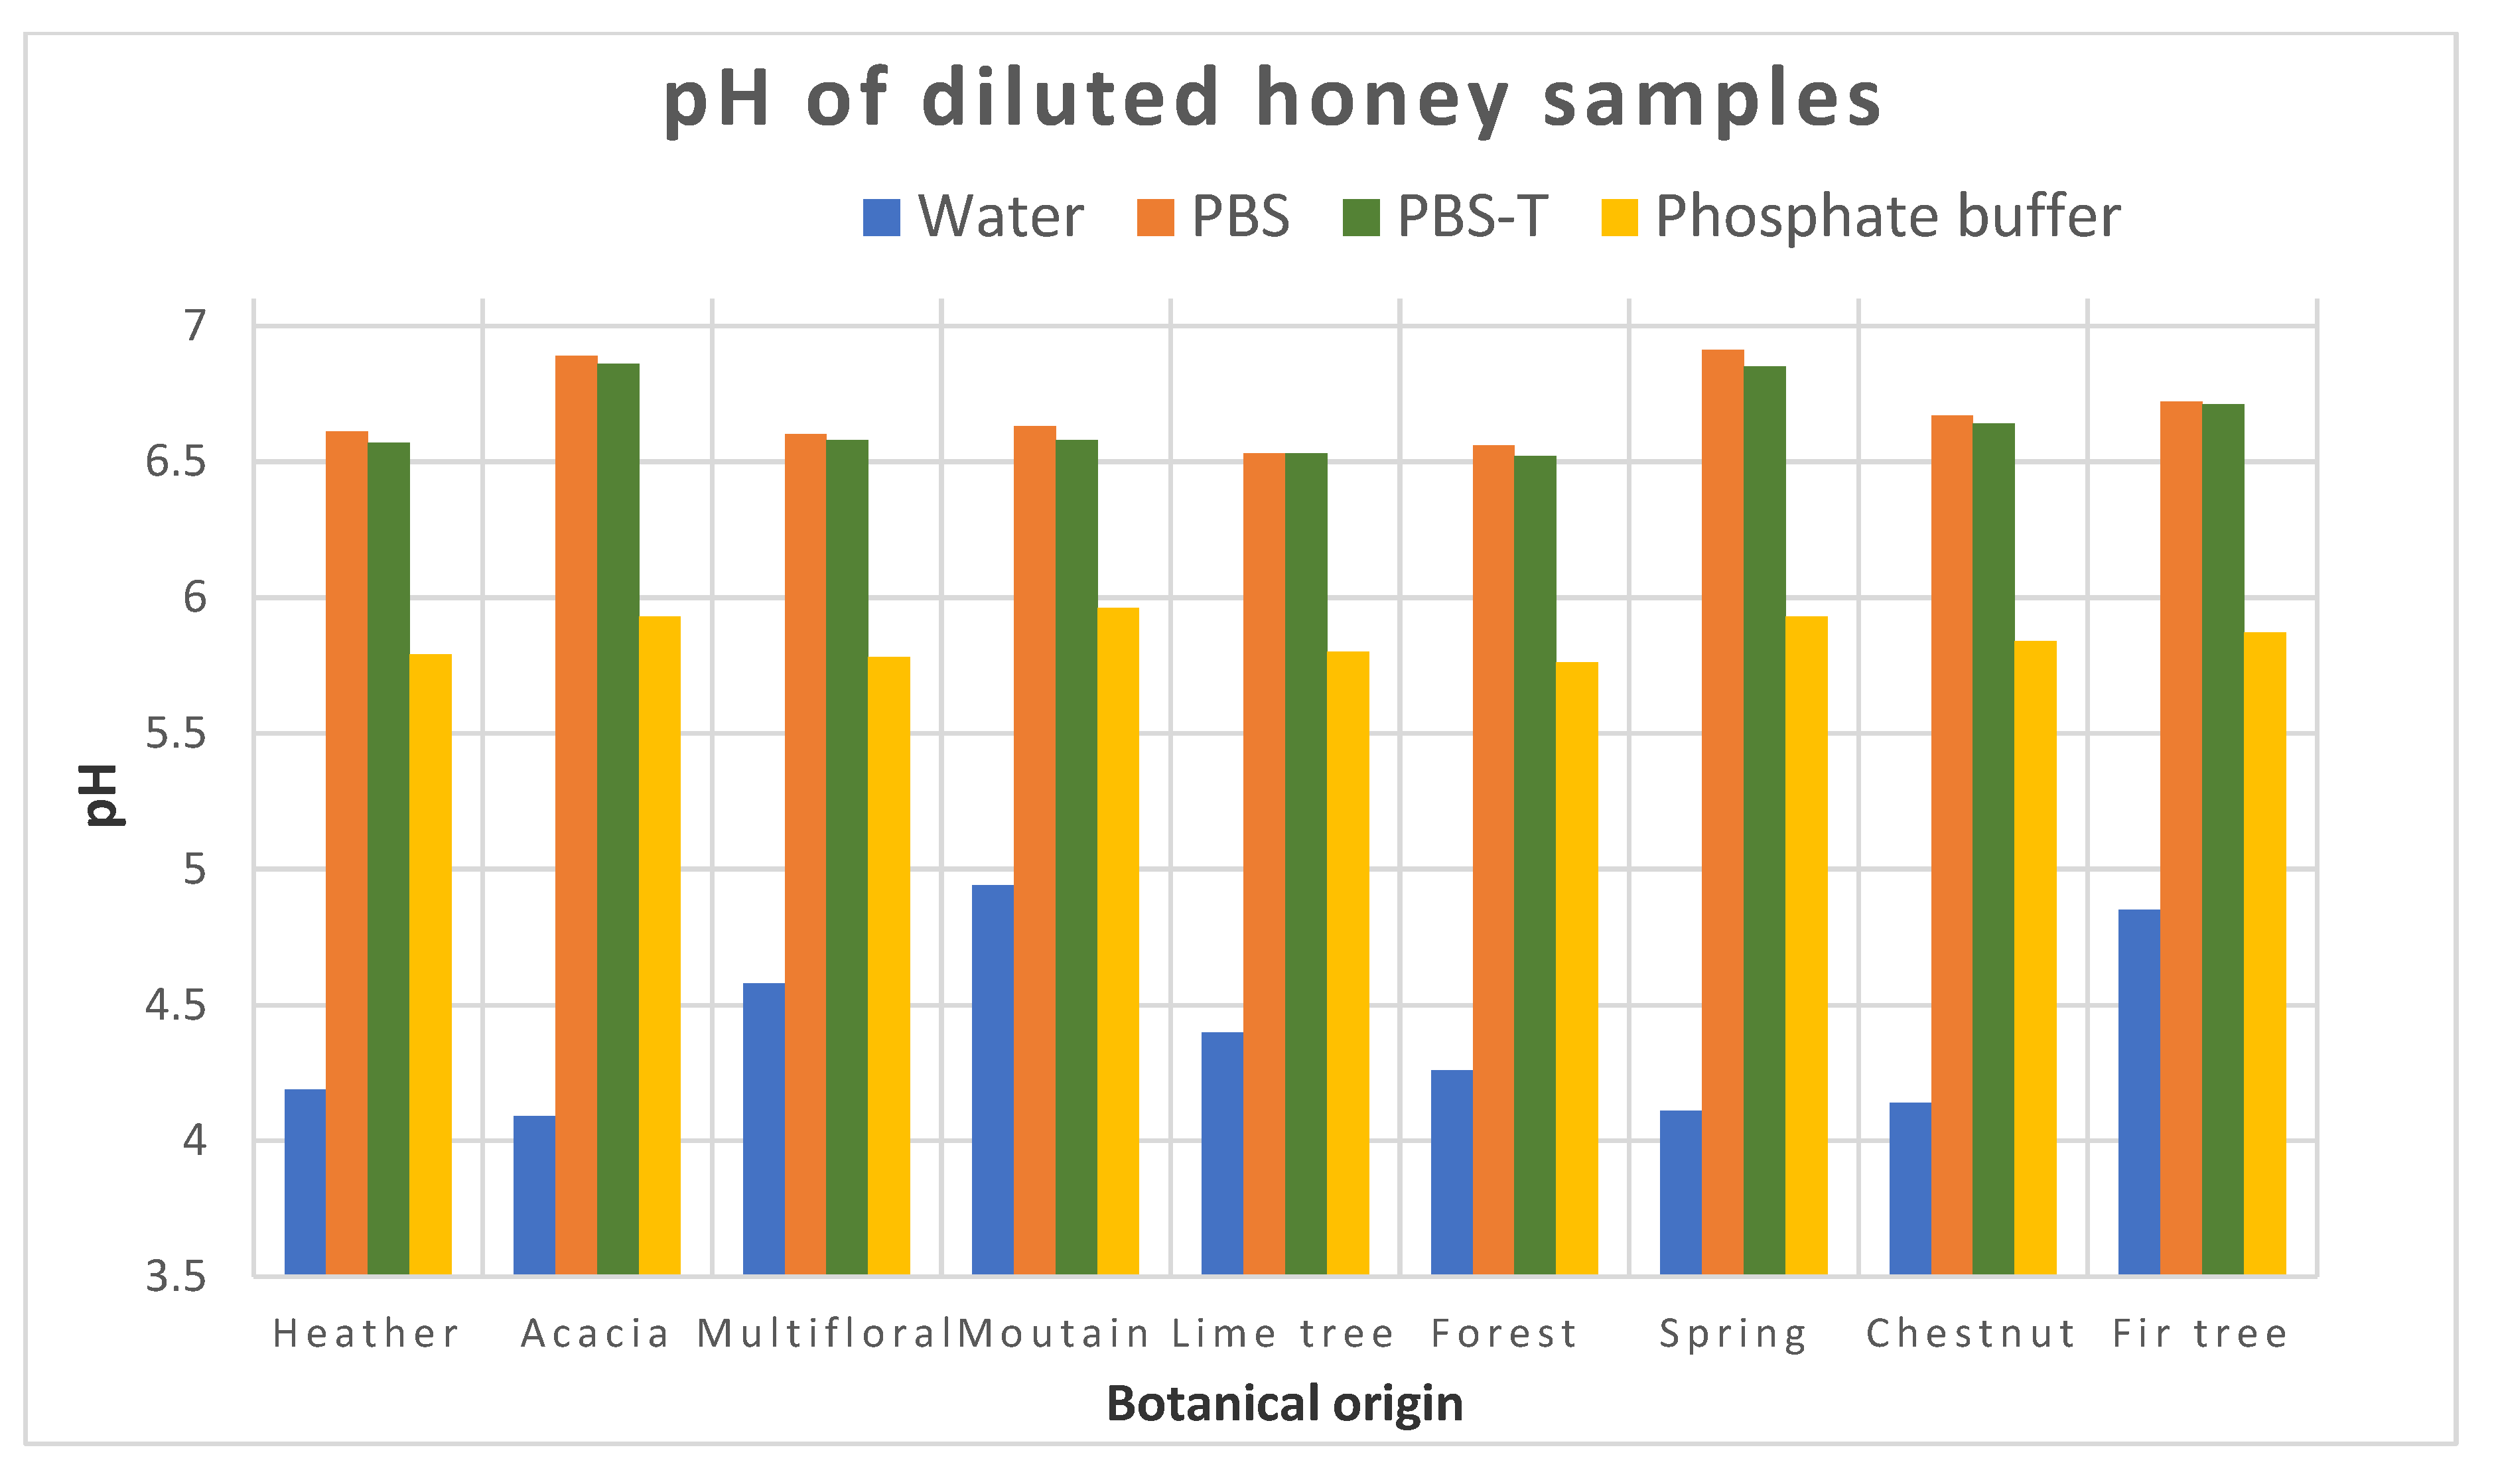
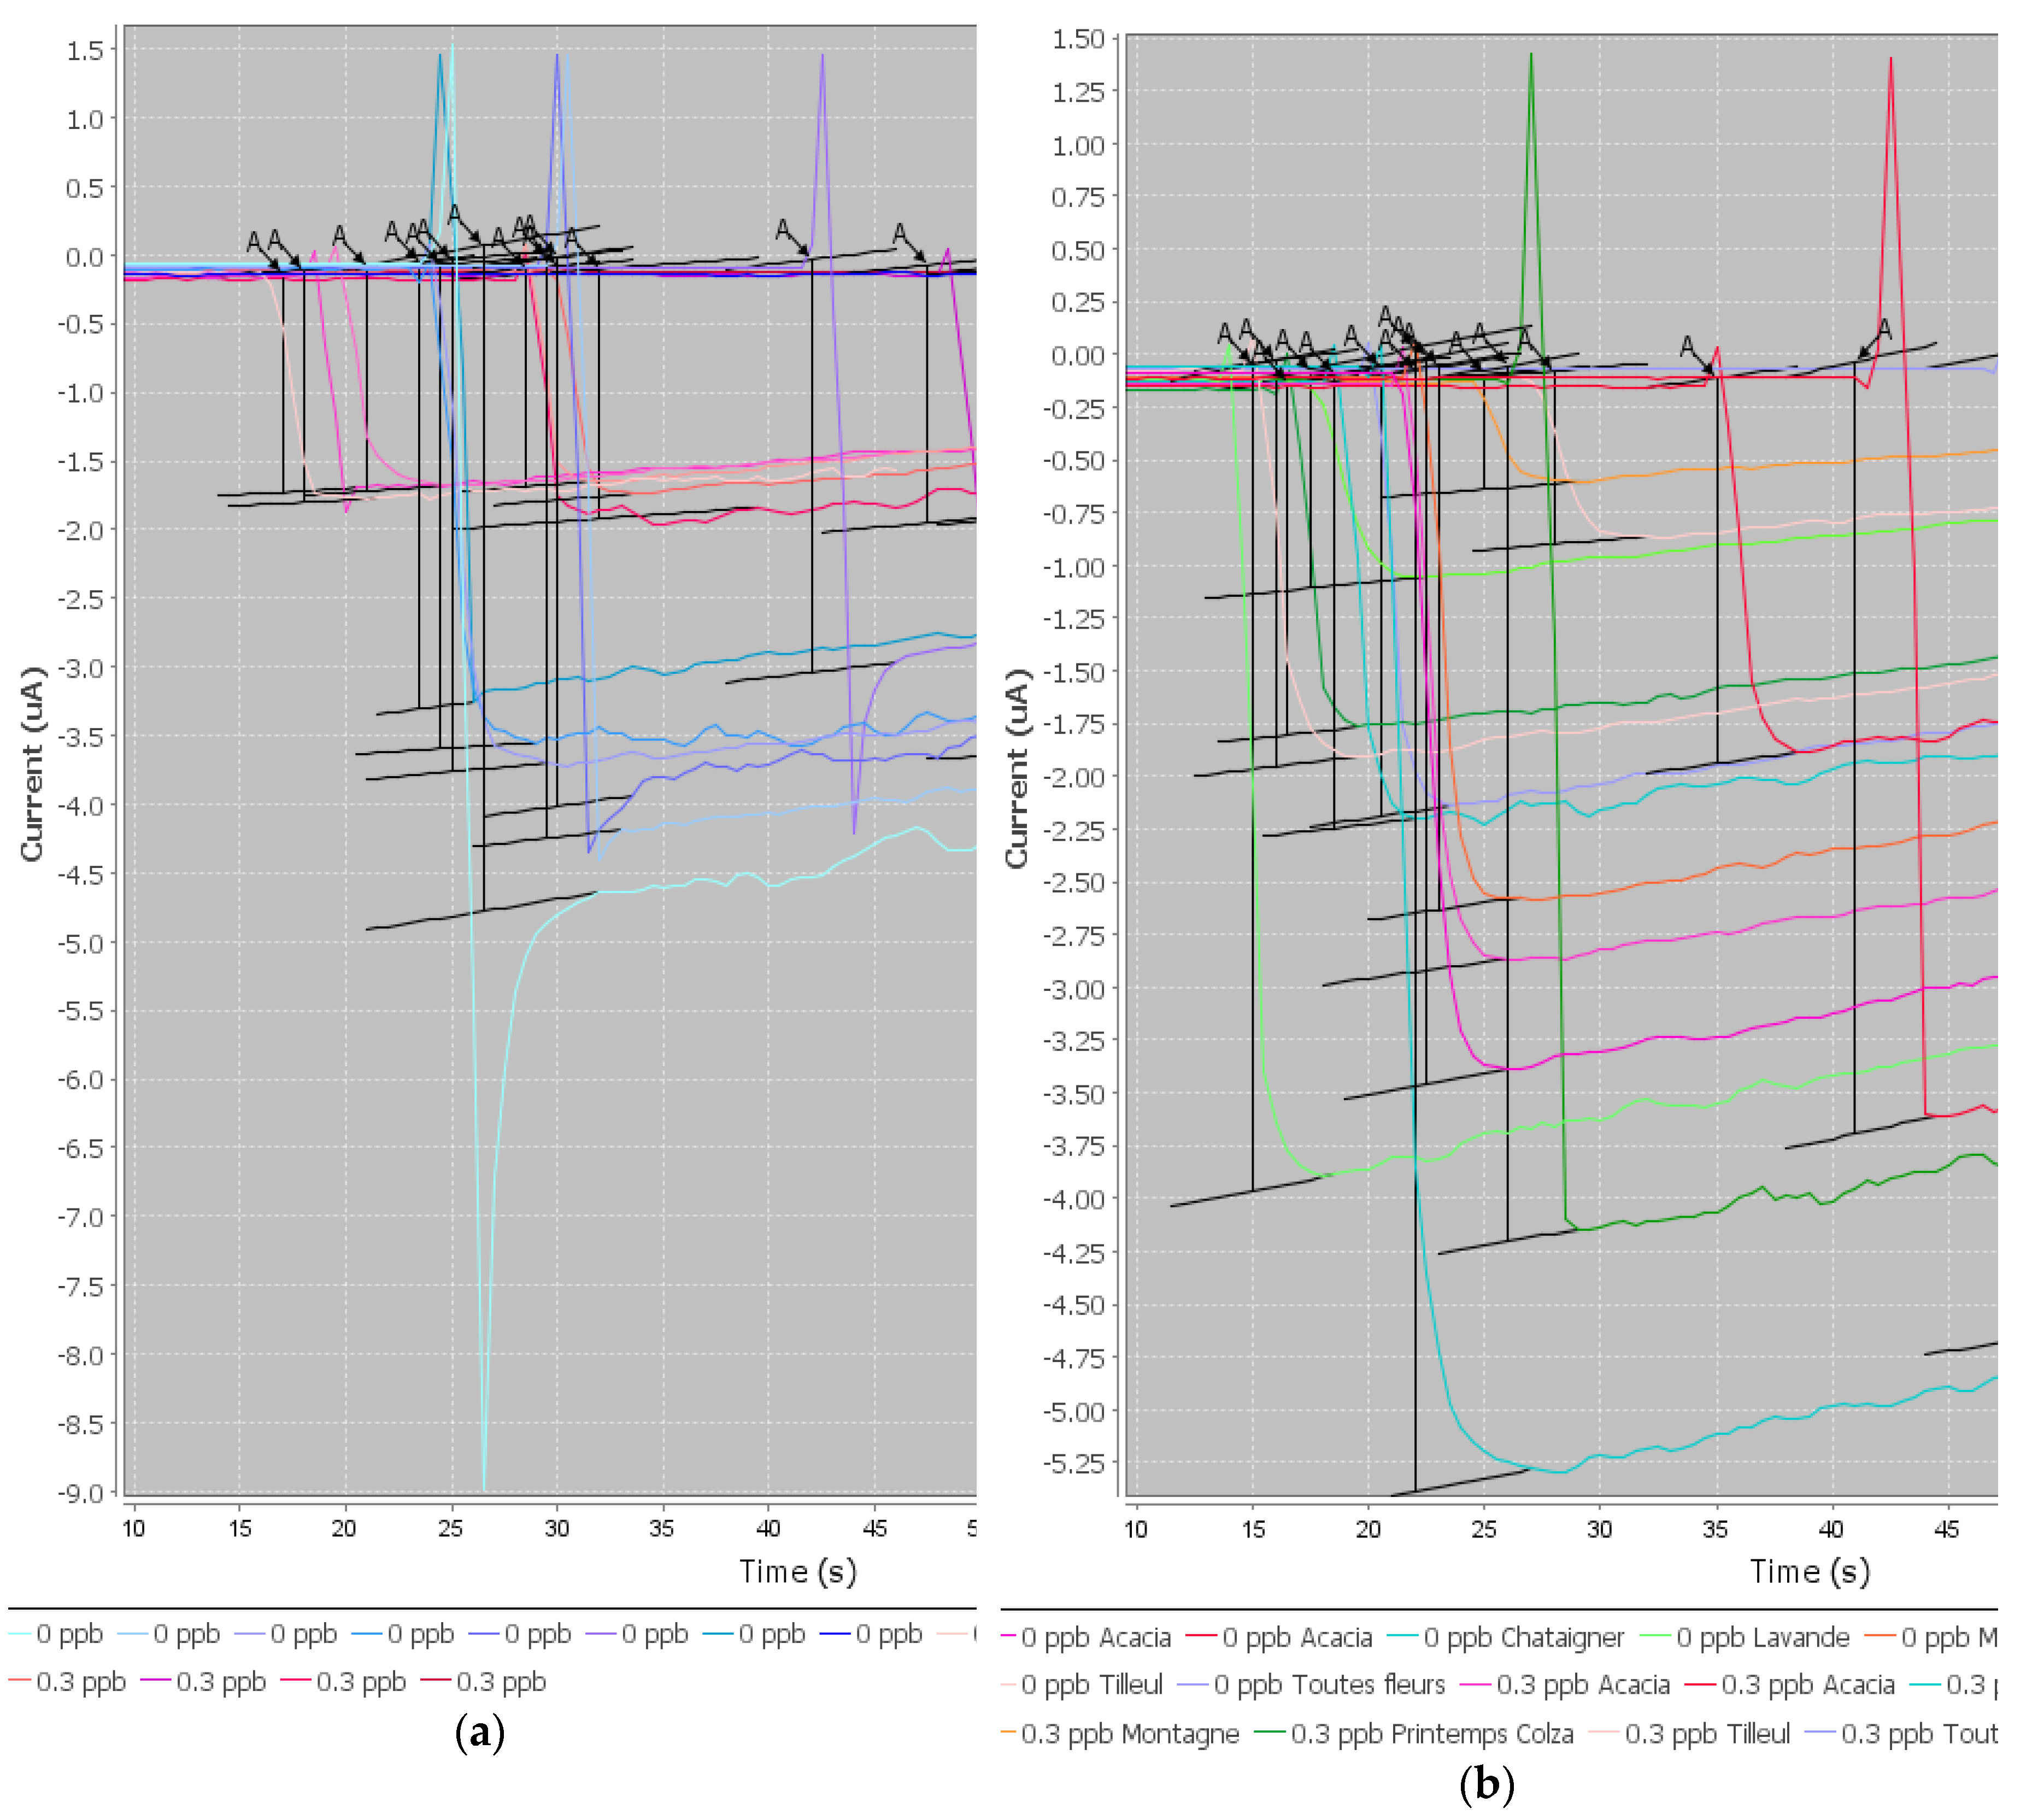
The preliminary results of this project were satisfactory because we were able to develop a screening test able to detect CAP at or below 0.3 ng/g in one honey sample. When individual honeys were analyzed, the method was able to discriminate blank samples from samples spiked with CAP to 0.3 ng/g. Therefore, this objective is fulfilled. However, as soon as the mean signals from honeys of different botanical origins were considered, it was no longer possible to discriminate blank samples and spiked samples because the variability in the signal due to each honey was too high.
After an exhaustive literature study, several extraction protocols for CAP in honey were selected and tested. A simple dilution of honey in buffer would have been an ideal sample preparation. However, the results were not satisfactory when honeys from different botanical origins were tested. The extraction of CAP in ethyl acetate is actually a very usual procedure before analysis with ELISA kits or physico-chemical methods. We have tested different protocols with ethyl acetate and also some protocols with acetonitrile. It was not satisfactory as the matrix effect was not removed.
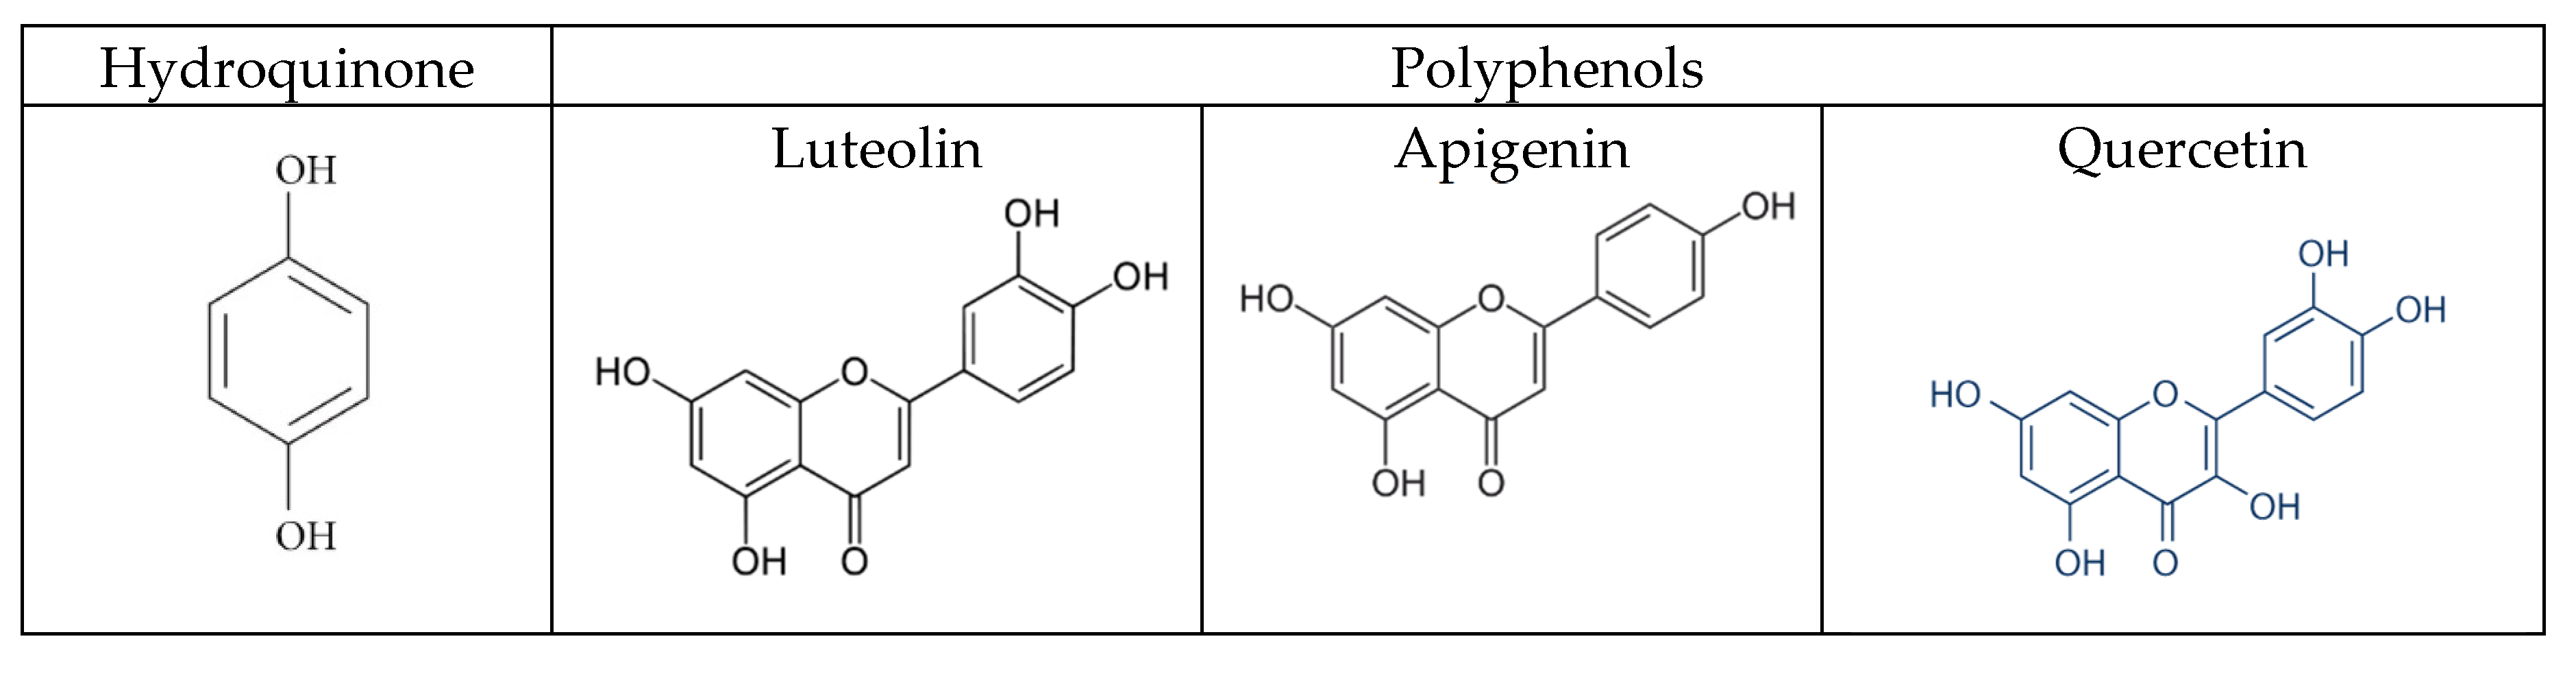
It was hypothesized that some components interfered with the electrochemical detection. Honey is a very complex matrix of many molecules such as sugars, proteins, vitamins, minerals, polyphenols, organic acids, and lipids. The issue is that a number of these compounds are known to act as antioxidants (i.e., polyphenols (flavonoids and non-flavonoids), organic acids, vitamins (ascorbic acid), and enzymes (glucose oxidase and catalase)). Many of the honey flavonoids and phenolic acids are known to have antioxidant activity [29]. The amount and type of flavonoids vary depending on the flower source (i.e., botanical origin). Honeys from seven different floral sources were analyzed for in vitro antioxidant capacity and total phenolic content by Gheldhof et al. [30]. A correlation was observed between phenolic content, honey color and the antioxidant capacity of the investigated honeys. Honeys with a darker color have a higher total phenolic content and consequently a higher antioxidant capacity. Phenols are hydroxylated derivatives of benzene-like hydroquinone. Polyhydroxy derivatives are called polyphenols. The polyphenols present in honey are mainly flavonoids (quercetin, luteolin, apigenin), phenol acids and their derivatives. The darker the honey (like those from sunflower, buckwheat and honeydew), the richer they are in flavonoids. The structure of these flavonoids is very similar to those of hydroquinone (Figure 9). Furthermore, the oxidation of polyphenols produces quinones. The oxidation of polyphenols could prevent the oxidation of hydroquinone and therefore all the electrochemical reactions that have to be measured.
The difficulty arises with finding a solvent which could extract these substances without extracting CAP. The issue is that phenolic acids and flavonols are usually extracted from honey in ethyl acetate or ethanol, like CAP. Only sugars are removed by this extraction. This co-extraction could explain the strong matrix effect we have observed. Further studies to find a solvent that would extract CAP but not antioxidant components of honey, if possible, are needed. The solubility of flavonoids also depends on the pH [31]. Many natural flavonoids have extremely low solubility in aqueous media [32]. A combination of several solvents and the variation of pH for the extraction step should be tested.
One big challenge in the development of biosensors for the detection of analytes is working with biological matrices. This issue of interferences when handling biological samples has already been highlighted in several scientific publications [33]. The sensitivity of the biosensor could be highly decreased because of matrix compound interference. We faced the same issue. While everything goes well in a buffer or in aqueous solution (e.g., sensitivity, selectivity), the analysis of biological matrices is very complicated, especially when the matrix is as varied as honey. We assumed that some substances in the matrix (i.e., electroactive species) interfered with the electrochemical detection, as this has already been observed in previous works [34]. Most often, research articles on CAP biosensors are evaluated only in buffer or aqueous solution [35]. When the method is applied to biological matrices, only one or a few matrix samples are analyzed [36,37,38]. This study is only a proof of concept for the developed biosensor, but it is not a full evaluation of the actual performance of the method and of its routine applicability. A full validation requires the analysis of at least twenty samples from different origins (i.e., honeys from different botanical and geographical origins) for the determination of specificity and detection capabilities [2,26].
The objective of a screening method is to be able to detect CAP in any type of honey. In routine analyses, we carry out negative quality controls (QC) (blank samples) and positive QCs (samples spiked with CAP at the detection capability (or limit of detection)) daily. The analysis of these QC samples makes it possible to determine the daily T and Fm. Thus, we can conclude if the test of the day is indeed valid. Finally, the cut-off Fm is used to evaluate the positivity of the unknown samples analyzed on the same day. Therefore, at least two blank honey samples and two spiked honey samples from different botanical origins preferably have to be analyzed. However, if the signals are too different between botanical origins, this management of routine analyses will not be possible. Therefore, we must develop an analytical method, combining sample extraction and analysis on the biosensor, able of analyzing all types of honey simultaneously. Otherwise, two negative and two positive QCs would be necessary for each floral origin to be analyzed on the day of the test, which would be completely impractical.
If a common extraction protocol removing matrix effects is not available, we could consider in the future making groups within the variety of honeys. To form these groups, we would need more results to be able to find which types of honey could be integrated in each group. We assumed that the groups could be linked to the color of honey, or to its pH, for instance. This will require analyzing QCs from each group for the analysis of unknown samples based on the botanical origin of the samples to be analyzed.
In conclusion, SPCE are attractive for the development of biosensors for the detection of antimicrobial residues in foodstuffs because they are relatively affordable, disposable (no cleaning process, no memory effect), and can be portable (i.e., small, robust, simple, portable instrumentation) [33]. Magnetic beads are usually useful because they help to minimize the matrix effect (i.e., blocking of the binding sites on the electrode) due to the washing steps, but they also enable quicker analysis because they are in suspension. In addition, the sensitivity is improved, and the immuno-reaction step is separate from the electrochemical detection step. Unfortunately, regarding the complexity of the honey matrix and the great variety in its components, even the use of magnetic beads did not allow us to remove all matrix effects. For more than ten years, nanomaterials (NMs) and their outstanding characteristics have been widely used in the development of very sensitive electrochemical biosensors [39,40]. Nanomaterials improve the sensitivity of biosensors by increasing the surface area of the transduction zone. They can improve the electrical conductivity in the case of electrochemical biosensors and reduce the background noise associated with the samples analyzed (matrix effect). Unfortunately, it seemed that the tested modified SPCE did not give better results than the non-modified SPCE, and even gave worse results for some samples. Further tests in buffer should be conducted to verify if the problem was due to the strong matrix effect of the honey.
There are many perspectives to this work:
  • We will continue to develop more efficient extraction protocols that are able to remove or at least lower the strong matrix effect of honey.
  • The positive effect of PVPP on the reduction of the matrix effect will continue to be investigated, probably firstly by increasing its concentration.
  • We will compare different electrochemical modes of detection, such as amperometry and voltammetry (i.e., voltamperometry).
  • The use of nanomaterials could be explored to improve the performance characteristics of the electrode (i.e., modified SPCE).
  • An aptamer will be evaluated in replacement of the antibody to detect CAP. Aptamers are already easily found commercially because the sequence is known [41]; many articles are working with aptasensors for CAP [39,42].
  • After chloramphenicol, we will develop biosensors for other banned antimicrobials (i.e., nitrofuran metabolites) and finally develop a multiplex method for the simultaneous detection of these banned substances.

Funding

This research received no external funding.

Conflicts of Interest

The authors declare no conflict of interest.

References

  1. European Commission. Commission Regulation (EC) N° 470/2009 laying down Community procedures for the establishment of residue limits of pharmacologically active substances in foodstuffs of animal origin. Eur. Parliement Counc. 2009, L152, 11–22. [Google Scholar]
  2. European Commission. Commission Decision (EC) N° 2002/657 of 12 August 2002 implementing Council Directive 96/23/EC concerning the performance of analytical methods and interpretation of results. Off. J. Eur. Communities 2002, L221, 8–36. [Google Scholar]
  3. European Commission. Council directive 96/23/EC of 29 April 1996 on measures to monitor certain substances and residues thereof in live animals and animal products and repealing Directives 85/358/EEC and 86/469/EEC and Decisions 89/187/EEC and 91/664/EEC. Off. J. Eur. Communities 1996, L125, 10–32. [Google Scholar]
  4. European Commission. Regulation (EU) 2017/625 of the European Parliament and of the Council of 15 March 2017 on official controls and other official activities performed to ensure the application of food and feed law, rules on animal health and welfare, plant health and plant protection products. Off. J. Eur. Union 2017, L95, 1–142. [Google Scholar]
  5. Shukla, P.; Bansode, F.; Singh, R. Chloramphenicol Toxicity: A Review. J. Med. Med. Sci. 2011, 2, 1313–1316. [Google Scholar]
  6. European Commission. Commission Regulation (EC) No 1430/94 of 22 June 1994 amending Annexes I, II, III and IV of Council Regulation (EEC) No 2377/90 laying down a Community procedure for the establishment of maximum residue limits of veterinary medicinal products in foodstuffs of animal origin. Off. J. Eur. Communities 1994, L156, 6–8. [Google Scholar]
  7. Gaudin, V.; Cadieu, N.; Maris, P. Inter-laboratory studies for the evaluation of ELISA kits for the detection of chloramphenicol residues in milk and muscle. Food Agric. Immunol. 2003, 15, 143–157. [Google Scholar] [CrossRef]
  8. Biernacki, B. ELISA validation and determination of cut-off level for chloramphenicol residues in honey. Bull. Vet. Inst. Pulawy 2015, 59, 353–356. [Google Scholar] [CrossRef]
  9. Tao, X.; Jiang, H.; Zhu, J.; Wang, X.; Wang, Z.; Niu, L.; Wu, X.; Shi, W.; Shen, J. An ultrasensitive chemiluminescent ELISA for determination of chloramphenicol in milk, milk powder, honey, eggs and chicken muscle. Food Agric. Immunol. 2014, 25, 137–148. [Google Scholar] [CrossRef]
  10. Schortini, G.; Annunziata, L.; Haouet, M.N.; Benedetti, F.; Krusteva, I.; Galarini, R. ELISA qualitative screening of chloramphenicol in muscle, eggs, honey and milk: Method validation according to the Commission Decision 2002/657/EC criteria. Anal. Chim. Acta 2005, 535, 43–48. [Google Scholar] [CrossRef]
  11. Diblikova, I.; Cooper, K.M.; Kennedy, D.G.; Franek, M. Monoclonal antibody-based ELISA for the quantification of nitrofuran metabolite 3-amino-2-oxazolidone in tissues using a simplified sample preparation. Anal. Chim. Acta 2005, 540, 285–292. [Google Scholar] [CrossRef]
  12. Chen, D.; Delmas, J.-M.; Hurtaud-Pessel, D.; Verdon, E. Development of a multi-class method to determine nitroimidazoles, nitrofurans, pharmacologically active dyes and chloramphenicol in aquaculture products by liquid chromatography-tandem mass spectrometry. Food Chem. 2020, 311, 125924. [Google Scholar] [CrossRef]
  13. Shendy, A.H.; Al-Ghobashy, M.A.; Gad Alla, S.A.; Lotfy, H.M. Development and validation of a modified QuEChERS protocol coupled to LC–MS/MS for simultaneous determination of multi-class antibiotic residues in honey. Food Chem. 2016, 190, 982–989. [Google Scholar] [CrossRef] [PubMed]
  14. Robert, C.; Gillard, N.; Brasseur, P.Y.; Pierret, G.; Ralet, N.; Dubois, M.; Delahaut, P. Rapid multi-residue and multi-class qualitative screening for veterinary drugs in foods of animal origin by UHPLC-MS/MS. Food Addit. Contam. Part A 2012, 30, 443–457. [Google Scholar] [CrossRef] [PubMed]
  15. Gaudin, V.; Maris, P. Development of a biosensor based immunoassay for screening of chloramphenicol residues in milk. Food Agric. Immunol. 2001, 13, 77–86. [Google Scholar] [CrossRef]
  16. Ferguson, J.; Baxter, A.; Young, P.; Kennedy, G.; Elliott, C.; Weigel, S.; Gatermann, R.; Ashwin, H.; Stead, S.; Sharman, M. Detection of chloramphenicol and chloramphenicol glucuronide residues in poultry muscle, honey, prawn and milk using a surface plasmon resonance biosensor and Qflex kit chloramphenicol. Anal. Chim. Acta 2005, 529, 109–113. [Google Scholar] [CrossRef]
  17. Pohanka, M.; Skládal, P. Electrochemical biosensors—Principles and applications. J. Appl. Biomed. 2008, 6, 57–64. [Google Scholar] [CrossRef]
  18. Mishra, G.K.; Barfidokht, A.; Tehrani, F.; Mishra, R.K. Food Safety Analysis Using Electrochemical Biosensors. Foods 2018, 7, 141. [Google Scholar] [CrossRef]
  19. Felix, F.S.; Angnes, L. Electrochemical immunosensors—A powerful tool for analytical applications. Biosens. Bioelectron. 2018, 102, 470–478. [Google Scholar] [CrossRef]
  20. Khoshbin, Z.; Verdian, A.; Housaindokht, M.R.; Izadyar, M.; Rouhbakhsh, Z. Aptasensors as the Future of Antibiotics Test Kits-A Case Study of the Aptamer Application in the Chloramphenicol Detection. Biosens. Bioelectron. 2018. [Google Scholar] [CrossRef] [PubMed]
  21. Thévenot, D.R.; Toth, K.; Durst, R.A.; Wilson, G.S. Electrochemical biosensors: Recommended definitions and classification. Biosens. Bioelectron. 2001, 16, 121–131. [Google Scholar] [CrossRef]
  22. Conzuelo, F.; Gamella, M.; Campuzano, S.; Pinacho, D.G.; Reviejo, A.J.; Marco, M.P.; Pingarrón, J.M. Disposable and integrated amperometric immunosensor for direct determination of sulfonamide antibiotics in milk. Biosens. Bioelectron. 2012, 36, 81–88. [Google Scholar] [CrossRef]
  23. Conzuelo, F.; Gamella, M.; Campuzano, S.; Reviejo, A.J.; Pingarrón, J.M. Disposable amperometric magneto-immunosensor for direct detection of tetracyclines antibiotics residues in milk. Anal. Chim. Acta 2012, 737, 29–36. [Google Scholar] [CrossRef] [PubMed]
  24. Gamella, M.; Campuzano, S.; Conzuelo, F.; Esteban-Torres, M.; de las Rivas, B.; Reviejo, A.J.; Munoz, R.; Pingarron, J.M. An amperometric affinity penicillin-binding protein magnetosensor for the detection of [small beta]-lactam antibiotics in milk. Analyst 2013, 138, 2013–2022. [Google Scholar] [CrossRef]
  25. Conzuelo, F.; Ruiz-Valdepeñas Montiel, V.; Campuzano, S.; Gamella, M.; Torrente-Rodríguez, R.M.; Reviejo, A.J.; Pingarrón, J.M. Rapid screening of multiple antibiotic residues in milk using disposable amperometric magnetosensors. Anal. Chim. Acta 2014, 820, 32–38. [Google Scholar] [CrossRef]
  26. CRL. Guideline for the Validation of Screening Methods for Residues of Veterinary Medicines (Initial Validation and Transfer). 2010, pp. 1–18. Available online: http://ec.europa.eu/food/food/chemicalsafety/residues/lab_analysis_en.Guideline_Validation_Screening_en.pdf (accessed on 20 January 2010).
  27. Yan, L.; Luo, C.; Cheng, W.; Mao, W.; Zhang, D.; Ding, S. A simple and sensitive electrochemical aptasensor for determination of Chloramphenicol in honey based on target-induced strand release. J. Electroanal. Chem. 2012, 687, 89–94. [Google Scholar] [CrossRef]
  28. Xiao, L.; Xu, R.; Yuan, Q.; Wang, F. Highly sensitive electrochemical sensor for chloramphenicol based on MOF derived exfoliated porous carbon. Talanta 2017, 167, 39–43. [Google Scholar] [CrossRef] [PubMed]
  29. Pyrzynska, K.; Biesaga, M. Analysis of phenolic acids and flavonoids in honey. TrAC Trends Anal. Chem. 2009, 28, 893–902. [Google Scholar] [CrossRef]
  30. Gheldof, N.; Engeseth, N.J. Antioxidant Capacity of Honeys from Various Floral Sources Based on the Determination of Oxygen Radical Absorbance Capacity and Inhibition of in Vitro Lipoprotein Oxidation in Human Serum Samples. J. Agric. Food Chem. 2002, 50, 3050–3055. [Google Scholar] [CrossRef] [PubMed]
  31. Chebil, L.; Humeau, C.; Anthoni, J.; Dehez, F.; Engasser, J.-M.; Ghoul, M. Solubility of Flavonoids in Organic Solvents. J. Chem. Eng. Data 2007, 52. [Google Scholar] [CrossRef]
  32. Romera-Torres, A.; Romero-González, R.; Martínez Vidal, J.L.; Garrido Frenich, A. Comprehensive tropane alkaloids analysis and retrospective screening of contaminants in honey samples using liquid chromatography-high resolution mass spectrometry (Orbitrap). Food Res. Int. 2020, 133, 109130. [Google Scholar] [CrossRef]
  33. Yamanaka, K.; Vestergaard, M.d.C.; Tamiya, E. Printable Electrochemical Biosensors: A Focus on Screen-Printed Electrodes and Their Application. Sensors 2016, 16, 1761. [Google Scholar] [CrossRef]
  34. Taleat, Z.; Khoshroo, A.; Mazloum-Ardakani, M. Screen-printed electrodes for biosensing: A review (2008–2013). Microchim. Acta 2014, 181, 865–891. [Google Scholar] [CrossRef]
  35. Shaheen, A.; Taj, A.; Liberzeit, P.; Mujahid, A.; Hameed, S.; Yu, H.; Mehmood, A.; Webster, T.; Rasheed, M.; Khan, W.; et al. Design of heterostructured hybrids comprising ultrathin 2D bismuth tungstate nanosheets reinforced by chloramphenicol imprinted polymers used as biomimetic interfaces for mass-sensitive detection. Colloids Surf. B Biointerfaces 2020, 188, 110775. [Google Scholar] [CrossRef]
  36. Wu, Y.-Y.; Huang, P.; Wu, F.-Y. A label-free colorimetric aptasensor based on controllable aggregation of AuNPs for the detection of multiplex antibiotics. Food Chem. 2020, 304, 125377. [Google Scholar] [CrossRef] [PubMed]
  37. Gaudin, V. The Growing Interest in Development of Innovative Optical Aptasensors for the Detection of Antimicrobial Residues in Food Products. Biosensors 2020, 10, 21. [Google Scholar] [CrossRef] [PubMed]
  38. Gaudin, V. Receptor-based electrochemical biosensors for the detection of contaminants in food products. In Electrochemical Biosensors; Elsevier: Amsterdam, The Netherlands, 2019; pp. 307–365. [Google Scholar] [CrossRef]
  39. Dong, X.; Yan, X.; Li, M.; Liu, H.; Li, J.; Wang, L.; Wang, K.; Lu, X.; Wang, S.; He, B. Ultrasensitive detection of chloramphenicol using electrochemical aptamer sensor: A mini review. Electrochem. Commun. 2020, 106835. [Google Scholar] [CrossRef]
  40. Lu, L.; Hu, X.; Zhu, Z.; Li, D.; Tian, S.; Chen, Z. Review—Electrochemical Sensors and Biosensors Modified with Binary Nanocomposite for Food Safety. J. Electrochem. Soc. 2020, 167, 037512. [Google Scholar] [CrossRef]
  41. Lorenz, C.S.R. Aptamers to Antibiotics. In The Aptamer Handbook; Klussmann, D.S., Ed.; Wiley-VCH Verlag GmbH & Co. KGaA: Weinheim, Germany, 2006; pp. 116–130. [Google Scholar] [CrossRef]
  42. Mehlhorn, A.; Rahimi, P.; Joseph, Y. Aptamer-Based Biosensors for Antibiotic Detection: A Review. Biosensors 2018, 8, 54. [Google Scholar] [CrossRef]
Figure 1. Principle of the disposable amperometric magneto-immunosensor for competitive detection of antimicrobial residues. Ab: antibody; HRP: horseradish peroxidase.
Proceedings 60 00048 g001
Figure 2. The electrochemical reaction at the working electrode.
Proceedings 60 00048 g002
Figure 3. Measurement of the amperometric signal. The difference in signal between a blank sample (red) and a sample spiked with 10 ng/mL of chloramphenicol (blue) after the addition of H2O2.
Proceedings 60 00048 g003
Figure 4. Graph showing a series of spiked solutions of chloramphenicol in PBS-T (Phosphate Buffered Saline-Tween). The red curves represent blank samples, and the green curves represent the samples spiked to 1 ng/mL, orange to 10 ng/mL and blue to 100 ng/mL.
Proceedings 60 00048 g004
Figure 5. Results of optimization of different technical parameters: influence on current measurement. (a) Graph showing the current (nA) as a function of the dilution of antibodies used in the blank samples; (b) graph showing the current (nA) as a function of the quantity of beads used (µL) in the blank (orange) or spiked (green) samples; (c) graph showing the current (nA) as a function of the incubation time of the antibody with the magnetic beads in the blank (orange) or spiked (green) samples; (d) graph showing the current (nA) as a function of the dilution of CAP–HRP (Chloramphenicol-Horseradish Peroxidase) in the blank (orange) or spiked (green) samples; (e) graph showing the current (nA) as a function of the concentration of H2O2 in the blank (orange) or spiked (green) samples; (f) graph showing the current (nA) as a function of the applied potential in the blank (orange) or spiked (green) samples.
Proceedings 60 00048 g005aProceedings 60 00048 g005b
Figure 6. Analysis of one blank acacia honey sample, spiked to 3 and 10 ng/g of CAP, before dilution in ultrapure water at different concentrations.
Proceedings 60 00048 g006
Figure 7. Measurement of the pH of honey samples depending on the buffer used for dilution and the botanical origin of honey.
Proceedings 60 00048 g007
Figure 8. Comparison of amperometric curves when analyzing one single acacia honey sample and when analyzing honey samples from different botanical origins. (a) Results of repeated extractions and analyses of one single acacia honey sample. (b) Analyses of eight honey samples from different botanical origins.
Proceedings 60 00048 g008
Figure 9. Similarities in the chemical structures of hydroquinone and three polyphenols.
Proceedings 60 00048 g009
Table 1. Summary of experimental conditions for optimizing the screening method.
Test ConditionsTest 1Test 2Test 3Test 4Test 5Test 6Test 7Test 8Test 9Test 10
Tested samples4 blank2 blank samples and 2 samples spiked to 10 ng/mL
Beads (µL)11, 2, 3, 433333333
Antibodies (dilution)1/10, 1/25, 1/50, 1/1001/501/501/501/501/501/501/501/501/50
Incubation time (min)303010, 20, 30, 6030303030303030
HRP (dilution)1/1001/1001/1001/50, 1/100, 1/250, 1/5001/1001/1001/1001/1001/1001/100
Incubation time (min)3030303010-20-30-60 3030303030
Simultaneous (SI)/sequential (SE)SISISISISISI/SESISISISI
Eapp (V)−0.2−0.2−0.2−0.2−0.2−0.2−0.1, −0.2, −0.3, −0.4−0.2−0.2−0.2
Hydroquinone (mM)11111110.5, 1, 2.5, 511
H2O2 (mM)10010010010010010010010050, 100, 250, 500100
Table 2. Comparison of threshold T and cut-off Fm values when honey extracts were reconstituted in ultrapure water, PBS-T and phosphate buffer.
Volume of Reconstitution WaterPBS-TPhosphate Buffer
200 µLT 1100638236021
Fm 1541233504196
AssayNot validValidValid
120 µLT 1374259406234
Fm 1393630043613
AssayNot validValidValid
1 T and Fm are expressed in nA.
Table 3. Comparison of threshold T and cut-off Fm values when 1.0 g of acacia honey was extracted in acetonitrile and ethyl acetate.
AcetonitrileEthyl Acetate
3 mL7 mL3 mL7 mL
T 12907430436565231
Fm (0.5 ng/g) 13816367633293835
AssayNot validValidValidValid
Fm (1 ng/g) 1278633842762nd
AssayValidValidValid/
1 T and Fm are expressed in Na. nd: not determined.
Table 4. Comparison of threshold T and cut-off Fm values when 2.0 g of acacia honey was extracted with 3 mL and 7 mL of ethyl acetate.
Day 1Day 2
Volumes of Ethyl Acetate3 mL7 mL3 mL7 mL
T 16667640948464406
Fm (0.3 ng/g) 15100688439842981
AssayValidNot validValidValid
Fm (0.5 ng/g) 14148446021782790
AssayValidValidValidValid
1 T and Fm are expressed in Na. nd: not determined.
Table 5. Results of the analyses of honey samples from different botanical origins after extraction of 2.0 g of honey in ethyl acetate (7 mL).
Current (nA)
Botanical OriginBlankCAP 0.3 ng/gBotanical OriginBlankCAP 0.3 ng/g
Acacia34442851Acacia35281594
Acacia36601828Acacia40001700
Chestnut54152153Acacia30081875
Lavender39171025Acacia32501818
Mountain2581546Acacia35281841
Spring41461669
Lime tree1924820
Multifloral46762127
Table 6. Results of the analyses (measured current (nA)) of honey samples from different botanical origins after dilution of 1.0 g of honey with 3 mL of PBS and extraction in ethyl acetate (4 mL).
Reconstitution in
0.5 mL Phosphate Buffer1 mL PBS
Botanical originBlankCAP 0.3 ng/gBlankCAP 0.3 ng/g
Acacia4629327374386944
Chestnut2876239048514314
Forest32663044/6340
Mountain30713107//
Spring3722299276356830
Lime tree3519246269544546
Table 7. Results of the analyses (measured current (nA)) of honey samples from different botanical origins after dilution of 1.0 g of honey with water and extraction in ethyl acetate (4 mL).
3 mL water, 6 mL Ethyl Acetate, Dilution in PBS (1/10) [28]4 mL Water, 6 mL Ethyl Acetate, 1 mL PBS, 1 mL Hexane
Botanical originBlankCAP 0.3 ng/gBotanical originBlankCAP 0.3 ng/g
Lavender83266741Lavender51655295
Lime tree80387754Lime tree49395008
Acacia1066210455Acacia62445692
Mountain101358223Mountain54165162
Forest88738441Scrubland59875145
Heather62975533Sunflower52834648
Table 8. Results of the analyses (measured current (nA)) of honey samples from different botanical origins with the addition of PVPP and extraction in ethyl acetate (7 mL).
PVPP 0.2 ng/gPVPP 0.8 ng/g
Botanical originBlankCAP 0.3 ng/gBlankCAP 0.3 ng/g
Mountain1440109018081347
Forest2502190219951688
Scrubland2224193715761043
Sunflower2244190219771026
Springnd192921911511
Multifloral2764203320181484
Table 9. Results of the analyses (measured current (nA)) of honey samples from different botanical origins after extraction of 2.0 g of honey in ethyl acetate (7 mL) and analyses with modified Multi-Walled Carbon NanoTubes –Screen Printed Carbon Electrodes (MWCNT-SPCE).
BlankCAP 0.3 ng/g
Multifloral34441974
Multifloral18411810
Multifloral26271759
Lavender15611035
Mountain22202425
Forest20152358
Publisher’s Note: MDPI stays neutral with regard to jurisdictional claims in published maps and institutional affiliations.

