Proceeding Paper

Highly Multiplexed Label-Free Imaging Sensor for Accurate Quantification of Small-Molecule Binding Kinetics †

1
Department of Electrical and Computer Engineering, Boston University, Boston, MA 02215, USA
2
Neogen Corp., Lansing, MI 48912, USA
3
Department of Biomedical Engineering, Boston University, Boston, MA 02215, USA
*
Author to whom correspondence should be addressed.
Presented at the 1st International Electronic Conference on Biosensors, 2–17 November 2020; Available online: https://iecb2020.sciforum.net/.
Proceedings 2020, 60(1), 37; https://doi.org/10.3390/IECB2020-07032
Published: 2 November 2020
(This article belongs to the Proceedings of The 1st International Electronic Conference on Biosensors)

Abstract

:
Investigating the binding kinetics of small molecule analytes to larger ligands, such as proteins and antibodies, is a compelling task for the field of drug and biomarker development, as well as the food industry and agro-biotechnology. Here, we improve the limit of detection of the Interferometric Reflectance Imaging Sensor (IRIS), a label-free, highly multiplexed biosensor, to perform real-time affinity measurement of small molecules binding to immobilized antibodies in a microarray format. As the analytes bind to the surface probes, the biomass accumulation on the surface is quantified by measuring the optical reflectance from the layered Si/SiO2 chip through the solution, in a common-path interferometer configuration. As a proof of concept, label-free detection of biotin molecules binding to immobilized streptavidin probes is performed, achieving 1 pg/mm2 sensitivity through signal averaging in a shot noise limited operation. Furthermore, we apply the optimized sensor to the screening of a 20-multiplexed antibody chip (MW~150 kDa ligands) against Fumonisin B1 (MW = 721.8 Da), one of the most prevalent mycotoxins found in many cereal grains such as corn and wheat. The simultaneously recorded binding curves of the toxin to the multiplexed sensor yield a signal-to-noise ratio of ≈8 when noise reduction methods of spatial and temporal averaging are utilized.

1. Introduction

Small molecules are defined as chemical compounds with a molecular weight below 1 kDa [
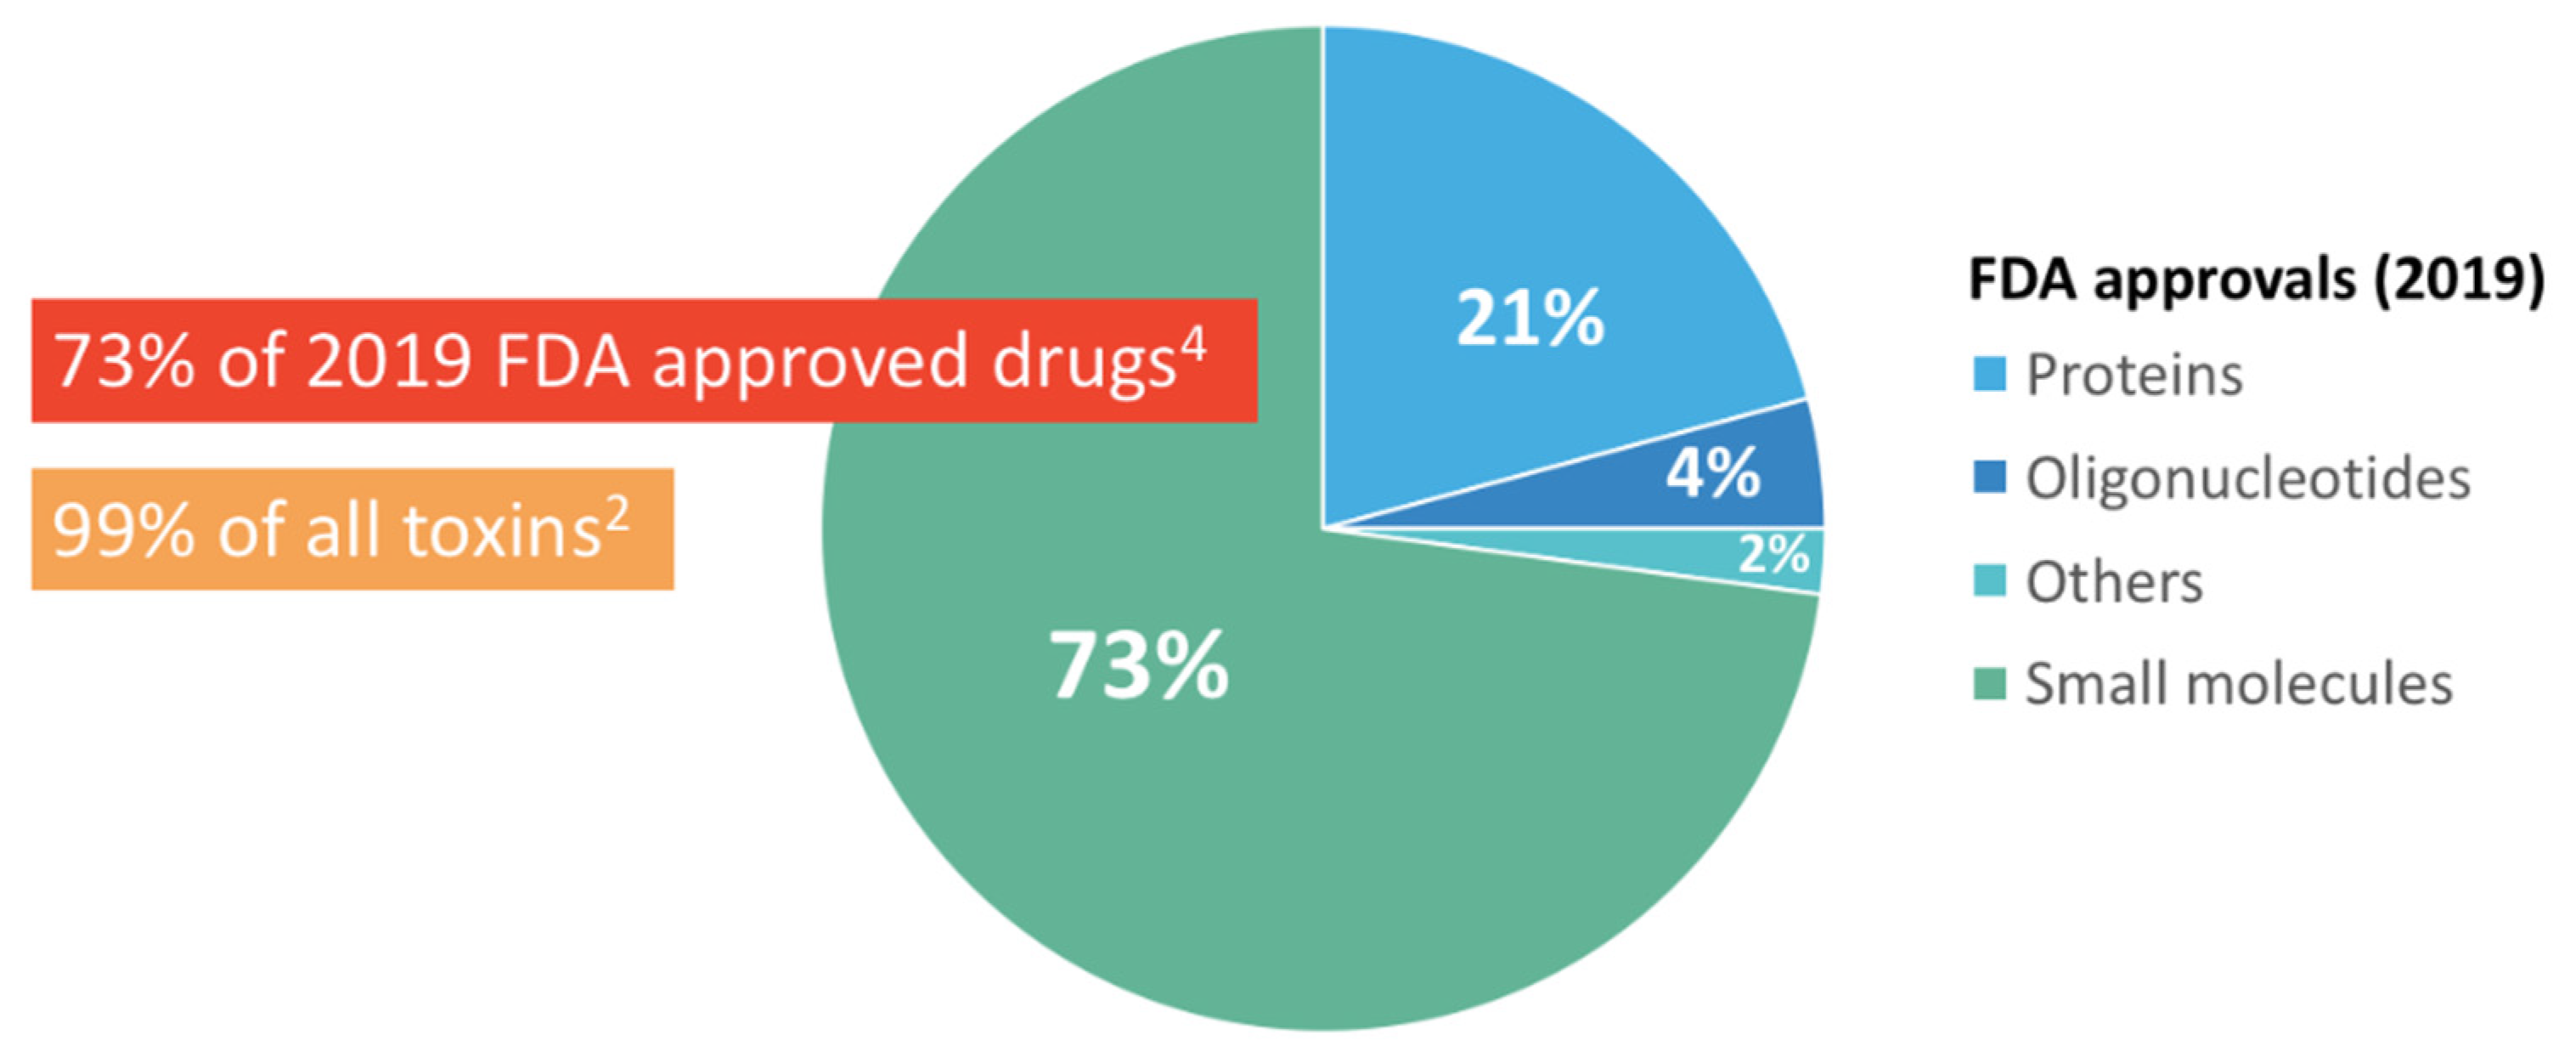
1]. The relevance of these molecules in the field of drug development, as well as agronomy and food biotechnology, arises from the fact that most drugs and toxins belong to this category [2]. As a matter of fact, small-sized molecules have easier access to the cellular membrane, as well as being more easily recognized by membrane-bound antibodies and receptors. For this reason, research on small molecules has been ramping up in the most recent years; just in 2019, 73% of FDA-approved drugs belonged to this category (Figure 1), and 71% in 2018 [3,4].
The most common methods used to study small molecules include both labeled and label-free techniques, although label-free sensors are preferred. The main reason for that is the kinetic capability of label-free sensors, which allows for the study of the real-time affinity behavior of molecules, without an invasive labeling process.
Our approach consists of a label-free sensor based on interferometric imaging. When compared to Surface Plasmon Resonance (SPR) and SPR Imaging (SPRi) [5], the two most commonly used techniques in the field of small molecule characterization, our sensor demonstrates a higher level of multiplexing (440 microarray spots) while maintaining high sensitivity (≈1 pg/mm2). The Interferometric Reflectance Imaging Sensor (IRIS) has been introduced by our group, and has been widely employed in the kinetic study of oligonucleotides and antibodies [6]. Here, we improved its sensitivity through the noise reduction methods of temporal and spatial averaging, demonstrating small molecule sensitivity through a proof-of-concept experiment involving the detection of biotin binding to streptavidin spots. This experiment was utilized to optimize the spatial and temporal averaging methods, described in the Section 3, then applied to the characterization of a common corn toxin, namely fumonisin B1.
Fumonisin is a microfungi-produced mycotoxin that affects corn crops all over the world, intoxicating people who come across it in food products. It is therefore clear why it is of upmost importance for the food industry to be able to detect and characterize the activity of this toxin. With the IRIS, we scanned a 20-plexed antibody chip against fumonisin, obtaining real-time precise data on the affinity of each antibody to the small analyte.
Given the multiplexing level reached by the IRIS in combination with high sensitivity, we are confident that our tool would provide researchers in the field of antibody development with quick and precise data on the efficacy of their custom-developed antibodies against any small analyte of interest.

2. Materials and Methods

2.1. The Interferometric Reflectance Imaging Sensor (IRIS)

The IRIS system has been extensively described in the literature [6,7]. Briefly, a silicon-silicon oxide (Si/SiO2) layered substrate acts as a common path interferometer by illuminating from the top with a narrow-band LED. The light reflected by the substrate is acquired by a CMOS camera. The thickness of the oxide layer (110 nm) is engineered to provide constructive interference at a specific wavelength for biomass accumulation on the chip surface. More specifically, the intensity of the microarray spots increases when biomolecules bind to them due to a shift in the reflectance curve (Figure 2).
Four wavelength LEDs are utilized to acquire a four image stack of the chip, which is subsequently used to create a lookup table that will convert the reflectance signal to biomass accumulation in post-processing analysis [7]. During the real-time acquisition, a single wavelength LED is utilized (456 nm) and multiple frames are acquired and stacked, forming a real-time video of the binding experiment. A scheme of the IRIS setup is reported in Figure 3b.
After the acquisition, the images are converted from signal to mass per unit area through the acquired look-up table, and are further processed through custom-made software in ImageJ and MATLAB. Fitting is performed in MATLAB (Langmuir 1:1 model).

2.2. Surface Coating and Functionalization

The chips are coated with a DMA-based polymeric coating, commercially known as MCP-2 (Lucidant Polymers). The coating is performed by following the manufacturers’ instructions. Coated chips are spotted with the M2 Precise Dispensing Spotter (M2). The spotted chips are left at 70% humidity overnight, then blocked with a 50 mM ethanolamine solution, rinsed in DI water, and finally dried under nitrogen stream. Chips are stored at 4 °C until used. Before proceeding with the experiment, chips are mounted with a 130µm adhesive spacer and a coverglass, as shown in Figure 2a.

2.3. Samples and Reagents

All reagents were purchased from Sigma-Aldrich. The fumonisin and fumonisin antibody samples were provided by Neogen, Inc. The antibodies were produced by injecting mice with fumonisin-conjugated Cholera Toxin B (CTx) or Keyhole Limpet Hemocyanin (KLH). Ten antibodies per type were analyzed, and those are referred to as CTx1-(…)-CTx10, KLH1-(…)-KLH10.

3. Results

3.1. Noise Reduction Methods: Spatial and Temporal Averaging

The IRIS system is based upon detection of biomass accumulation through interferometric imaging, and the images are acquired with a CMOS camera (FLIR GS3-U3-51S5M-C). In such a system, the dominant noise component is shot noise. Shot noise is defined as the noise due to the intrinsic probabilistic nature of light, and it increases with the number of detected photons, with a square root trend. Given its probabilistic nature, the simplest and most effective way to reduce shot noise is by averaging. In our specific case, two types of averaging can be performed:
  • Temporal averaging, that is, capturing a well-defined number of frames in a certain time interval and averaging them together to obtain a single image.
  • Spatial averaging, that is, averaging together a well-defined number of pixels in a single frame.
Both of these averaging techniques contribute to reduce the shot noise, with a potentially unlimited improvement in sensitivity. Realistically, the sensitivity limit depends on the utilized hardware and on the computational memory available. For our purposes, we established 100 frames/image to be the best compromise in terms of temporal averaging, where the limiting factor was the RAM of the computer utilized for the experiments. For what concerns spatial averaging, we ran a proof-of-concept experiment of biotin binding to streptavidin to demonstrate its impact on the sensitivity reached by our system.

Proof-of-Concept: Biotin Detection (244 Da)

Biotin is a well-known molecule in the biophysics field, since its interaction with streptavidin is almost as strong as a covalent bond. This exceptional feature makes it so that biotin is oftentimes conjugated to other molecules to anchor them to a surface through its interaction with streptavidin.
Here, we demonstrated detection of biotin binding to a streptavidin functionalized chip. Streptavidin was immobilized at a spotting concentration of 1 mg/mL and biotin was flowed for 10 min at a concentration of 1µM, preceded and followed by a wash in PBS-1X. The velocity of the flow was kept constant at 200 uL/min.
Due to its incredibly high affinity with streptavidin, the binding curve looks like a step. For this experiment, 50 streptavidin spots were imaged simultaneously. In Figure 4, the binding curve detected for single spots is shown, and in green, we show the average of these curves. As it is clear from this figure, on a single spot, the biotin binding signal can be barely distinguished from the background noise, while averaging 50 spots increases the SNR ratio from ~2 to ~50. These considerations were utilized and applied to the detection of a dangerous food toxin, as described in the following paragraphs.

3.2. Characterization of Fumonisin B1 Toxin

Fumonisin is a corn fungi-produced mycotoxin. It affects corn crops all over the world, causing mycotoxicosis, which can sometimes lead to death. It is therefore crucial for the food industry to be able to efficiently identify and characterize this toxin.
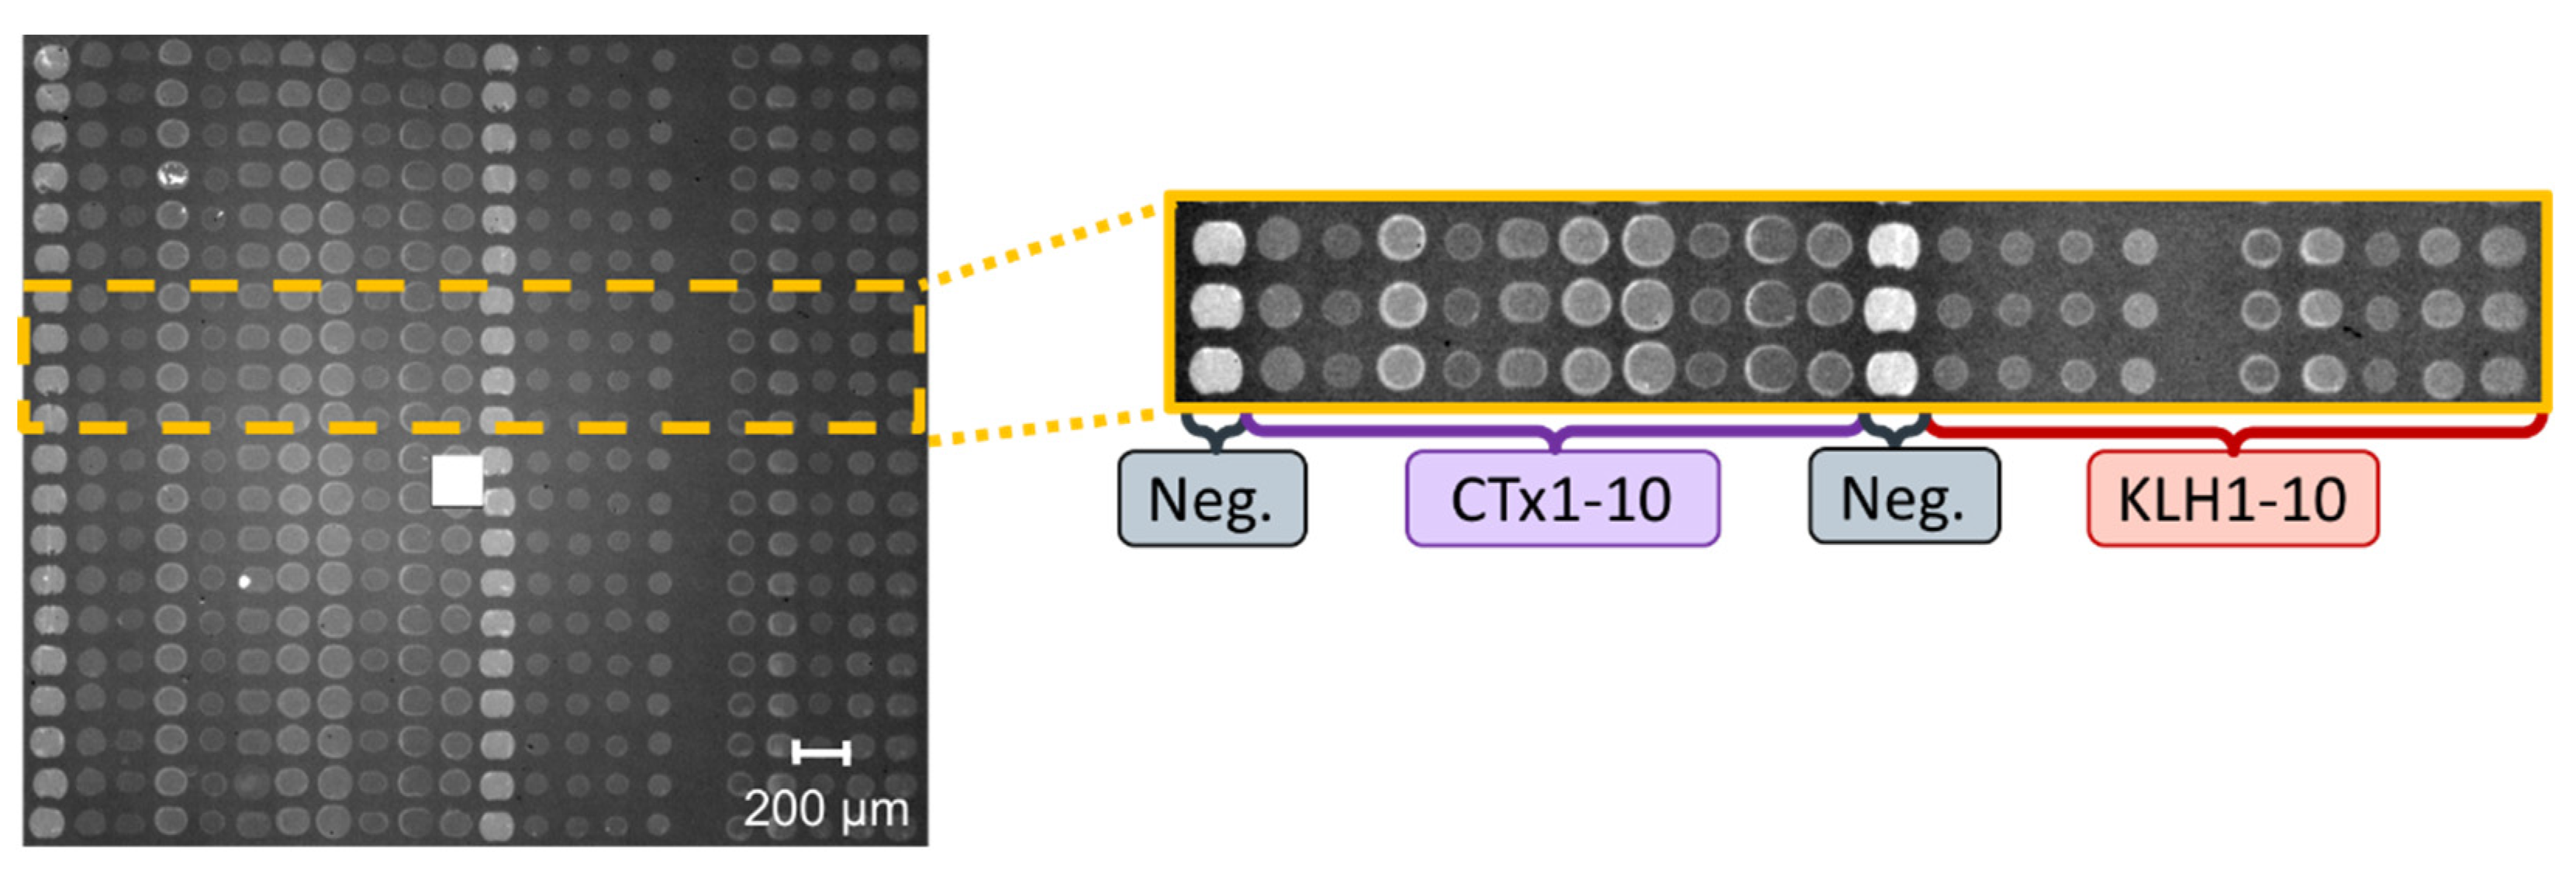
In our assay, we immobilized 20 antibodies that resulted positive to the toxin in an ELISA assay (data not shown) onto an IRIS chip, that was previously activated with MCP-2 polymer as indicated in the materials and methods. The spotted chip was mounted on the IRIS setup and dry images of the spots were acquired, as shown in Figure 5. The image of the chip shows 440 spots, 40 negative spots (BSA), and 20 spots dedicated to each antibody. The antibodies were divided into two subgroups, since they were purified from mice injected with two different fumonisin conjugates, namely Cholera Toxin B subunit (CTx) and Keyhole Limpet Hemocyanin (KLH). The different intensity of the spots is related to the different concentration at which they were spotted, which depended on the purification yield.
As a first stabilization step, PBS 1X was flowed for 20 min across the surface of the chip, followed by fumonisin at 100 µM, and real-time images were acquired in order to obtain the binding curves. PBS 1X was then flowed again in the chamber, to perform dissociation.
Binding of fumonisin was detected on 18 out of the 20 antibodies In Figure 6, six curves are shown as a representative set. There, the dotted black curve represents the negative, the red line indicates the fitted association part of the binding curve, while the blue line highlights dissociation. The curves were fitted with a simple 1:1 Langmuir model. The association and dissociation constants of the selected six antibodies are reported in Table 1. The complete dataset is available at [8].

4. Discussion

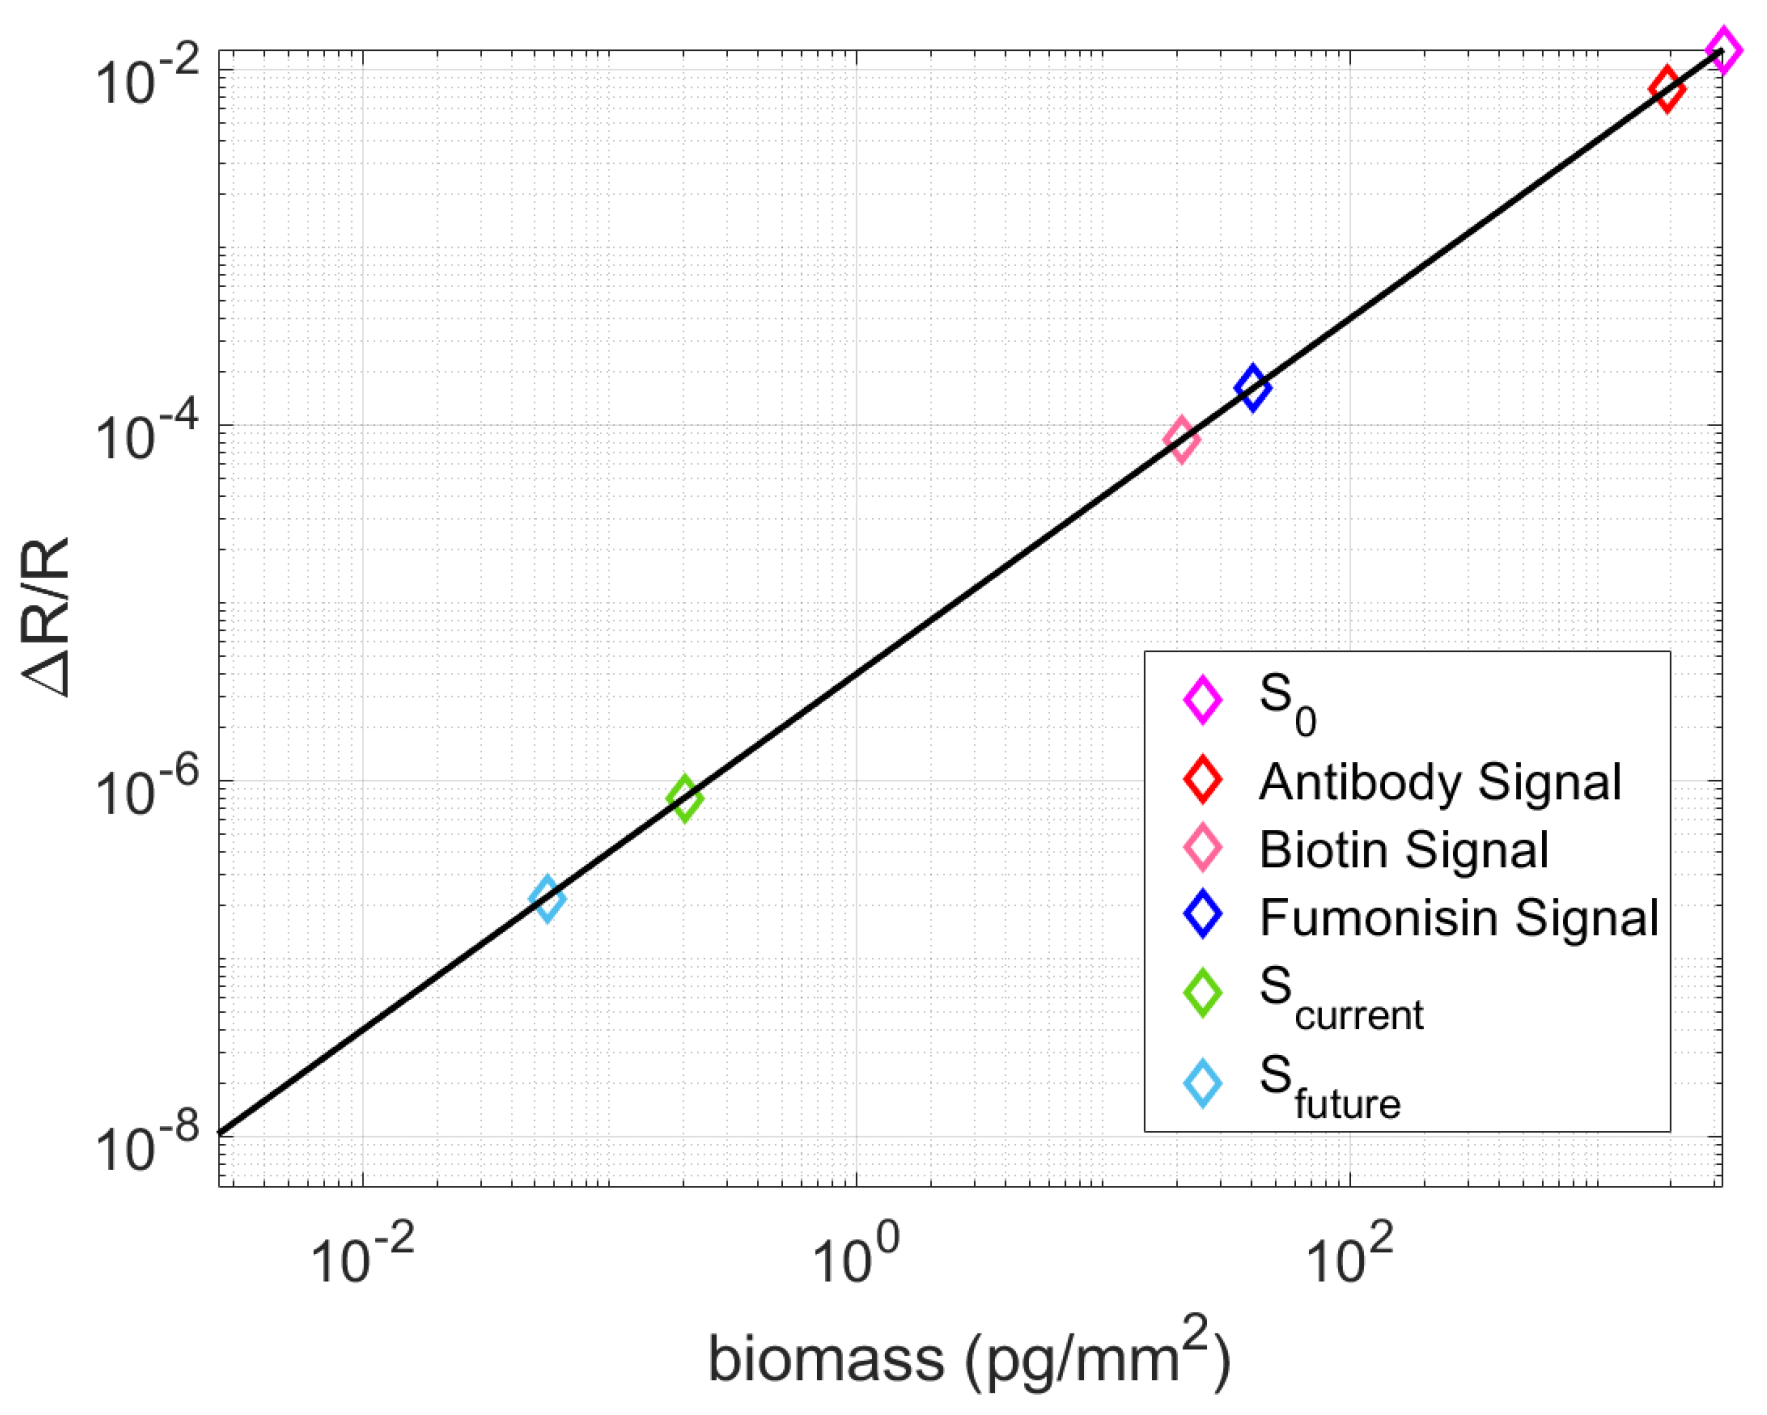
The results obtained with the IRIS setup for biotin detection highlight the impact that temporal and spatial averaging have on the sensitivity of the system. These results will be further improved by increasing the Fill Factor (FF) of the surface, and by employing a new camera with a larger full well capacity and faster frame rate, as shown in Figure 7. The black line in this figure represents the direct conversion between the measured reflectance signal and biomass accumulation. There, some important points are highlighted: S0, which is the sensitivity of the current system without any temporal or spatial averaging applied (purple), around 3 ng/mm2. This sensitivity level would not be enough to even detect binding of large molecules such as antibodies (marked in red, the average signal obtained with an IgG binding curve). In orange and dark blue, respectively, are the signals reached with biotin and fumonisin binding experiments. These two points are clearly above the sensitivity level reached with the current system (Scurrent = 1 pg/mm2, in green), by applying spatial and temporal averaging. However, major improvements can still be made. For example, in the biotin-streptavidin experiments, the spots only occupied the 5% of the image (that is, 271,286 out of the available 5,013,504 pixels on the sensor). The ratio between active and inactive pixels on an image is defined as the fill factor (FF). Regular microarrays do not achieve a good fill factor, since they prioritize multiplexing and therefore usually feature many small spots. By printing bigger spots, the fill factor can potentially be improved up to 40%, achieving a sensitivity of 0.2 pg/mm2 on the current system through additional averaging. Moreover, if the current camera (GS3-U3-51S5M-C, FWC = 10,361) was substituted with a camera that features a larger Full-Well Capacity (FWC), like the FLIR BFS-U3-17S7M (FWC = 98,654), the sensitivity could further be improved to 0.05 pg/mm2 [8].
Concerning the accuracy of the kinetic data, fumonisin results are in accordance with what is expected from ELISA and lateral flow assays, as well as with theoretical predictions [8]. We carried out simulations to evaluate the estimated biomass accumulation by calculating the expected number of biomolecules that can bind to the immobilized probes, based on spotting concentration, spotting yield, and spot size. If one predicts the biomass accumulated on streptavidin spots, for biotin at the utilized concentration, a very similar value to the experimental one is obtained, as demonstrated in [8] (theoretical: ≈46 pg/mm2 experimental: 40.3 ± 1.5 pg/mm2).
These calculations yielded an expected value for biotin higher than the one predicted for fumonisin, even though biotin has a smaller molecular weight (244 Da vs. 721 Da), but this can be explained in a fairly simple way. Streptavidin possesses four binding sites for biotin, and therefore, if one excludes the binding sites made unavailable by the immobilization process, two biotin molecules are expected to bind to each streptavidin molecule, on average (Figure 8a). On the other hand, fumonisin antibodies only have two binding sites for the toxin per molecule, and, on average, one of them is made unavailable by immobilization on the polymeric matrix. Therefore, only one molecule of fumonisin is expected to bind to each antibody molecule, as shown in Figure 8b, giving a theoretical value of ≈27 pg/mm2, fairly close to the experimental value of 20.9 ± 7 pg/mm2 (average across all antibodies).
In conclusion, a highly sensitive, versatile, and highly multiplexable sensor has been demonstrated, with virtually unlimited potential for improvement in terms of sensitivity. We are confident that our system could be a very useful tool for researchers working on antibody characterization and drug screening and development.

Author Contributions

Conceptualization, E.C., F.E.K., A.M.M., and M.S.Ü.; methodology, M.T.G., E.C., A.M.M., and M.S.Ü.; software, A.M.M. and E.C.; validation, D.A. and J.R.; formal analysis, E.C. and A.M.M.; investigation, F.E.K., E.C., and A.M.M.; resources, D.A., J.R., and M.S.Ü.; data curation, E.C. and A.M.M.; writing—original draft preparation, E.C.; writing—review and editing, A.M.M., F.E.K., D.A., and M.S.Ü.; visualization, M.S.Ü.; supervision, M.S.Ü.; project administration, M.S.Ü.; funding acquisition, M.S.Ü. All authors have read and agreed to the published version of the manuscript.

Funding

This research was funded by Boston University Ignition Program and by the National Science Foundation (NSF-iCorps Award, grant number 2027109, and NSF-TT PFI Award, grant number 1941195).

Acknowledgments

Figure 2a, Figure 3a and Figure 8 were created with BioRender.com.

Conflicts of Interest

M.S.Ü. is the principal investigator of the NSF iCorps and NSF-TT PFI technology translation grants for the commercialization of the iRiS technique.

References

  1. Piehler, J.; Brecht, A.; Gauglitz, G. Affinity Detection of Low Molecular Weight Analytes. Anal. Chem. 1996, 68, 139–143. [Google Scholar] [CrossRef] [PubMed]
  2. Wishart, D.; Arndt, D.; Pon, A.; Sajed, T.; Guo, A.C.; Djoumbou, Y.; Knox, C.; Wilson, M.; Liang, Y.; Grant, J.; et al. T3DB: The toxic exposome database. Nucleic Acids Res. 2015, 43, D928–D934. [Google Scholar] [CrossRef] [PubMed]
  3. Mullard, A. 2019 FDA Drug Approvals. Nat. Rev. Drug Discov. 2020, 19, 79–84. [Google Scholar] [CrossRef] [PubMed]
  4. Mullard, A. 2018 FDA Drug Approvals. Nat. Rev. Drug Discov. 2019, 18, 85–89. [Google Scholar] [CrossRef] [PubMed]
  5. Wang, D.; Loo, J.; Chen, J.; Yam, Y.; Chen, S.-C.; He, H.; Kong, S.; Ho, H. Recent Advances in Surface Plasmon Resonance Imaging Sensors. Sensors 2019, 19, 1266. [Google Scholar] [CrossRef] [PubMed]
  6. Daaboul, G.; Vedula, R.; Ahn, S.; Lopez, C.; Reddington, A.; Ozkumur, E.; Ünlü, M. LED-based Interferometric Reflectance Imaging Sensor for quantitative dynamic monitoring of biomolecular interactions. Biosens. Bioelectron. 2011, 26, 2221–2227. [Google Scholar] [CrossRef] [PubMed]
  7. Sevenler, D.; Unlu, S. Numerical techniques for high throughput reflectance interference biosensing. J. Mod. Opt. 2016, 63, 1115–1120. [Google Scholar] [CrossRef]
  8. Chiodi, E.; Marn, A.M.; Geib, M.T.; Ekiz Kanik, F.; Rejman, J.; AnKrapp, D.; Ünlü, M.S. Highly Multiplexed Label-Free Imaging Sensor for Accurate Quantification of Small-Molecule Binding Kinetics. ACS Omega 2020, 5, 25358–25364. [Google Scholar] [CrossRef] [PubMed]
Figure 1. Data from 2019 FDA approvals [4] and from the general toxin database T3DM [2].
Proceedings 60 00037 g001
Figure 2. A scheme of the working principle of the Interferometric Reflectance Imaging Sensor (IRIS). (a) A narrowband LED illuminates a layered substrate where probe molecules are immobilized. Light is reflected by the Si/SiO2 interface as well as from the SiO2/biomass interface [8]. (b) When the thickness of the substrate changes due to binding of biomolecules, the intensity of the spots increases due to constructive interference, which is caused by a shift in the reflectance curve.
Proceedings 60 00037 g002
Figure 3. A scheme of (a) the fluidic cartridge and (b) the IRIS setup. Holes are drilled through the chip to provide an inlet and outlet for solution flow. The red dashed lines indicate the location of the fixture that secures the cartridge/chip inside the setup. The blue arrows show the light path in the interferometer.
Proceedings 60 00037 g003
Figure 4. Biotin-Streptavidin binding experiment. (a) Binding curves as measured on 50 single spots. Average shown in green. (b) Binding curve obtained by averaging 50 streptavidin spots.
Proceedings 60 00037 g004
Figure 5. Dry IRIS image of a spotted chip. Ten antibodies per type (KLH, CTx) were spotted, 20 spot each, along with 40 negative spots (two columns).
Proceedings 60 00037 g005
Figure 6. Binding curves for fumonisin B1 binding to six different antibodies. Complete dataset available at [8]. Figure from [8].
Proceedings 60 00037 g006
Figure 7. Conversion between measured reflectance signal and biomass accumulation. Highlighted are the standard sensitivity of the IRIS system (purple), the sensitivity achieved with spatial and temporal averaging (green), the sensitivity of a system with a larger Full-Well Capacity (FWC) camera, and a higher Fill Factor (FF) (light blue) and three experimental data points of average binding signal (IgG, red; biotin, orange; fumonisin, dark blue) [8].
Proceedings 60 00037 g007
Figure 8. A scheme of (a) biotin binding to streptavidin (expected 2:1) and (b) fumonisin binding to an anti-fumonisin antibody molecule (expected 1:1).
Proceedings 60 00037 g008
Table 1. Association, dissociation, and equilibrium constants for 10 fumonisin antibodies screened against fumonisin at 100 µM. Complete dataset available at [8].
AntibodykON (M−1 s−1)kOFF (s−1)KD (µM)
CT115.6 ± 2.26.82 ± 3.244 ± 22
CT530.8 ± 2.75.13 ± 1.917 ± 6
CT820.0 ± 2.15.3 ± 2.127 ± 11
CT1013.6 ± 2.73.9 ± 3.228 ± 24
KLH39.3 ± 1.114.1 ± 3.0151 ± 37
KLH431.9 ± 5.721.5 ± 5.367 ± 22
Publisher’s Note: MDPI stays neutral with regard to jurisdictional claims in published maps and institutional affiliations.

