Proceeding Paper

Electrokinetically Assisted Paper-Based DNA Concentration for Enhanced qPCR Sensing †

Artie McFerrin Department of Chemical Engineering, Texas A&M University, 3122 TAMU, College Station, TX 77843, USA
*
Author to whom correspondence should be addressed.
Presented at the 1st International Electronic Conference on Biosensors, 2–17 November 2020; Available online: https://iecb2020.sciforum.net/.
Proceedings 2020, 60(1), 33; https://doi.org/10.3390/IECB2020-07074
Published: 2 November 2020
(This article belongs to the Proceedings of The 1st International Electronic Conference on Biosensors)

Abstract

:
Paper-based microfluidics have gained widespread attention for use as low-cost microfluidic diagnostic devices in low-resource settings. However, variability in fluid transport due to evaporation and lack of reproducibility with processing real-world samples limits their commercial potential and widespread adoption. We have developed a novel fabrication method to address these challenges. This approach, known as “Microfluidic Pressure in Paper” (μPiP), combines thin laminating polydimethylsiloxane (PDMS) membranes and precision laser-cut paper microfluidic structures to produce devices that are low-cost, scalable, and exhibit controllable and reproducible fluid flow dynamics similar to conventional microfluidic devices. We present a new μPiP DNA sample preparation and processing device that reduces the number of sample preparation steps and improves sensitivity of the quantitative polymerase chain reaction (qPCR) by electrophoretically separating and concentrating nucleic acids (NAs) continuously on paper. Our device was assembled using two different microfluidic paper channels: one with a larger pore (25 microns) size for bulk fluid transport and another with a smaller pore size (11 microns) for electrophoretic sample concentration. These two paper types were aligned and laminated within PDMS sheets, and integrated with adhesive copper tape electrodes. A solution containing a custom DNA sequence was introduced into the large pore size paper channel using a low-cost pressure system and a DC voltage was applied to the copper tape to electrophoretically deflect the solution containing NAs into the paper channel with the smaller pore size. Samples were collected from both DNA enriched and depleted channels and analyzed using qPCR. Our results demonstrate the ability to use these paper devices to process and concentrate nucleic acids. Our concentration device has the potential to reduce the number of sample preparation steps and to improve qPCR sensitivity, which has immediate applications in disease diagnostics, microbial contamination, and public health monitoring.

1. Introduction

In recent times, microfluidics has received widespread attention due to its ability to develop robust and portable micro total analysis systems (μTAS, or lab-on-a-chip) [1]. The global microfluidics market size is expected to reach USD 31.6 billion by 2027 [2]. Evidently, over the past few decades, researchers have reported thousands of novel microfluidic platforms in the fields of environmental, pharmaceutical, and biomedical engineering [1,3,4]. However, very few of them have been translated into commercial products [4]. Disconnection between developers and end users and absence of low-cost, precise, and high throughput manufacturing techniques have been reported as principle causes for low market penetration of microfluidic devices [1,3,4,5].
In academia, soft lithography has been the predominant choice of fabrication technique for microfluidic devices [1,4,5]. First introduced in 1998 by George Whitesides group, soft lithography techniques use photolithography to create master molds on a silicon wafer. A pre-polymer (often PDMS) is poured on top of this master mold. When cured, this PDMS-containing replica of the master mold is peeled off and bonded irreversibly to a glass slide using plasma treatment. The main advantage of this technique is the ability to create submicron features with high resolution. In addition, the gas permeability and biocompatibility of PDMS makes it an ideal choice for a biomedical microfluidic device. However, lack of scalability and the requirement of cleanroom facility to create submicron features have limited the use of soft-lithography in industrial settings [1,4,5]. For industrial manufacturing, injection molding and hot embossing have been used extensively to fabricate commercial microfluidic devices [1,5]. In contrast to soft lithography, these techniques have higher throughput and can fabricate thousands of devices in a relatively short amount of time. However, these techniques have a high entry cost due to expensive manufacturing equipment and are restricted to thermoplastics for device fabrication [5].
Over the past decade, paper-based microfluidics have gained widespread attention as a novel method for creating microfluidic devices in low-resource settings [6,7,8,9]. Paper is hydrophilic in nature and different techniques such as, photolithography, plasma oxidation, cutting, wax printing, etc., can be used to create hydrophobic zones within the paper matrix. Fluid transport takes place through the hydrophilic channels using capillary action [7,10,11]. Paper-based microfluidics has been used extensively to develop lateral flow assays and colorimetric detection devices [6,8,12,13,14,15]. However, lack of fluid retention and variability in fluid transport due to evaporation is a major limitation for paper based microfluidic devices [8]. In addition, poor sensitivity and lack of reproducibility in real-world conditions have limited paper-based microfluidics from reaching its full potential [6,9].
To address these challenges, we have developed a novel low-cost microfluidic fabrication technique called microfluidic pressure in paper (µPiP) which combines paper and PDMS to fabricate robust fluidic devices. In µPiP, we utilize a laser cutter to rapidly cut paper fluidic channels at micronscale resolution. We then confine these paper channels between two thin PDMS sheets. Using a combination of corona plasma treatment and a high-pressure thermal press, we chemically seal these paper channels within the PDMS membranes. Using this novel workflow, the final µPiP devices are tightly sealed within the PDMS and are devoid of any air bubbles. We have used the µPiP technique to successfully develop traditional used microfluidic devices such as T-channel, H-filter, serpentine channel, and gradient generator. In this work we have combined copper tape electrodes with paper channels to develop an electrokinetically-assisted µPiP device that can separate and concentrate charged analytes, such as DNA, from a bulk solution.
Two different paper channels, one with a larger pore size for bulk fluid transport and a smaller pore size for sample concentration, combined with a copper tape electrode, were used for device fabrication. Paper channels and copper tape were aligned and sealed within PDMS sheets. Copper wires were used to connect electrodes with a voltage generator. We used a negatively charged dye, Alexa Flour 594, to characterize the electrokinetic system. A solution containing dye and diH2O was introduced into the channel with larger pore size. DC voltage was then applied at the copper electrodes to deflect dye from bulk solution into the channel with the smaller pore size. In addition, an 88 bp, randomly generated, double-stranded DNA sequence was used to demonstrate DNA separation and concentration from a buffer solution. We achieved a 30-fold increase in DNA concentration using 100 V DC voltage over 20 min of field exposure. Currently, qPCR sample preparation requires multiple steps to isolate and concentrate NA’s from lysates and other biofluids containing PCR inhibitors. Our results demonstrate the ability to use these paper devices to reduce the number of sample preparation steps and to improve qPCR sensitivity.

2. Materials and Methods

2.1. Device Fabrication

Two different paper channels, one with a larger pore size (Whatman #4, 25 µm) for bulk fluid transport and a smaller pore size (Whatman #1, 11 µm) for sample concentration and a copper tape electrode (McMaster Carr) were used for device fabrication. A laser cutter (PLS6.120D, Universal Laser Systems) was used to cut 3 mm paper channels. Paper channels and copper tape were aligned and sealed within PDMS sheets (McMaster Carr) using corona treatment (BD-20AC, Electro-Technic Products) and heat press (Dulytek DW 400, 52 °C, max pressure ~5.5 MPa). Copper wires were used to connect electrodes to an external voltage generator. Figure 1 illustrates these fabrication steps.

2.2. Electrophoresis

For DNA experiments, a stock solution of DNA was made containing 20 mM Bis-Tris (Sigma), 20 mM Tricine (Sigma), 1x SYBR (Lonza), and 50 nM DNA (IDT). The Bis-Tris and Tricine acted as a trailing electrolyte and SYBR was used to visualize DNA deflection in the ChemiDoc (Bio-Rad). For all experiments, solutions were flowed at 5 μL/min using a syringe pump. For the Alexafluor 594 (Sigma) experiments, a potential was applied across the channel width at increasing increments of 100 V to induce electrophoresis. Images were captured with a cell phone camera and processed in ImageJ.
Prior to DNA experiments, the devices were soaked in 3% w/v BSA (Sigma) in diH2O for 40 minutes, followed by washing with diH2O for 30 min. The DNA solution was then flowed through the device and 1 μL samples were collected from Outlets 1 and 2 for analysis. Prior to electric field application, Outlet 1 was covered with a slab of PDMS, with a needle embedded in the PDMS, piercing the paper, serving as a connection point. To induce electrophoresis, a 100 V potential was applied across the channel width for a total of 20 min. After 20 min, the paper in Outlet 1 and Outlet 2 was extracted for qPCR analysis. The process for DNA concentration and analysis can be seen in Figure 2.

2.3. qPCR

To analyze the degree of DNA concentration due to electrophoresis, we used quantitative PCR (qPCR) to track the shift in Cq values, which correspond to a shift in DNA concentration. The no-field samples were diluted 1:100 in diH2O twice, for a final dilution of 1:10,000. The paper outlets for the 100 V field exposure were also diluted 1:100 twice, for a final dilution of 1:10,000. The qPCR reaction (10 μL final volume) contained 1x qPCR mix (Bio-Rad), 250 nM forward primer (IDT), 250 nM reverse primer (IDT), and 1:10 diluted DNA sample (final dilution of DNA is 1:100,000). The samples that were analyzed by qPCR were 0V: Outlet 1 & Outlet 2, 100 V: Outlet 1 & Outlet 2, and the original DNA stock, for a total of five samples. Thermal cycler amplifications were cycled between 95 °C for five seconds and 60 °C for thirty seconds, for forty cycles. After amplification, the qPCR data were analyzed using CFX Maestro software (Bio-Rad).

3. Results and Discussion

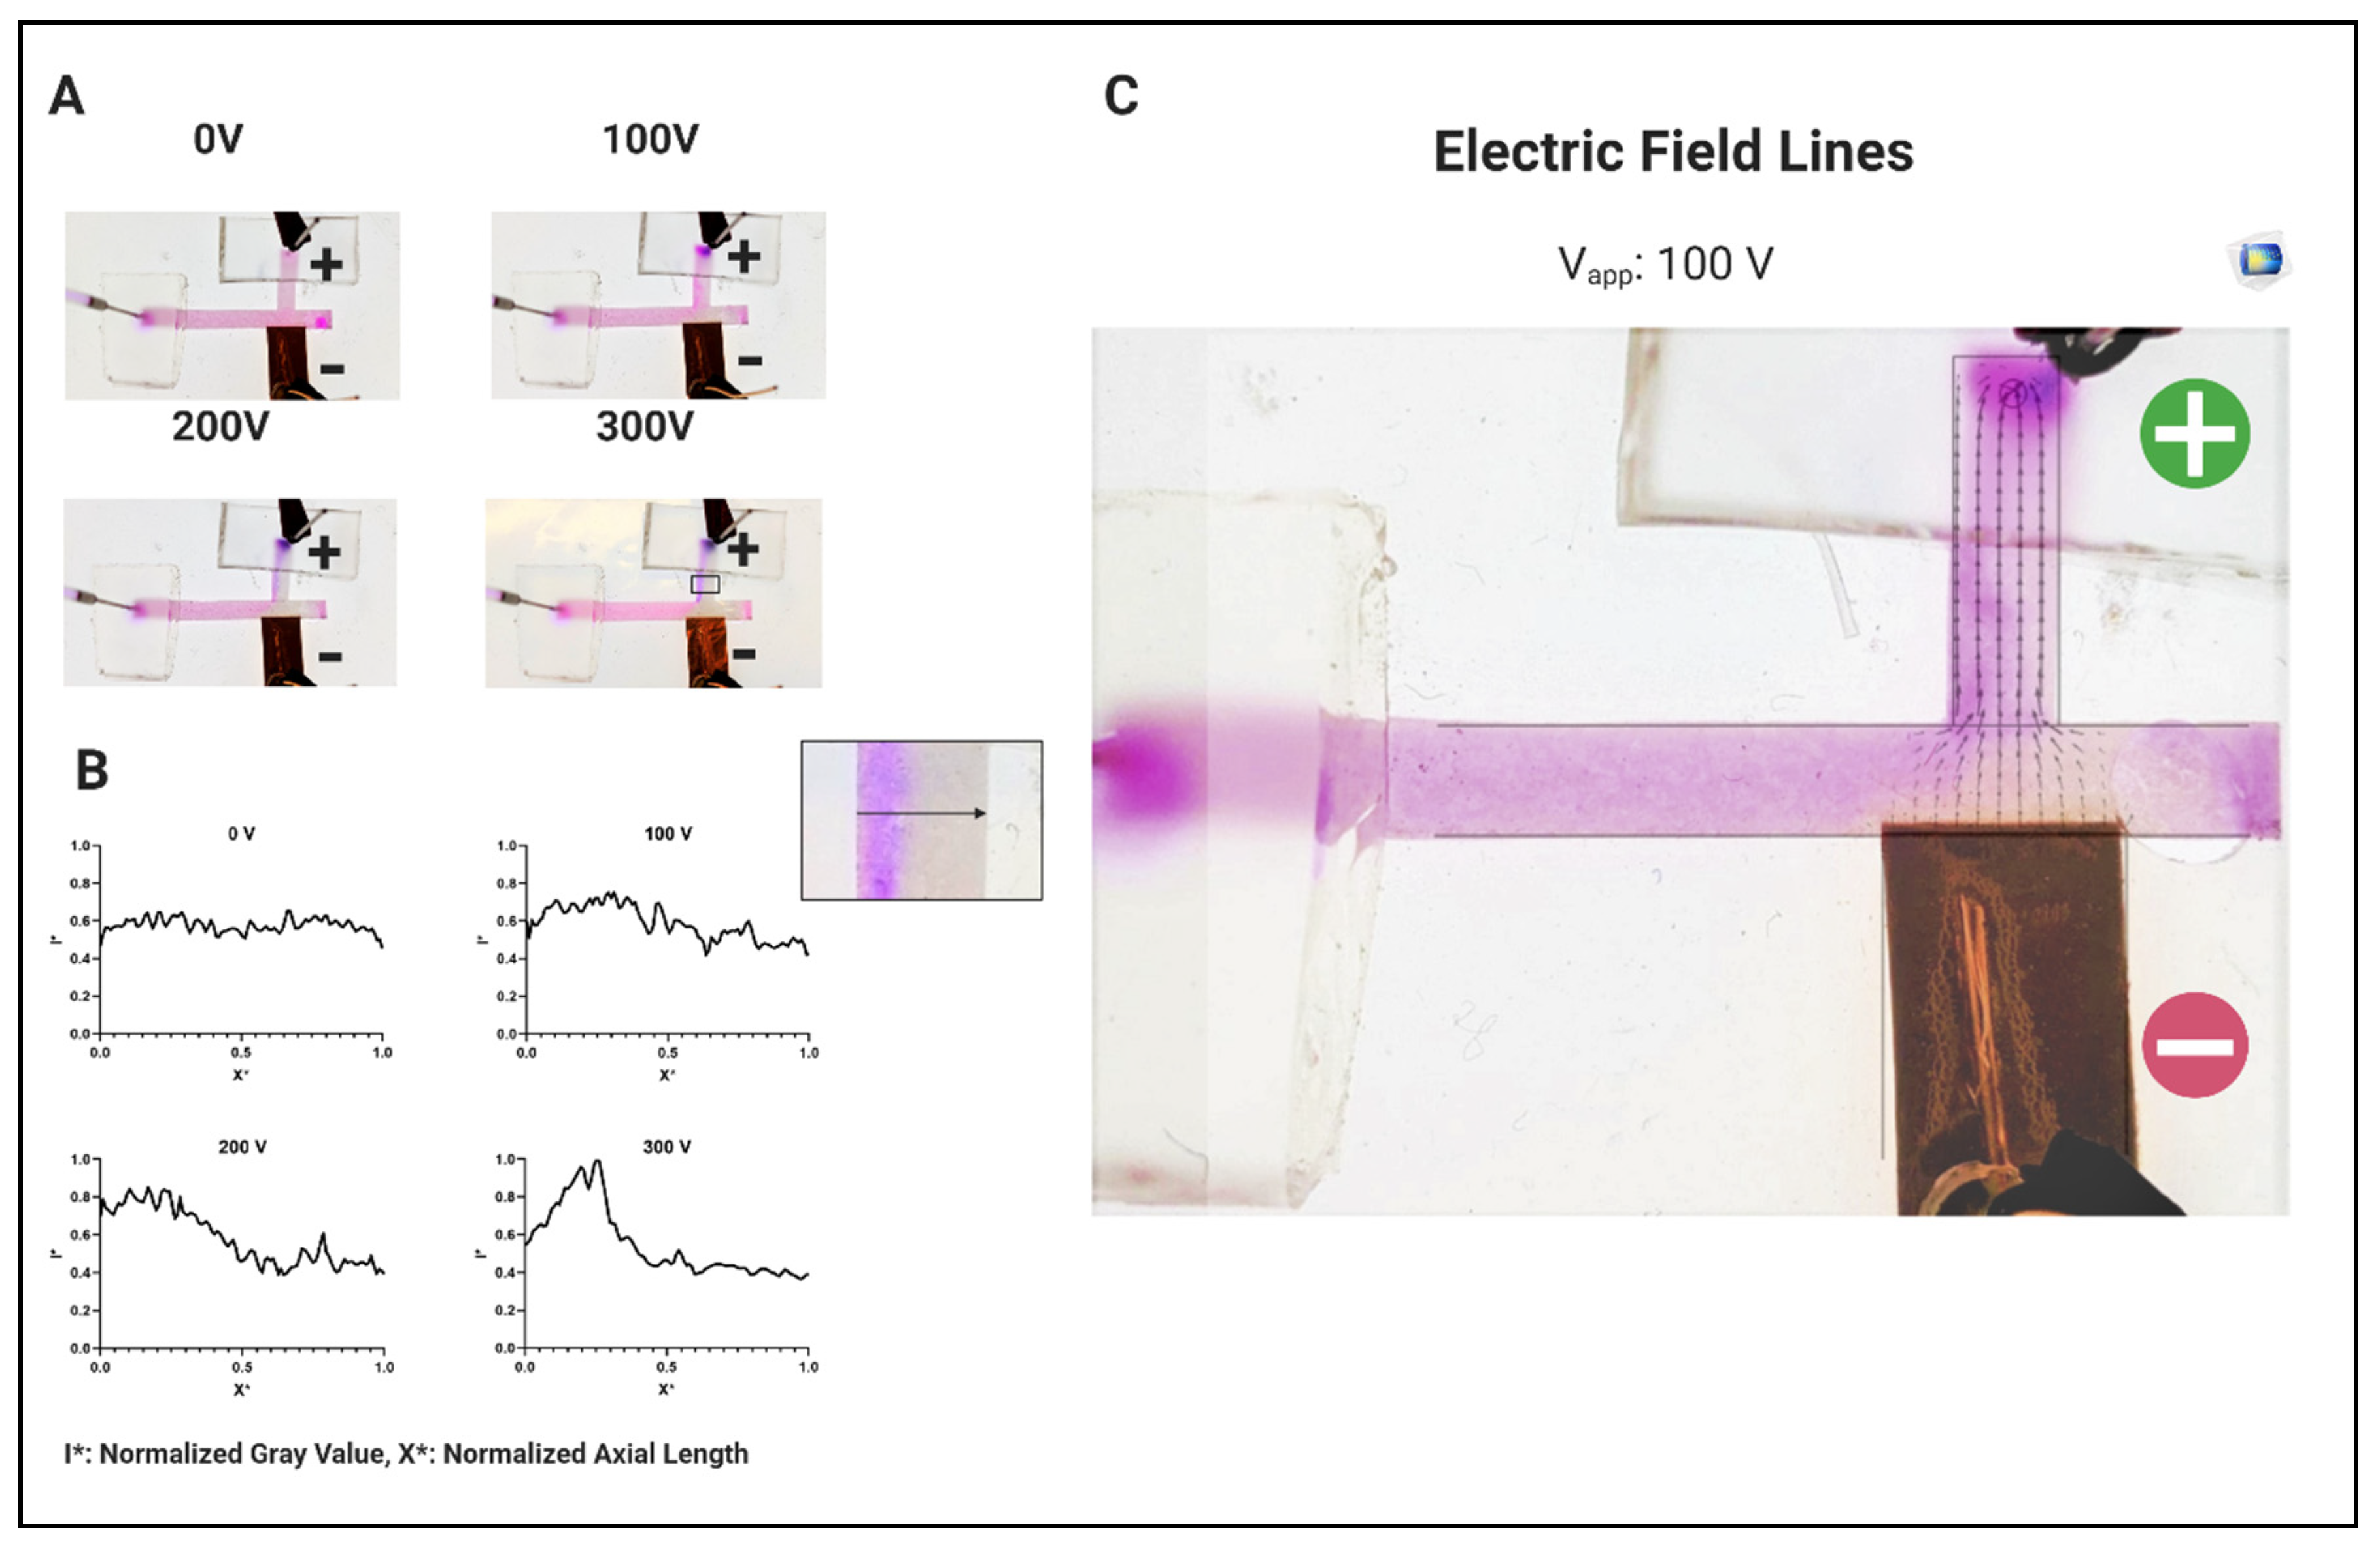
3.1. System Characterization Using Charged Dyes

Alexa Flour 594, a negatively charged dye, was used to characterize the electrokinetic system. This workflow is illustrated in Figure 3. A solution containing 208 µM dye and DI water was introduced into the channel with larger pore size at a flowrate of 5 µL/min. When the channel was fully wetted, DC voltage was applied at copper electrode to deflect dye from bulk solution into a channel with smaller pore size. As shown in Figure 3A, the rate of deflection increased with an increase in applied voltage and at 300 V, all of the dye present in bulk solution was deflected into collection channel. To further visualize dye movement, gray value from a section of the collection channel was measured using ImageJ software. As shown in Figure 3B, the paper–PDMS interface acts as a wall at which dye molecules start to accumulate. Because of fluid flow and voltage difference, a combination of hydrodynamic and electrokinetic forces pushes the charged dyes towards the positive pin at the top of the device. This dye movement is in agreement with electric field lines generated using COMSOL Multiphysics software, as shown in Figure 3C.

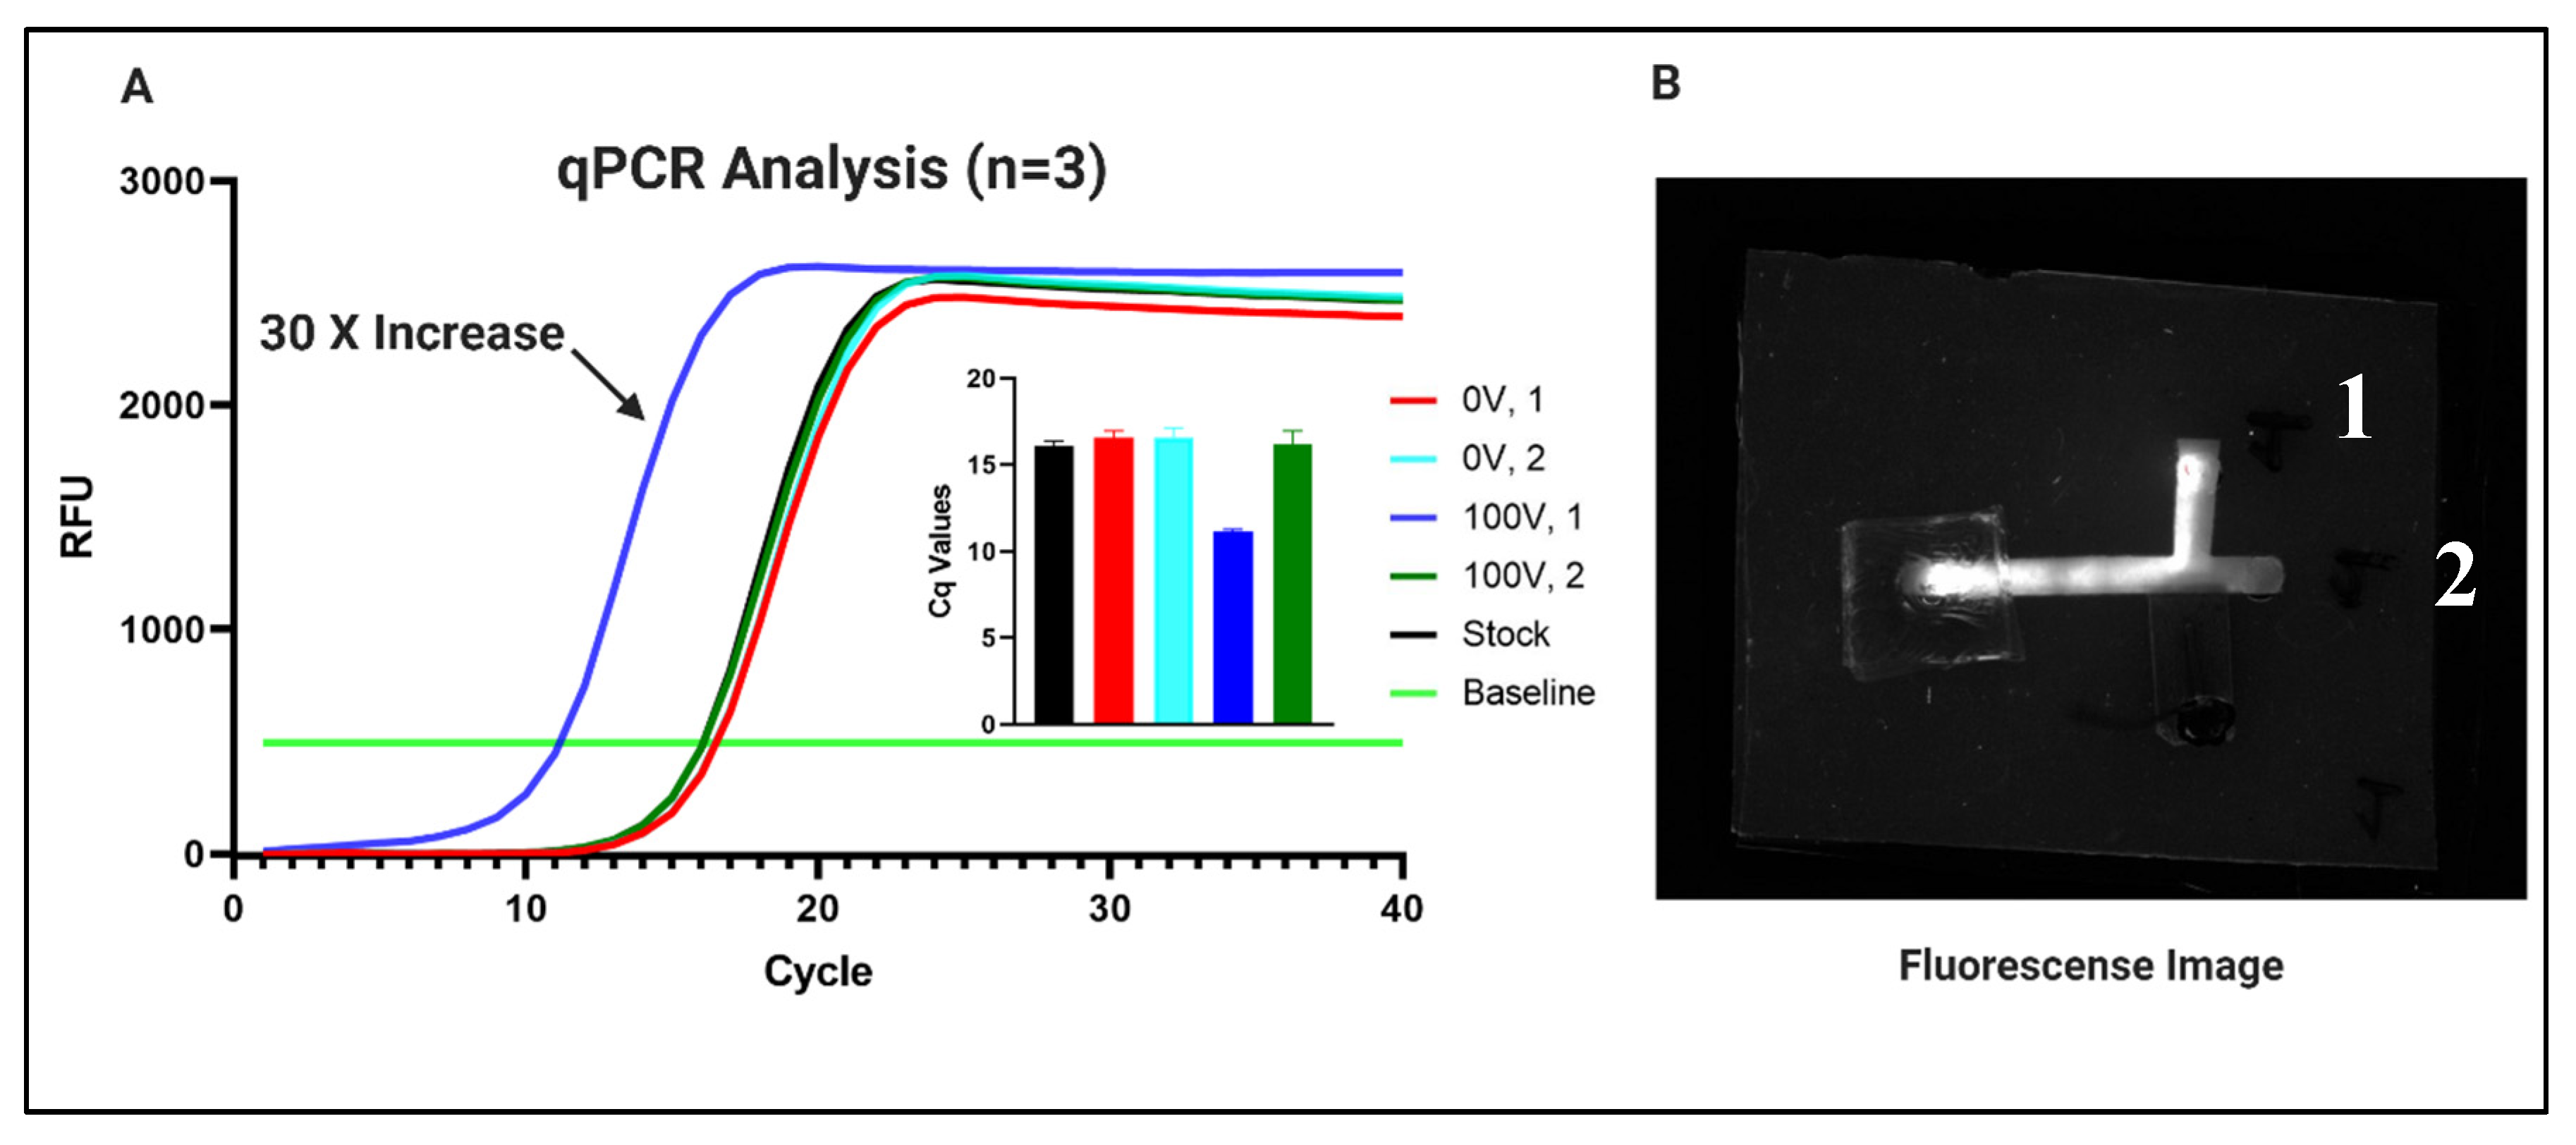
3.2. Nucleic Acid Concentration

An 88 bp, randomly generated, double-stranded DNA sequence was used to separate DNA from a buffer solution. The workflow for DNA separation is shown in Figure 2. Buffer solution containing 50 nM DNA with trailing electrolyte was flown into channel 2 at 5µL/min. As shown in Figure 2, 100 V DC voltage was applied to deflect DNA into channel 1. After running the operation for 20 min, paper samples were collected from both DNA enriched and depleted channels (channels 1 and 2, respectively). DNA from paper was eluted in diH2O and qPCR was used to evaluate DNA concentration.
As shown in Figure 4A, qPCR analysis shows a 30-fold increase in DNA concentration as compared to stock solution. This increase in concentration was achieved using only 100 V DC voltage, which can be adapted for use in a portable format. To visualize DNA deflection, a ChemiDoc imaging system was used to measure device fluorescence intensity. As mentioned earlier, SYBR binds with DNA and resulting SYBR-DNA complex which is excited at 497 nm. Figure 4B shows this fluorescence image, where DNA is being deflected into channel 1, corresponding to fluorescence increase in the channel 1 collection zone. This corroborates the results obtained with qPCR analysis. The next step is to integrate a low-cost voltage boost converter into the workflow and concentrate nucleic acids from human biofluid samples.

4. Conclusions

In this work, the aim was to address some of the challenges of traditional paper microfluidics, such as evaporation and lack of fluid retention, by encapsulating paper channels in PDMS membranes, creating µPIP devices. These devices were made using simple paper strips, PDMS membranes, and a heat press, being both simple to make and quick to manufacture. Using electric fields, we were able to use these devices to deflect charged particles, both dye and DNA, into a desired outlet, concentrating them to levels which can make downstream analysis easier. This technology can be used to replace traditional microfluidics devices due to their ease-of-manufacturing and reproducibility, in addition to making the analysis of biological systems more efficient and less time-consuming.

Author Contributions

M.N.I. carried out a major part of the literature review, experimental studies and drafted the manuscript. J.Y. performed laboratory experiments and drafted the manuscript. Z.G. conceived the study, supervised the research project and manuscript preparation, and helped to revise and finalize the manuscript. All authors have read and agreed to the published version of the manuscript.

Funding

This research was funded by NASA early carrier faculty award.

Acknowledgments

All the figures were created using biorender.com.

Conflicts of Interest

The authors declare no conflict of interest.

References

  1. Convery, N.; Gadegaard, N. 30 years of microfluidics. Micro Nano Eng. 2019, 2, 76–91. [Google Scholar] [CrossRef]
  2. Microfluidics Market Size, Share & Trends Analysis Report By Application (Lab-on-a-Chip, Organs-on-Chips, Continuous Flow), By Technology (Medical, Non-Medical), By Material, And Segment Forecasts, 2020–2027; Grand View Research: San Francisco, CA, USA, 2020.
  3. Faustino, V.; Catarino, S.O.; Lima, R.; Minas, G. Biomedical microfluidic devices by using low-cost fabrication techniques: A review. J. Biomech. 2016, 49, 2280–2292. [Google Scholar] [CrossRef] [PubMed]
  4. Walsh, D.I., 3rd; Kong, D.S.; Murthy, S.K.; Carr, P.A. Enabling Microfluidics: From Clean Rooms to Makerspaces. Trends Biotechnol. 2017, 35, 383–392. [Google Scholar] [CrossRef]
  5. Gale, B.; Jafek, A.; Lambert, C.; Goenner, B.; Moghimifam, H.; Nze, U.; Kamarapu, S. A Review of Current Methods in Microfluidic Device Fabrication and Future Commercialization Prospects. Inventions 2018, 3, 60. [Google Scholar] [CrossRef]
  6. Carrell, C.; Kava, A.; Nguyen, M.; Menger, R.; Munshi, Z.; Call, Z.; Nussbaum, M.; Henry, C. Beyond the lateral flow assay: A review of paper-based microfluidics. Microelectron. Eng. 2019, 206, 45–54. [Google Scholar] [CrossRef]
  7. Martinez, A.W.; Phillips, S.T.; Butte, M.J.; Whitesides, G.M. Patterned paper as a platform for inexpensive, low-volume, portable bioassays. Angew. Chem. Int. Ed. Engl. 2007, 46, 1318–1320. [Google Scholar] [CrossRef] [PubMed]
  8. Sher, M.; Zhuang, R.; Demirci, U.; Asghar, W. Paper-based analytical devices for clinical diagnosis: Recent advances in the fabrication techniques and sensing mechanisms. Expert Rev. Mol. Diagn. 2017, 17, 351–366. [Google Scholar] [CrossRef] [PubMed]
  9. Soum, V.; Park, S.; Brilian, A.I.; Kwon, O.S.; Shin, K. Programmable Paper-Based Microfluidic Devices for Biomarker Detections. Micromachines (Basel) 2019, 10, 516. [Google Scholar] [CrossRef] [PubMed]
  10. Osborn, J.L.; Lutz, B.; Fu, E.; Kauffman, P.; Stevens, D.Y.; Yager, P. Microfluidics without pumps: Reinventing the T-sensor and H-filter in paper networks. Lab Chip 2010, 10, 2659–2665. [Google Scholar] [CrossRef] [PubMed]
  11. Määttänen, A.; Fors, D.; Wang, S.; Valtakari, D.; Ihalainen, P.; Peltonen, J. Paper-based planar reaction arrays for printed diagnostics. Sens. Actuators B Chem. 2011, 160, 1404–1412. [Google Scholar] [CrossRef]
  12. Islam, M.N.; Ahmed, I.; Anik, M.I.; Ferdous, M.S.; Khan, M.S. Developing Paper Based Diagnostic Technique to Detect Uric Acid in Urine. Front. Chem. 2018, 6, 496. [Google Scholar] [CrossRef] [PubMed]
  13. Andres, W.; Martinez, S.T.P.; Carrilho, E.; Whitesides, G.M. Diagnostics for the Developing World: Microfluidic Paper-Based Analytical Devices. Anal. Chem. 2010, 82, 3–10. [Google Scholar]
  14. Cheng, C.M.; Martinez, A.W.; Gong, J.; Mace, C.R.; Phillips, S.T.; Carrilho, E.; Mirica, K.A.; Whitesides, G.M. Paper-based ELISA. Angew. Chem. Int. Ed. Engl. 2010, 49, 4771–4774. [Google Scholar] [CrossRef] [PubMed]
  15. Jokerst, J.C.; Adkins, J.A.; Bisha, B.; Mentele, M.M.; Goodridge, L.D.; Henry, C.S. Development of a paper-based analytical device for colorimetric detection of select foodborne pathogens. Anal. Chem. 2012, 84, 2900–2907. [Google Scholar] [CrossRef] [PubMed]
Figure 1. Fabrication steps for electrokinetically assisted microfluidic pressure in paper (µPiP) device.
Proceedings 60 00033 g001
Figure 2. Workflow of DNA concentration and analysis using the µPIP device.
Proceedings 60 00033 g002
Figure 3. (A) Deflection of charged dyes into collection channel due to voltage difference. (B) Normalized gray value intensity in collection channel. (C) Electric field lines generated by the electrokinetic system.
Proceedings 60 00033 g003
Figure 4. (A) Results obtained from qPCR analysis of eluted solution from paper samples. (B) Fluorescence image of the device using ChemiDoc imaging system.
Proceedings 60 00033 g004
Publisher’s Note: MDPI stays neutral with regard to jurisdictional claims in published maps and institutional affiliations.

