Proceeding Paper

Design and Optimization of a Rapid, Multiplex miRNA Assay without Washing Steps †

1
Dipartimento di Biotecnologie Mediche e Medicina Traslazionale, Università degli Studi di Milano, 20090 Segrate (MI), Italy
2
Proxentia s.r.l., viale Ortles 22/4, 20141 Milano, Italy
3
Nanomedicine and Molecular Imaging Laboratory, Istituti Clinici Scientifici Maugeri IRCCS, 27100 Pavia, Italy
*
Author to whom correspondence should be addressed.
Presented at the 1st International Electronic Conference on Biosensors, 2–17 November 2020; Available online: https://iecb2020.sciforum.net/.
Proceedings 2020, 60(1), 32; https://doi.org/10.3390/IECB2020-07040
Published: 2 November 2020
(This article belongs to the Proceedings of The 1st International Electronic Conference on Biosensors)

Abstract

:
MicroRNAs are widely studied as circulating biomarkers for early stage diagnosis of several diseases, but the procedures for their detection and quantification are currently complex and time consuming. We demonstrate a rapid, multiplex, one-pot detection method based on two-step amplification of the signal measured by a recent label-free optical biosensor, Reflective Phantom Interface (RPI). The specific capture with surface DNA probes is combined with mass amplification by an antibody targeting DNA–RNA hybrids and polyclonal secondary antibody, all performed without washing steps. Through this method, we achieved linear, sub-pM quantification of different miRNAs in 1.5 h. The RPI enabled the characterization of equilibrium and kinetics of each individual interaction involved in this multi-step process, which allowed us to model and optimize the relative concentrations and the time intervals of the assay.

1. Introduction

MicroRNAs (miRNAs) are small noncoding RNAs single strands of about 22 nucleotides, present in cells or circulating in body fluids. They act as post-transcriptional gene regulators by pairing to mRNA targets and inhibiting their translation or triggering their degradation [1]. Dysregulation of miRNAs has been associated to several human diseases, but their variable distribution and low concentration, estimated in plasma or serum in the fM to pM scale [2,3], make their detection and quantification challenging.
Current methods, like real time-PCR and microarrays, require a suitably furnished laboratory and numerous steps, which lead to high costs and long time-to-result, which limit their application to clinical practice and point-of-care devices; optical and electrochemical biosensors may offer an alternative strategy for rapid, multiplexed, and low-cost quantification [4,5].
Here we report a one-pot assay for the detection and quantification of miRNAs down to sub-pM concentrations, based on the signal measured by a recent optical biosensor, Reflective Phantom Interface (RPI) [6,7]. The capture of miRNA by surface-grafted complementary DNA oligomers is followed by a two-step mass amplification by specific antibodies (Ab1) binding the DNA–RNA hybrids on the surface [8,9] and by secondary antibodies (Ab2) further increasing the surface mass by decorating the first antibody. The design and optimization of the assay was made possible by the label-free capabilities of RPI, which provides access to kinetics and strength of each biomolecular interaction involved (DNA–RNA, antibody-nucleic acids, and antibody–antibody) [10,11,12].

2. Materials and Methods

We studied the various interactions through the RPI label-free biosensor, as described in [7]. Amine-terminated DNA probe strands complementary to five different miRNA sequences were covalently immobilized in spots on the surface of RPI sensing chips, previously coated with MCP4 copolymer purchased (Lucidant Polymers, Sunnyvale, CA, USA). The miRNAs used in this work, purchased from Integrated DNA Technologies (Leuven, Belgium), are listed in Table 1.
The miRNA sequences were chosen as representative examples of circulating miRNAs with known association to disease states like various human cancers and multiple sclerosis [2,3,13]. As Ab1 antibody targeting the DNA–RNA hybrid, we used the S9.6 antibody, purchased from Merck-Millipore (Burlington, MA, USA). The Ab2 antibody anti-antibody was purchased from Invitrogen (Carlsbad, CA, USA). Before the measurement, the sensor cartridges were filled with 1.3 mL of measuring buffer (10 mM Tris-HCl, pH 7.5, 50 mM NaCl, 10 mM MgCl2).
The RPI measurements were performed by using the method, the apparatus, and the analysis described in [7]. The sensing cartridge was kept at 25 °C by a thermalized holder under stirring during the measurement. Sample spikes of miRNAs, primary antibody, or secondary antibody were performed by adding 50 μL of measuring buffer containing different amounts of such molecules. From the analysis of the time sequences of RPI images of the spotted surface, the brightness of the spots was converted into mass surface density of molecular compounds as a function of time t, σ(t), by a custom Matlab program (Mathworks, Natick, MA, USA). The analysis was performed on averaged binding curves σ(t) of at least 6 spots with identical composition. From the binding curves at different concentrations of target molecules, the kinetic rates for association, kon, and dissociation, koff, and the dissociation equilibrium constant, Kd = koff/kon, were obtained [7].

3. Results

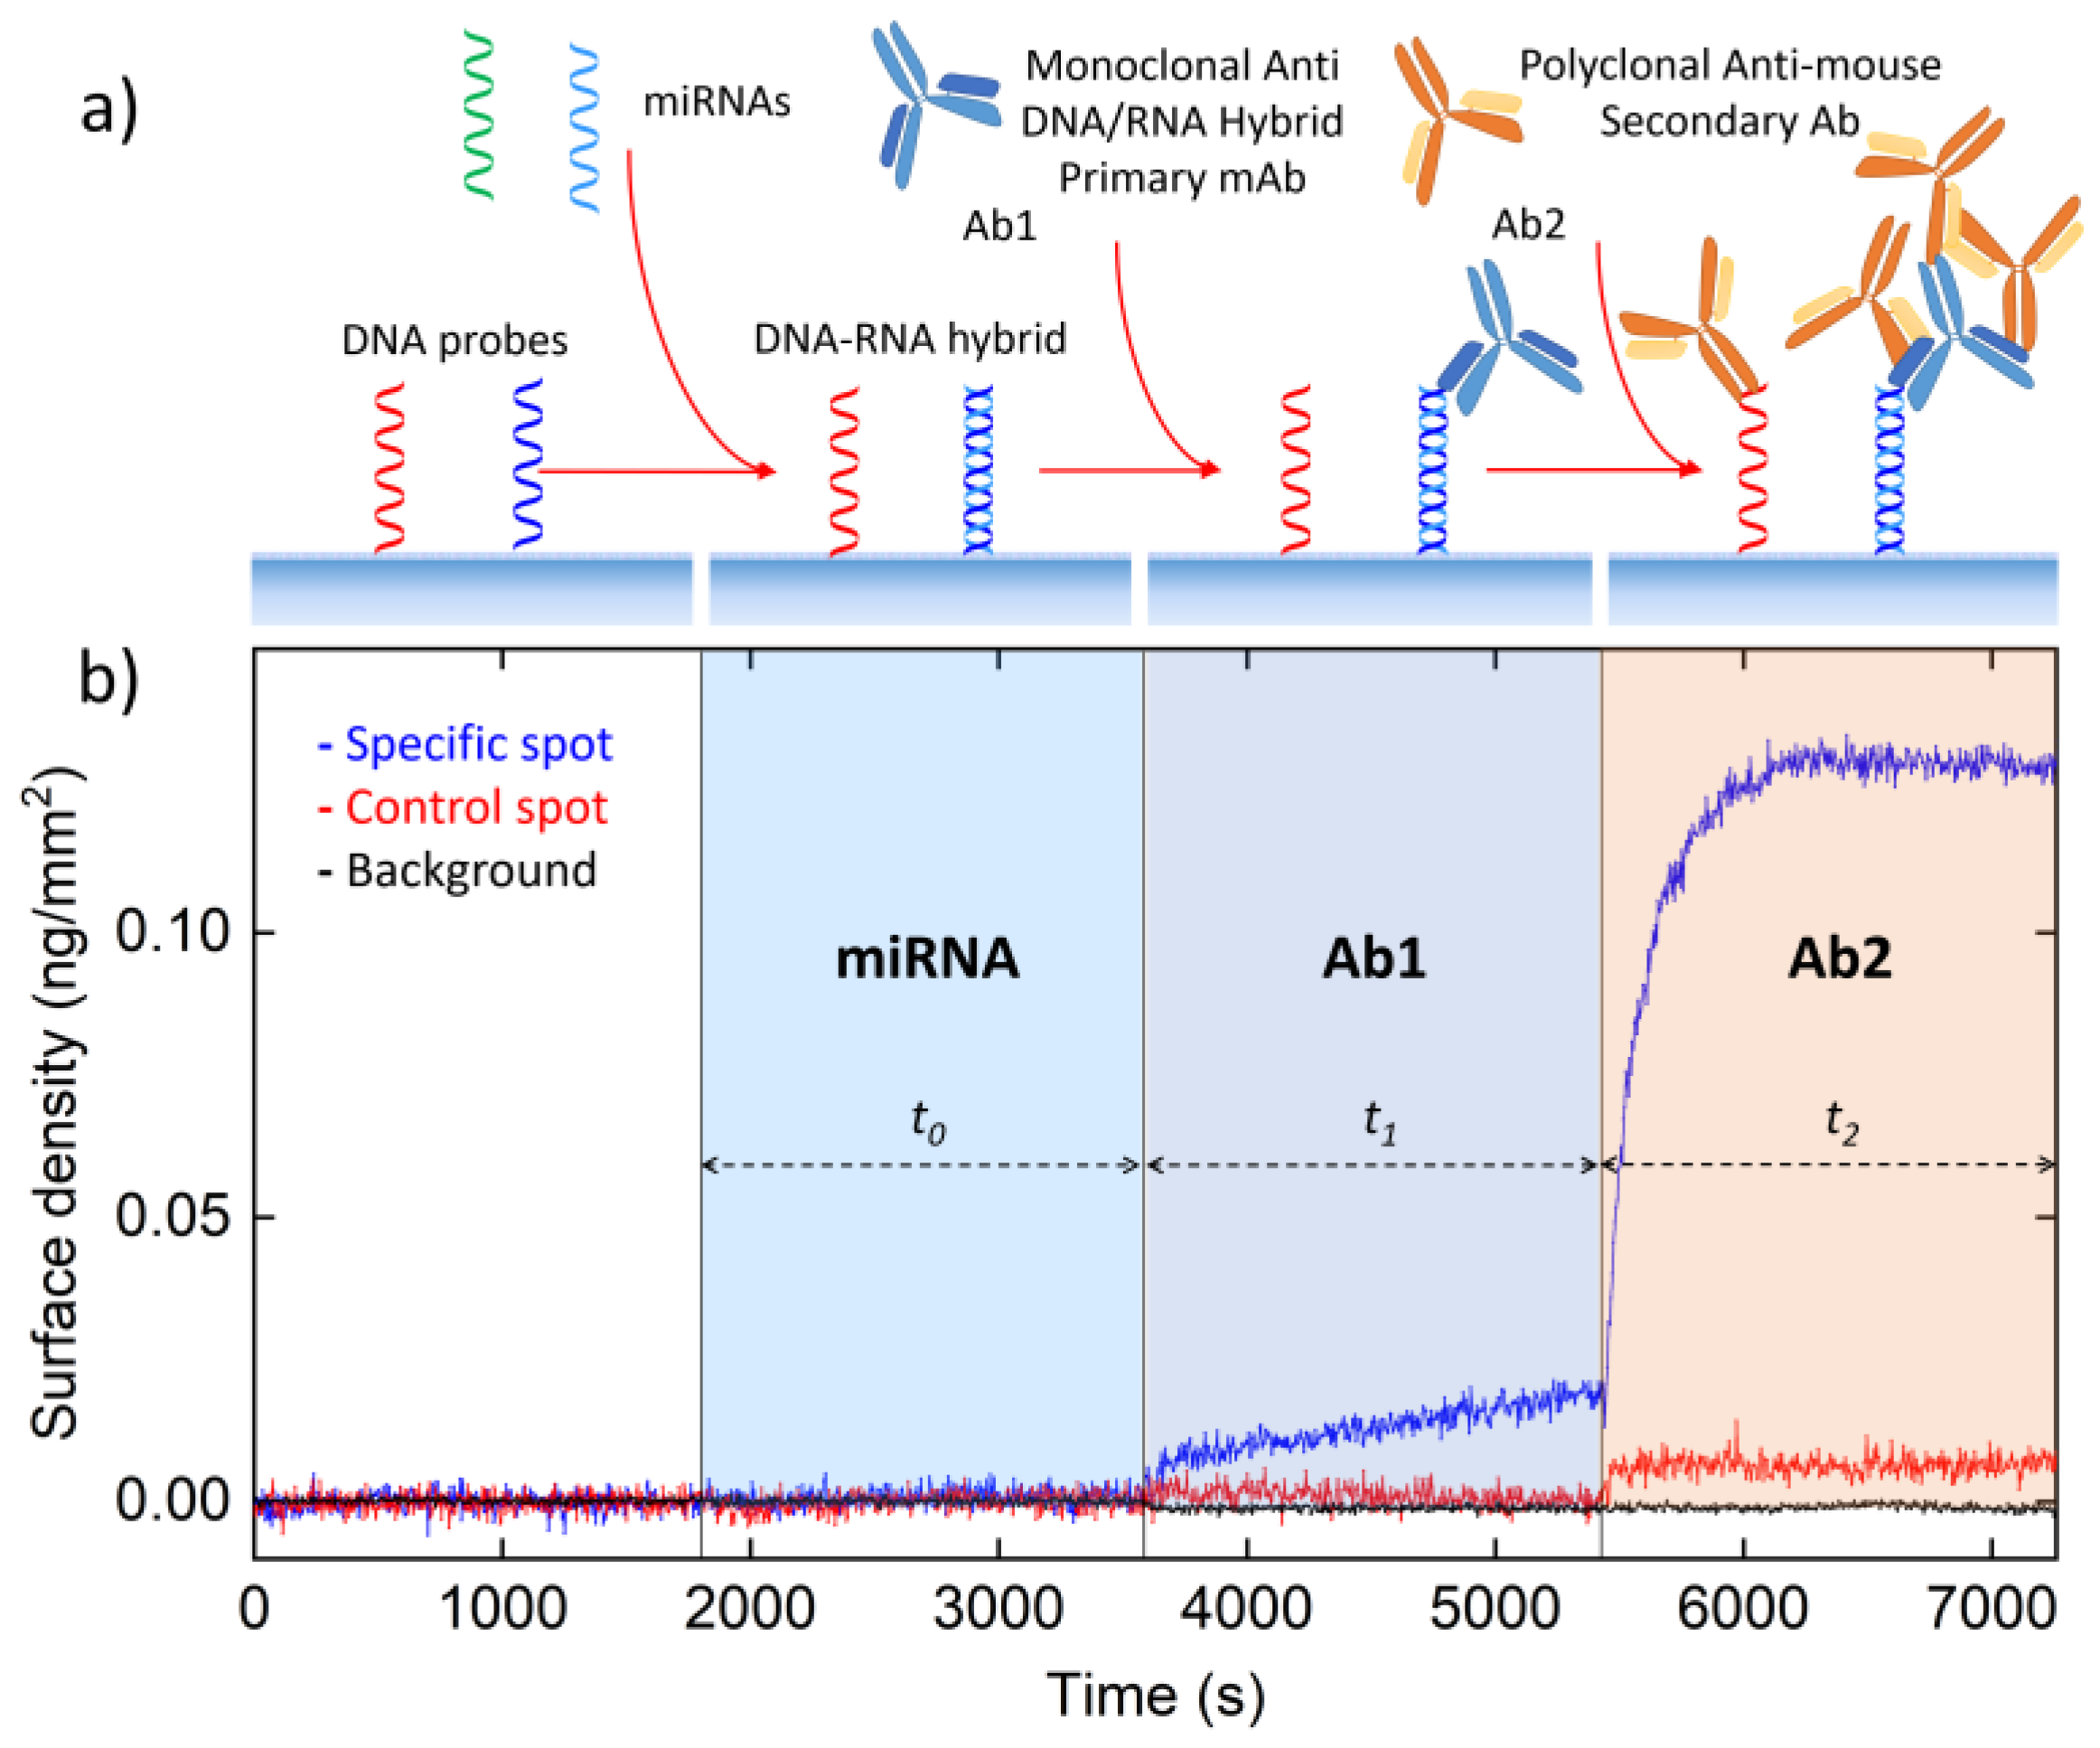
3.1. Design of the Assay

We designed a three-stage assay, corresponding to the addition in the same measuring solution of miRNA samples, primary antibody Ab1 targeting the DNA/RNA hybrid, and secondary antibody Ab2 targeting Ab1, respectively. The assay design is schematically shown in Figure 1a.
The miRNA strands in solution form hybrids with the complementary DNA probes on the RPI surface. The binding of Ab1 to the hybrid on the surface not only enhances the label-free signal because of the larger molecular mass, but also provides multiple binding sites for the secondary antibodies Ab2. The concentrations of Ab1, c1, and Ab2, c2, and the measuring times were chosen in order to realize a one-pot assay, hence avoiding time-consuming and operator-dependent washing steps: The samples and the antibodies are sequentially added in the same solution at defined times. Figure 1b reports the surface density of molecules measured by RPI label-free sensing during the procedure. The addition of a small amount of miRNA125, corresponding to a concentration in the measuring solution of 5 pM, yields a very low signal, lower than the Limit of Detection (LOD), on spots of complementary DNA125 probe. In contrast, upon the addition of Ab1 after a time t0, the signal markedly increases only on the DNA125 probe spots, confirming the presence of DNA/RNA hybrids. The further addition of Ab2 after an incubation time t1 for Ab1 provides a much larger signal due to the multiple binding of secondary antibodies on Ab1 on the surface. As shown in the figure, the measured signal remains negligible on DNA spots with non-complementary sequence and on the background regions outside the DNA spots.
The performance of detection and the optimal choice of the assay parameters depend on the strength and kinetics of the interactions involved in the three stages. The RPI label-free detection method provides both a suitable platform to implement the final assay as well as an analytical tool to fully characterize each binding step [14]. The extracted values of Kd, kon and koff are reported in Table 2, together with the maximum amplification factor expected from the molecular masses of the different species (the actual values are lower, as a consequence of crowding at the surface and a best compromise with short duration of the assay).

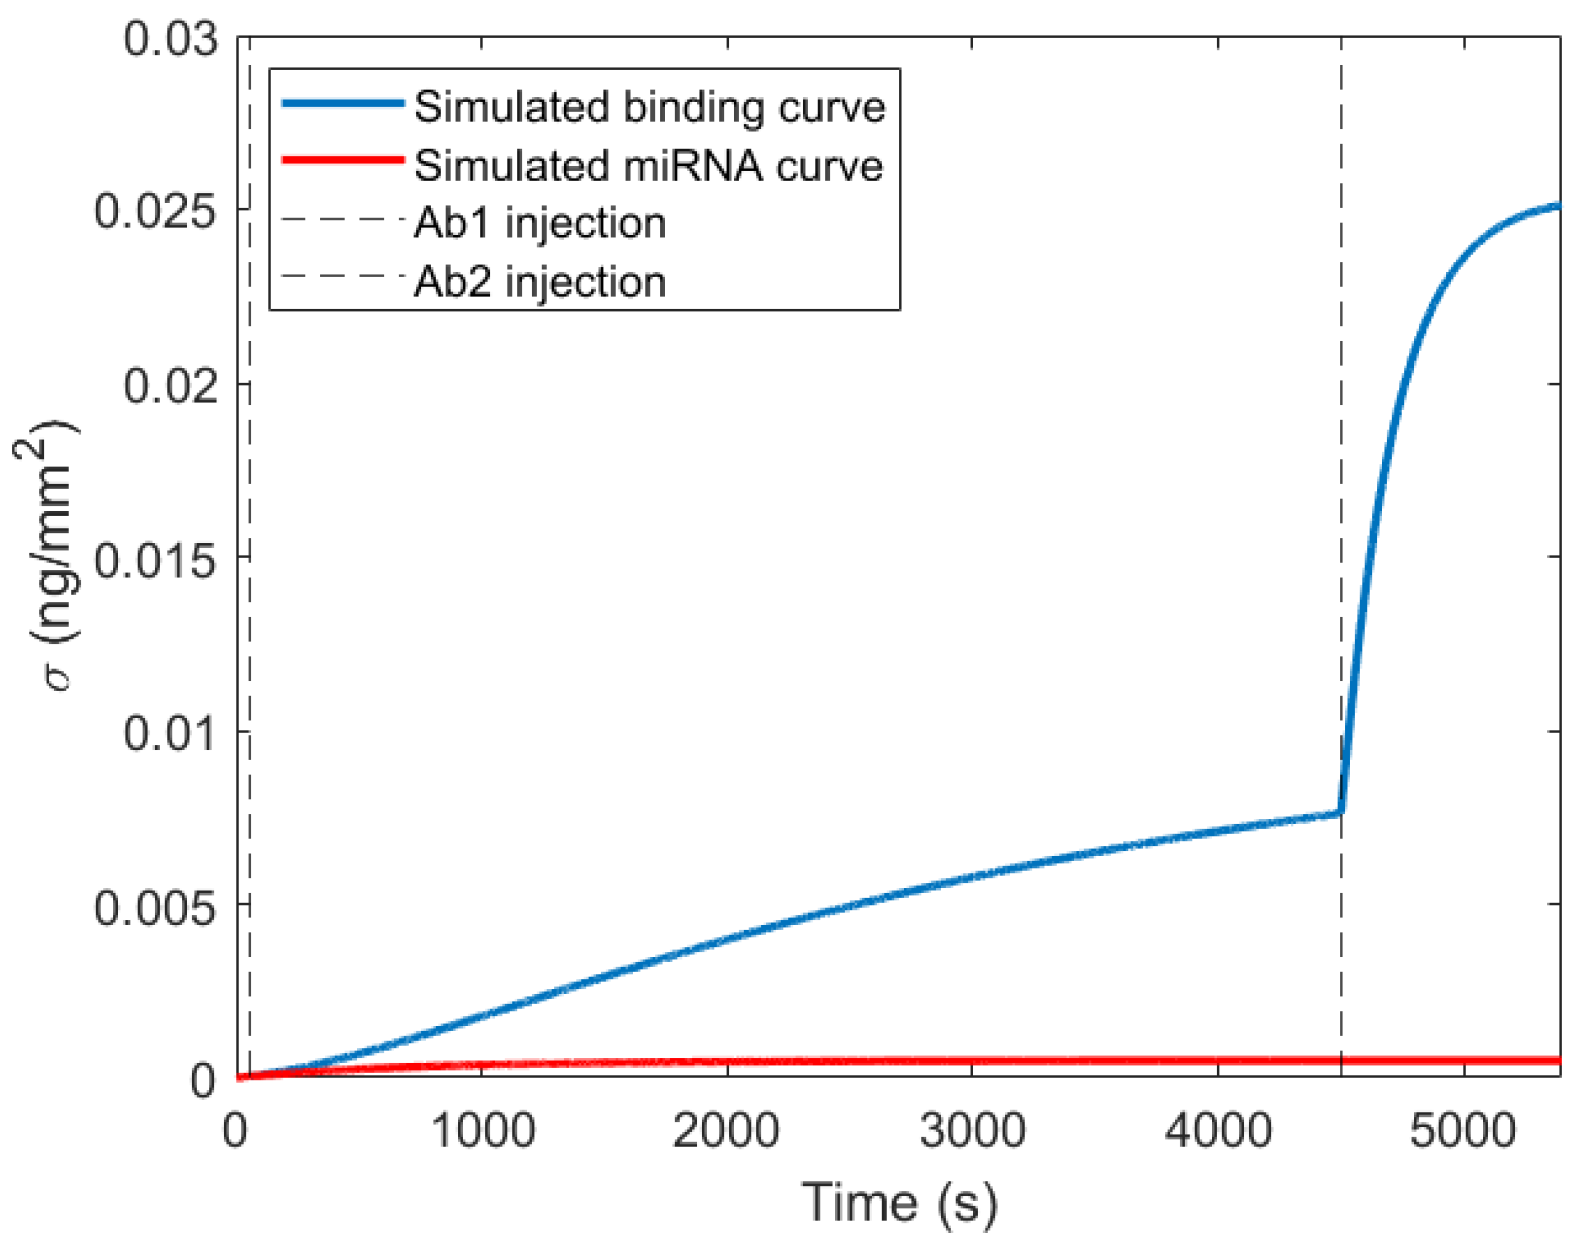
3.2. Modelling of Assay Performance

The difference in kon among the various miRNA (Table 2) results in different LOD. Indeed, when aiming at detecting concentrations much smaller than Kd in a limited observation time, the resulting binding curve is only given by its initial linear growth in time, whose slope is proportional to kon. Therefore, given a similar surface density of DNA probes, for each miRNA, the LODs will be simply proportional to the measured kon, so that setting a threshold of a minimum detectable initial slope (or a maximum waiting time) leads to distinct smallest detectable concentrations. From the kinetic constants and the amplification factors reported in Table 2, we simulated the amount of surface bound miRNA, Ab1 and Ab2 at various concentrations and incubation times as obtained by a system of consecutive kinetic equations, reported in the Appendix A. We set the total duration of the assay t0 + t1 + t2 = 1.5 h and we looked for the conditions for maximum amplification factor, defined as the ratio between the signal of the complete assay, containing miRNA, Ab1, and Ab2 and that of miRNA alone, computed at different incubation times. We found that rather long incubation times t1 for Ab1 and short t0 and t2 lead to amplification factors larger than 30. In Figure 2, we report the simulated signal for such conditions, namely t0 = 1 min, t1 = 74 min, t2 = 15 min.

3.3. Specificity

We verified the specificity of the assay by measuring the surface density due to Ab2 binding in absence of Ab1. We added in the measuring cartridge all the five miRNAs and then Ab2 at the working concentration of 25 nM. The measured surface density is reported in Figure 3. These results confirm that the sole contribution of non-specific binding of Ab2 on top of the DNA/RNA hybrid results in a surface density increment of about 4 pg/mm2, in agreement with the estimate of the total background level from the red curve in Figure 1b.

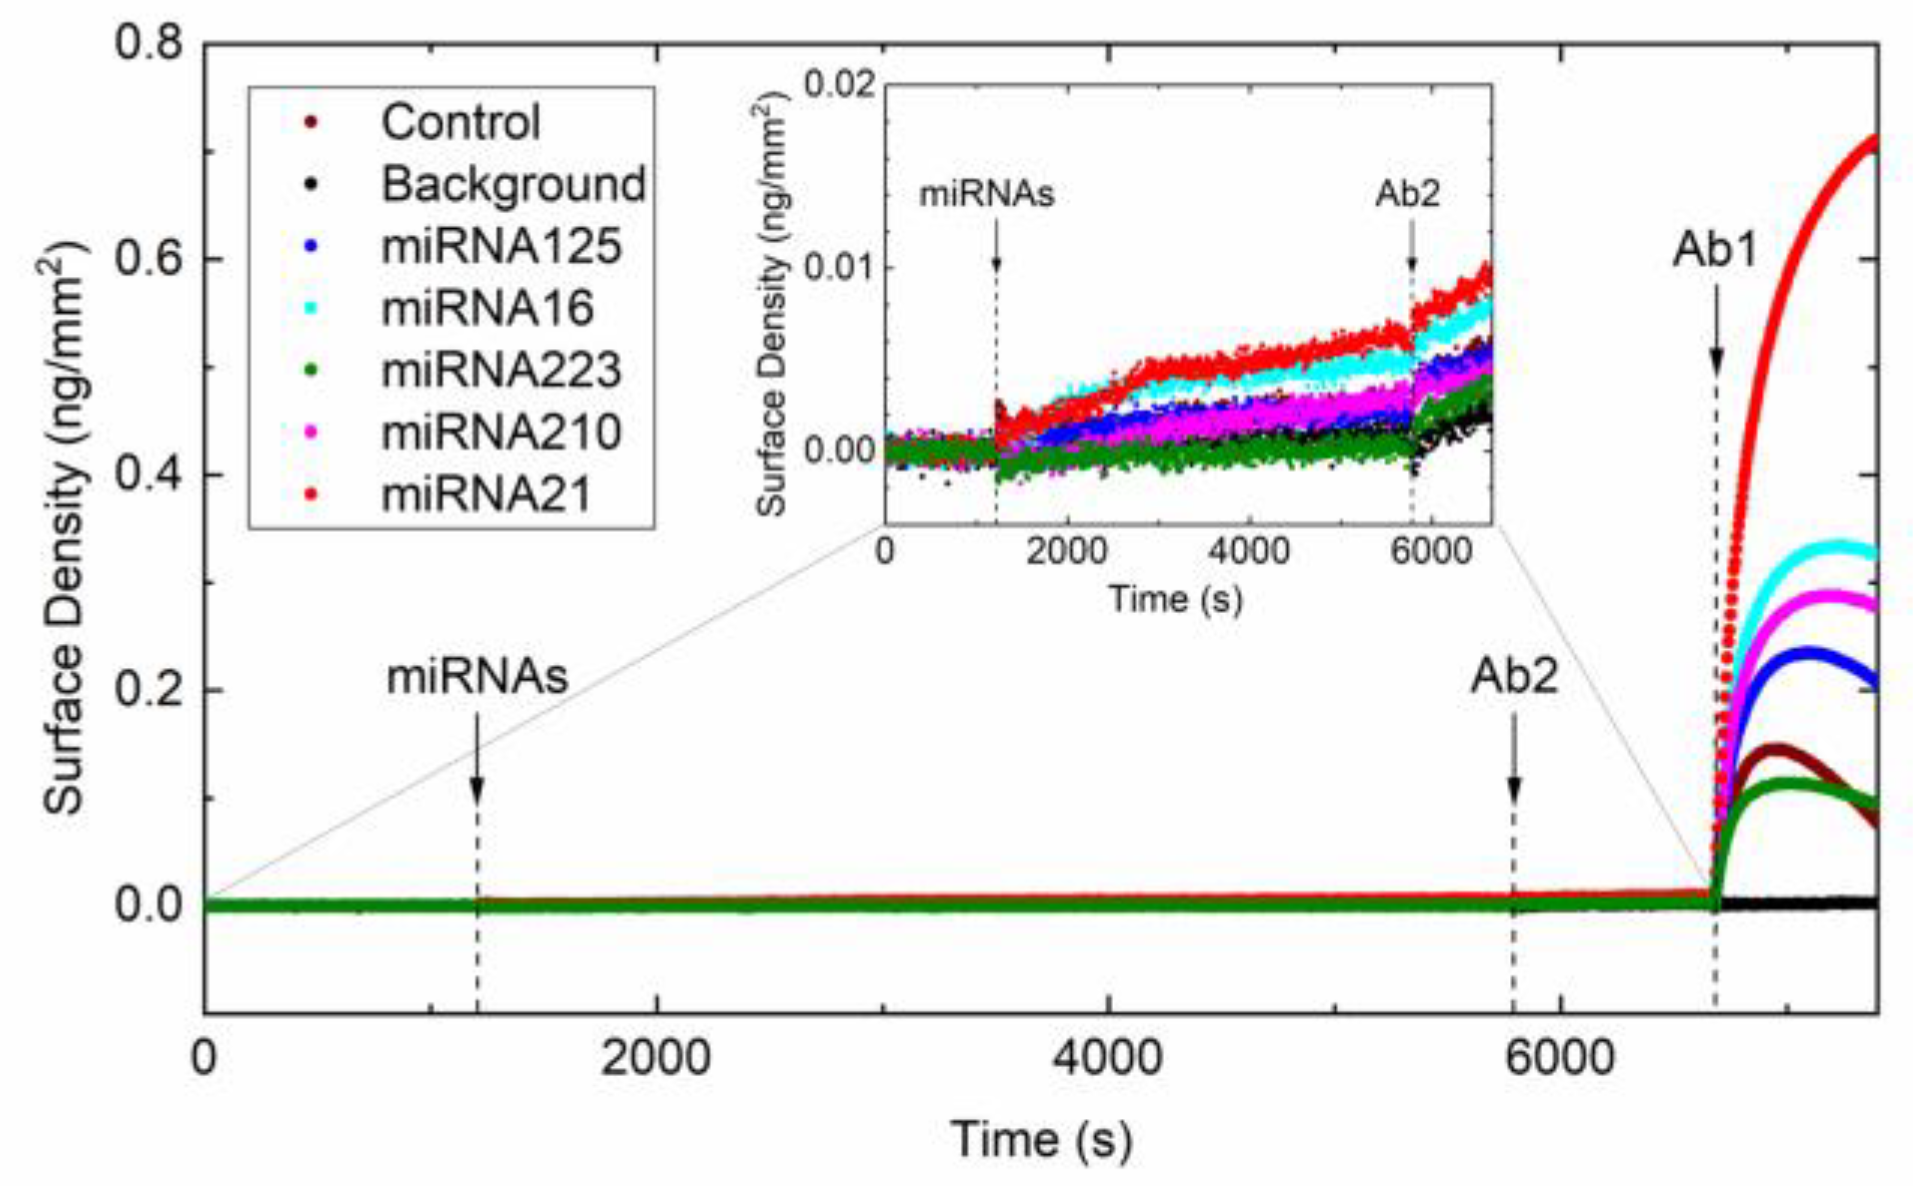
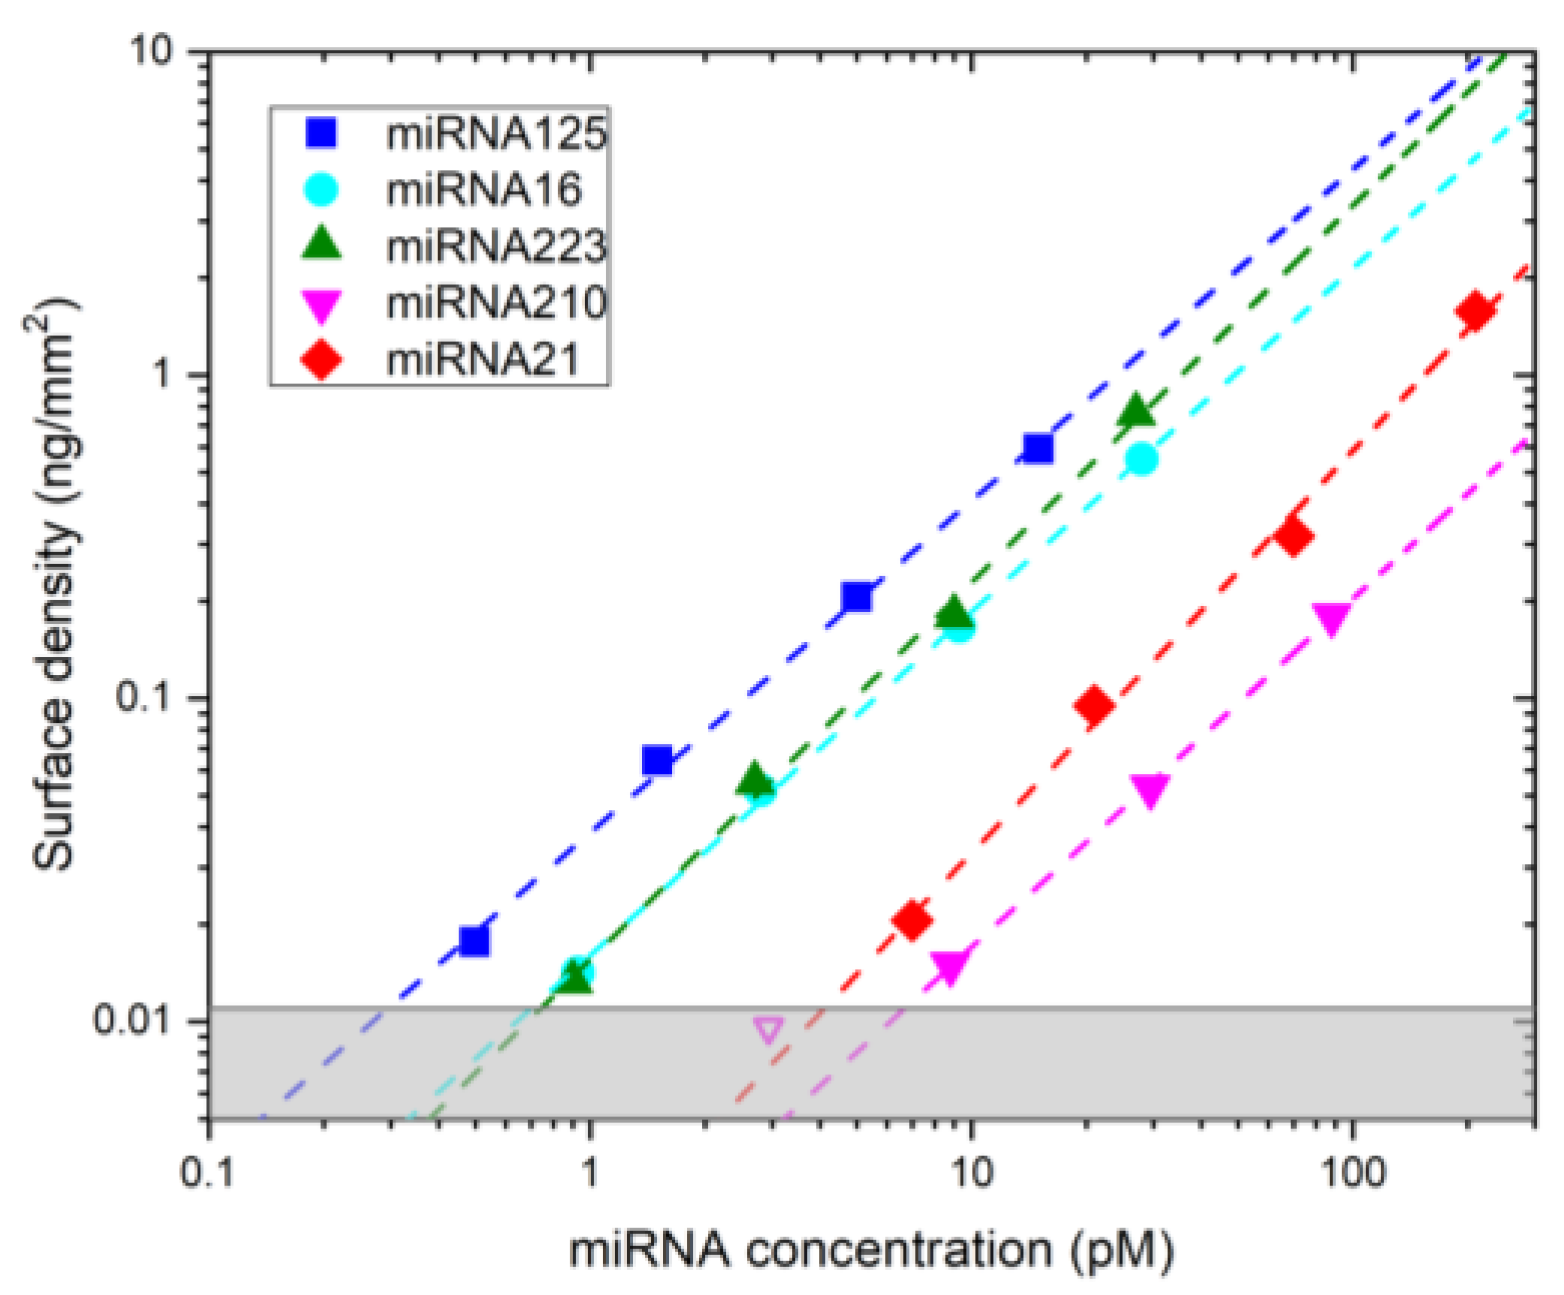
3.4. Experimental Validation

Finally, we experimentally studied the response of the assay, in the conditions identified by simulations as ideal, for different concentrations of miRNAs down to 0.5 pM. We spiked mixtures of the five miRNAs prepared with relative concentrations inversely proportional to the values of their kon for binding with the surface DNA probes. The results are reported in Figure 4, which demonstrates a linear response of the final Ab2 signal across almost two orders of magnitude of miRNA concentration, which enables to capture the 2- to 10-fold dysregulation reported in literature for several disease states [15,16]. We measured the background signal on control spots and computed the miRNA concentrations corresponding to 3σ above such background (grey region in Figure 4). The resulting LODs range from 0.3 pM for miRNA125 to 6.7 pM for miRNA210.

4. Discussion

The results in Figure 4 demonstrate that sub-picomolar detection and good dynamic range are achieved in a one-pot assay without enzyme- or nanoparticle-based amplification through a fine tuning of the assay parameters. Methods for miRNA extraction from plasma or other biological fluids typically result in rather clean samples suspended in buffer [17]; therefore, we anticipate similar performances of our assay when used with these samples. According to the literature, the sensitivity for miRNA quantification varies significantly depending on the detection approach [18]. LODs in the sub-picomolar range have so far been reported only for methods exploiting enzymatic enhancement or making use of gold nanoparticles to enhance the signal of label-free biosensors [9]. In contrast, non-enzymatic amplification methods achieved only by antibodies and proteins commonly display larger detection limits [19,20]. The better sensitivity of the method here presented is, for the most part, the outcome of having accessed all stages of the interactions and having undergone a quantitative optimization. Moreover, the proposed method only requires the addition of antibody reagents at established times after the addition of the miRNA sample. Therefore, the measuring procedure is simpler and more rapid than the standard methods currently in use, which typically require suitably furnished laboratory and specialized personnel.

Author Contributions

Conceptualization, G.Z., T.B., and M.B.; methodology, T.C., L.C., L.V., G.T., and C.M.; investigation, T.C. and L.C.; writing—original draft preparation, G.Z.; writing—review and editing, all authors; supervision, project administration, and funding acquisition, M.B. All authors have read and agreed to the published version of the manuscript.

Funding

This work has received funding from Regione Lombardia and FESR, through the NeOn project (ID 239047).

Acknowledgments

We thank ProXentia Srl (Milano, Italy) for providing the RPI sensing cartridges. We also thank Massimo Locati for useful discussions.

Conflicts of Interest

The authors declare no conflict of interest. The funders had no role in the design of the study; in the collection, analyses, or interpretation of data; in the writing of the manuscript, or in the decision to publish the results.

Appendix A

The number of molecules binding on the assay spots was simulated by numerically solving a system of three coupled differential equations and using the parameters from Table 2 (specifically, for RNA/DNA binding simulation, we considered kinetic parameters of miRNA21). Each equation describes binding of specific injected target, i.e., the formation of RNA/DNA hybrids, Ab1 binding on hybrids, and the formation of Ab1/Ab2 pairs on surface:
d ϕ 0 d t = k o n , 0 c 0 ( 1 ϕ 0 ( t ) ) k o f f , 0 ϕ 0 ( t ) ,
d ϕ 1 d t = k o n , 1 c 1 * ( ϕ 0 ( t ) ϕ 1 ( t ) ) k o f f , 1 ϕ 1 ( t ) .  
d ϕ 2 d t = k o n , 2 c 2 * ( ϕ 1 ( t ) ϕ 2 ( t ) ) k o f f , 2 ϕ 2 ( t )
wre indices 0, 1, 2 correspond to RNA-DNA (hybrid) binding, Ab1-hybrid binding, and Ab2-Ab1 binding, respectively. ϕ i corresponds to the fraction of occupied surface binding sites of the interaction i, kon,i and koff,i are the association and dissociation rate, respectively, and ci denotes the injected concentration of the corresponding analyte. Specifically, unlike RNA/DNA and Ab1-hybrid interactions, where binding occurs in stoichiometric ratio of 1, a single Ab1 contains n1 binding sites for Ab2, therefore, the surface amount of Ab2 is obtained as ϕ 2 times n1. Equations (1)–(3) neglect steric effects limiting the surface density of antibodies on the sensor surface and thus are valid for small values of ϕ 0, corresponding to small concentrations of miRNA in solution. Furthermore, because of the Ab1-Ab2 binding in solution, which also affects Ab1 and Ab2 binding at surface, their effective concentrations are lower. Corrected concentrations of both Ab1 and Ab2 are marked c 1 * and c 2 * , respectively. To convert from fractional surface coverage to mass surface density, solutions were further multiplied by the asymptotic values of surface density Σ, where Σ∞,0 was observed experimentally, and Σ∞,1 and Σ∞,2 were calculated considering mass and stoichiometric ratios. Given that a single hybrid binds a single Ab1, the maximum mass surface density of Ab1 that can bind to the hybrid is related to the bound miRNA via their mass ratio, i.e., Σ , 1 / Σ , 0 = m A b / m 0 . In contrast, Ab1 and Ab2 have roughly the same mass but about 7 Ab2 can bind a single Ab1, therefore the maximum Ab2 mass density is given by Σ∞,2 = n1 Σ∞,1.

References

  1. Dong, H.; Lei, J.; Ding, L.; Wen, Y.; Ju, H.; Zhang, X. MicroRNA: Function, Detection, and Bioanalysis. Chem. Rev. 2013, 113, 6207–6233. [Google Scholar] [CrossRef] [PubMed]
  2. Kim, D.J.; Linnstaedt, S.; Palma, J.; Park, J.C.; Ntrivalas, E.; Kwak-Kim, J.Y.H.; Gilman-Sachs, A.; Beaman, K.; Hastings, M.L.; Martin, J.N.; et al. Plasma Components Affect Accuracy of Circulating Cancer-Related MicroRNA Quantitation. J. Mol. Diagn. 2012, 14, 71–80. [Google Scholar] [CrossRef] [PubMed]
  3. Campomenosi, P.; Gini, E.; Noonan, D.M.; Poli, A.; D’Antona, P.; Rotolo, N.; Dominioni, L.; Imperatori, A. A Comparison between Quantitative PCR and Droplet Digital PCR Technologies for Circulating MicroRNA Quantification in Human Lung Cancer. BMC Biotechnol. 2016, 16, 60. [Google Scholar] [CrossRef] [PubMed]
  4. Johnson, B.N.; Mutharasan, R. Biosensor-Based MicroRNA Detection: Techniques, Design, Performance, and Challenges. Analyst 2014, 139, 1576. [Google Scholar] [CrossRef] [PubMed]
  5. Zanchetta, G.; Lanfranco, R.; Giavazzi, F.; Bellini, T.; Buscaglia, M. Emerging Applications of Label-Free Optical Biosensorsz. Nanophotonics 2017, 6. [Google Scholar] [CrossRef]
  6. Giavazzi, F.; Salina, M.; Cerbino, R.; Bassi, M.; Prosperi, D.; Ceccarello, E.; Damin, F.; Sola, L.; Rusnati, M.; Chiari, M.; et al. Multispot, Label-Free Biodetection at a Phantom Plastic-Water Interface. Proc. Natl. Acad. Sci. USA 2013, 110, 9350–9355. [Google Scholar] [CrossRef] [PubMed]
  7. Salina, M.; Giavazzi, F.; Lanfranco, R.; Ceccarello, E.; Sola, L.; Chiari, M.; Chini, B.; Cerbino, R.; Bellini, T.; Buscaglia, M. Multi-Spot, Label-Free Immunoassay on Reflectionless Glass. Biosens. Bioelectron. 2015, 74, 539–545. [Google Scholar] [CrossRef] [PubMed]
  8. Boguslawski, S.J.; Smith, D.E.; Michalak, M.A.; Mickelson, K.E.; Yehle, C.O.; Patterson, W.L.; Carrico, R.J. Characterization of Monoclonal Antibody to DNA · RNA and Its Application to Immunodetection of Hybrids. J. Immunol. Methods 1986, 89, 123–130. [Google Scholar] [CrossRef]
  9. Sguassero, A.; Artiga, Á.; Morasso, C.; Jimenez, R.R.; Rapún, R.M.; Mancuso, R.; Agostini, S.; Hernis, A.; Abols, A.; Linē, A.; et al. A Simple and Universal Enzyme-Free Approach for the Detection of Multiple MicroRNAs Using a Single Nanostructured Enhancer of Surface Plasmon Resonance Imaging. Anal. Bioanal. Chem. 2019, 411, 1873–1885. [Google Scholar] [CrossRef] [PubMed]
  10. Tagliabue, G.; Faoro, V.; Rizzo, S.; Sblattero, D.; Saccani, A.; Riccio, G.; Bellini, T.; Salina, M.; Buscaglia, M.; Marcello, A. A Label-Free Immunoassay for Flavivirus Detection by the Reflective Phantom Interface Technology. Biochem. Biophys. Res. Commun. 2017, 49, 558–564. [Google Scholar] [CrossRef] [PubMed]
  11. Nava, G.; Ceccarello, E.; Giavazzi, F.; Salina, M.; Damin, F.; Chiari, M.; Buscaglia, M.; Bellini, T.; Zanchetta, G. Label-Free Detection of DNA Single-Base Mismatches Using a Simple Reflectance-Based Optical Technique. Phys. Chem. Chem. Phys. 2016, 18, 13395–13402. [Google Scholar] [CrossRef] [PubMed]
  12. Vanjur, L.; Carzaniga, T.; Casiraghi, L.; Chiari, M.; Zanchetta, G.; Buscaglia, M. Non-Langmuir Kinetics of DNA Surface Hybridization. Biophys. J. 2020, 119, 989–1001. [Google Scholar] [CrossRef] [PubMed]
  13. miRBase. Available online: http://www.mirbase.org/ (accessed on 29 September 2020).
  14. Zanchetta, G.; Carzaniga, T.; Vanjur, L.; Casiraghi, L.; Tagliabue, G.; Morasso, C.; Bellini, T.; Buscaglia, M. Design of a Rapid, Multiplex, Homogeneous MiRNA Assay Optimized by Label-Free Analysis. Biosens. Bioelectron. 2021, 172, 112751. [Google Scholar] [CrossRef] [PubMed]
  15. Li, B.S.; Zhao, Y.L.; Guo, G.; Li, W.; Zhu, E.D.; Luo, X.; Mao, X.H.; Zou, Q.M.; Yu, P.W.; Zuo, Q.F.; et al. Plasma MicroRNAs, MiR-223, MiR-21 and MiR-218, as Novel Potential Biomarkers for Gastric Cancer Detection. PLoS ONE 2012, 7, e41629. [Google Scholar] [CrossRef] [PubMed]
  16. Maryam, M.; Chaleshtori, M.H.; Ghasemi, S.; Mokarian, F. Plasma Level of Mir-21 and Mir-451 in Primary and Recurrent Breast Cancer Patients. Breast Cancer Targets Ther. 2019, 11, 293–301. [Google Scholar] [CrossRef]
  17. Wright, K.; de Silva, K.; Purdie, A.C.; Plain, K.M. Comparison of Methods for MiRNA Isolation and Quantification from Ovine Plasma. Sci. Rep. 2020, 10, 1–11. [Google Scholar] [CrossRef] [PubMed]
  18. D’Agata, R.; Spoto, G. Advanced Methods for MicroRNA Biosensing: A Problem-Solving Perspective. Anal. Bioanal. Chem. 2019, 411, 4425–4444. [Google Scholar] [CrossRef] [PubMed]
  19. Šípová, H.; Zhang, S.; Dudley, A.M.; Galas, D.; Wang, K.; Homola, J. Surface Plasmon Resonance Biosensor for Rapid Label-Free Detection of Microribonucleic Acid at Subfemtomole Level. Anal. Chem. 2010, 82, 10110–10115. [Google Scholar] [CrossRef] [PubMed]
  20. Ding, X.; Yan, Y.; Li, S.; Zhang, Y.; Cheng, W.; Cheng, Q.; Ding, S. Surface Plasmon Resonance Biosensor for Highly Sensitive Detection of MicroRNA Based on DNA Super-Sandwich Assemblies and Streptavidin Signal Amplification. Anal. Chim. Acta 2015, 874, 59–65. [Google Scholar] [CrossRef] [PubMed]
Figure 1. Assay design and demonstration. (a) A sample containing the target miRNA is injected into the Reflective Phantom Interface (RPI) cartridge. The DNA probes immobilized on the surface of the RPI biosensor bind complementary miRNA in solution. After an incubation time t0, a monoclonal antibody (Ab1) targeting the DNA/RNA hybrid is added to the solution. Then, a secondary polyclonal antibody (Ab2) that binds to Ab1 is added after a time t1 and the measurement ends after an additional time t2. (b) Surface density measured by RPI on spots of DNA125 (blue) and DNA21 (red) upon addition of 5 pM of miRNA125, 2.5 nM of Ab1, and 25 nM of Ab2 at the times indicated by the vertical lines. The black points represent the background signal measured outside the spots area.
Proceedings 60 00032 g001
Figure 2. Simulated binding curve for t0 = 1 min, t1 = 74 min, t2 = 15 min. Dashed vertical lines represent the moment of injection of Ab1 and Ab2. Blue line is the simulated complete binding curve. Red line represents the miRNA binding. The amplification factor is obtained by dividing the final value of the blue line by the final value of the red line.
Proceedings 60 00032 g002
Figure 3. Non-specific binding of Ab2. Surface density measured by RPI upon sequential addition of miRNAs, Ab2, and Ab1 at the times indicated by the vertical lines. The concentrations of miRNAs in the measuring cartridge were 15 pM, 27.9 pM, 27 pM, 88 pM, and 209.7 pM for miRNA125, miRNA16, miRNA223, miRNA210, and miRNA21, respectively. The concentration of Ab2 and Ab1 were 25 nM and 4.5 nM, respectively. Colors correspond to different DNA probe spots, targeting the miRNAs indicated in the Figure legend. The black points represent the background signal measured outside the spots area. Inset: Enlarged view of the plot before the addition of Ab1.
Proceedings 60 00032 g003
Figure 4. Assay response measured by experiments. Maximum signal measured after the addition of Ab2 for different concentrations of the miRNAs. The assay parameters are t0 = 1 min, t1 = 74 min, t2 = 15 min, c1 = 4.5 nM and c2 = 25 nM. Dashed lines are fits with power law functions. The average exponent obtained from the fitting curve was 1.1 ± 0.09. The open magenta point was excluded from the fit. The shade grey area represents the signal values within 3σ from the background level measured on control spots.
Proceedings 60 00032 g004
Table 1. miRNA strands.
NameSequencent
miRNA21 (hsa-miR-21-5p)UAGCUUAUCAGACUGAUGUUGA22
miRNA223 (hsa-miR-223-3p)UGUCAGUUUGUCAAAUACCCCA22
miRNA16 (hsa-miR-16-5p)UAGCAGCACGUAAAUAUUGGCG22
miRNA125 (hsa-miR-125a-5p)UCCCUGAGACCCUUUAACCUGUGA24
miRNA210 (hsa-miR-210-3p)CUGUGCGUGUGACAGCGGCUGA22
Table 2. Interaction parameters measured by RPI.
TargetSurface ProbeKd(nM)koff(10−4 s−1)kon(104 M−1 s−1)Max Amplification
miRNA21DNA2111.61.41.21
miRNA223DNA2239.08.39.21
miRNA16DNA164.84.28.91
miRNA125DNA1252.64.316.51
miRNA210DNA2105.81.62.81
Ab1DNA-RNA0.270.27.421 ± 0.7
Ab2Ab118.010.515.6168 ± 6
Publisher’s Note: MDPI stays neutral with regard to jurisdictional claims in published maps and institutional affiliations.

