Proceeding Paper

Single Drop Detection of Furfural in Wine by an SPR-Optical Fiber-MIP Based Sensor †

1
Department of Chemistry, University of Pavia, Via Taramelli n.12, 27100 Pavia, Italy
2
Department of Engineering, University of Campania Luigi Vanvitelli, Via Roma n.29, 81031 Aversa, Italy
3
Ricerca sul Sistema Energetico—RSE S.p.A.—Via R. Rubattino n.54, 20134 Milano, Italy
*
Author to whom correspondence should be addressed.
Presented at the 1st International Electronic Conference on Biosensors, 2–17 November 2020; Available online: https://iecb2020.sciforum.net/.
Proceedings 2020, 60(1), 22; https://doi.org/10.3390/IECB2020-07028
Published: 2 November 2020
(This article belongs to the Proceedings of The 1st International Electronic Conference on Biosensors)

Abstract

:
A surface plasmon resonance (SPR) platform, based on a D-shaped plastic optical fiber (POF), combined with a biomimetic receptor, i.e., a molecularly imprinted polymer (MIP), is proposed to detect 2-furaldheide (2-FAL) in fermented beverages such as wine. The determination of 2-FAL in food samples is becoming a very crucial task, on the one hand for its role in the flavor and on the other in relation to its toxic and carcinogenic effects on human beings. The proposed sensing device is easy to use and cheap; it has been tested successfully for the detection and quantification of substances of interest in different fields, such as health, the environment and industry. The possibility of performing single-drop measurements is a further favorable aspect for practical applications. As an example, the use of an SPR-MIP sensor for the analysis of 2-FAL in wine, in a concentration range useful for practical applications, is here described.

1. Introduction

Biosensors and chemical sensors in optical fibers have been shown to be able to play an important role in numerous application fields [1,2,3,4,5]; in particular, devices based on the surface plasmon resonance (SPR) phenomenon have shown good merits of low cost, high sensitivity, and small size [6,7,8,9,10,11].
The Kretschmann and Otto configurations are widely used in practice, but these sensor systems usually require bulky and expensive optical equipment. Incorporating optical fibers makes it possible to reduce the cost and dimensions of the SPR sensors, with the possibility of integrating the sensing platform with small optoelectronic devices (sources and detectors). For low-cost sensing systems, plastic optical fibers (POFs) are especially advantageous due to their excellent flexibility, easy manipulation, great numerical aperture, large diameter, and the fact that plastic is able to withstand smaller bend radii than glass.
The optical sensor system here proposed has been developed by our research group [12,13,14,15,16,17,18,19] and is based on a multilayer structure realized on a planar surface of exposed core POF, embedded in a resin block (D-shaped POF platform), with the molecularly imprinted polymer (MIP) receptor for2-furaldheide (2-FAL) detection deposited on the gold film.
This optical sensing platform has been exploited in several applications, employing different kinds of receptors, such as antibodies, aptamers, molecularly imprinted polymers (MIPs), and also metal ligands—for example, hydroxamate siderophore deferoxamine for iron(III) and D,L-penicillamine for copper(II) detection [12,13,14,15,16,17,18,19].
This work aims to test the possibility of using an SPR-MIP sensor (i.e., exploiting an MIP receptor specific for 2-FAL combined with an SPR-POF platform) for determining the concentration of 2-FAL in water solutions for food safety control. Wine has been considered an interesting matrix since 2-FAL detection in wine is becoming a crucial task, not only for its relevance in affecting the flavor and aroma [20] but also for its toxic and carcinogenic effects on human beings.

2. Methods

The preparation of the SPR-POF optical platform has been widely described [12,14,17]. It is based on a multimode POF (0.96 mm diameter) embedded at the surface of a resin holder (1x1 cm). It presents a characteristic D-shaped sensing region obtained by erasing the cladding and, partially, the core of the POF, with a polishing process. A multilayer structure is built up over the exposed POF core, with a buffer layer (a photoresist of high refractive index, 1.5 μm thick), a thin metal film (gold, 60 nm thick) and, finally, a MIP layer as a specific chemical receptor for 2-FAL detection. The sensing region is 1 cm long. The flat shape makes it possible to perform the measurement in a drop deposited over the flat sensing region. As reported in Figure 1, the measurement apparatus consists of a halogen lamp (HL–2000–LL, Ocean Optics) illuminating the sensor and a spectrometer connected to a PC (USB2000+UV–VIS spectrometer, Ocean Optics) [12,13].
The MIP was prepared in situ, dropping over the gold layer a small volume of the MIP prepolymeric mixture, spinning and polymerizing in an oven. The prepolymeric mixture, prepared according to the procedure reported in [17], was composed of the reagents at molar ratio 1 (2-FAL):4 (MAA):40 (DVB), as reported in [17]. Divinylbenzene (DVB), the cross-linker, was also the solvent in which the functional monomer (that is, methacrylic acid, MAA) and the template, 2-FAL, are dispersed. DVB is at the same time the cross-linker and the solvent, being a liquid present in large excess. The mixture was uniformly dispersed by sonication and de-aerated with nitrogen for 10 min. Then, the radical initiator AIBN (16 mg for 700 μl of DVB) was added to the mixture. Approximately 50 μL of the MIP prepolymeric mixture was dropped onto the SPR sensing region and spun for 2 min at 1000 rpm. Then, thermal polymerization was carried out for 16 h at 80 °C. Finally, the template was removed by repeated washings with 96% ethanol. This device is named SPR-MIP sensor. Figure 1 shows the optical-chemical sensor system.
To perform the measurements, the platform was fixed in a mini holder which was purposely designed to keep the sensing surface in a flat. A drop of sample (50 µL) was deposited over the flat part of the sensor and allowed to equilibrate for 5 minutes. During the equilibration, the drop over the surface maintains its shape, due to the hydrophobic nature of the MIP, since the polymer is mainly constituted by DVB. This makes the measurement in a drop possible.
The variation in the resonance wavelength with respect to the resonance wavelength of the blank solution not containing 2-FAL was the recorded analytical parameter.
The sample used for the characterization was an artificial wine with a refractive index near to that of natural white wines (1.339–1.346) and not containing furanic aldehydes.

3. Results and Discussion

The standardization curves were obtained by plotting the variation in the resonance wavelength ( Δ λ) in function of the concentration of 2-FAL. The curves were modeled by an equation similar to the Hill equation, derived from the Langmuir adsorption isotherm [19]:
Δ λ = k   g   c i n t K a f f [ A ] 1 + K a f f [ A ] = Δ λ m a x K a f f [ A ] 1 + K a f f [ A ]
Kaff is the affinity constant of 2-FAL for the MIP, cint is the concentration of the specific sites obtained by the molecular imprinting, g is the mass of polymer. Δ λmax = k g cint is the maximum resonance wavelength shift ( Δ λ) obtained at high concentration of analyte. The concentration of the analyte in the sample [A] is equal to the total concentration (cA), i.e., the concentration of the analyte adsorbed is negligible with respect to the total concentration, [A] = cA.
The evaluation of the parameters of the standardization equation is carried out by the software Solver, present in Excel. Once these parameters are known, the concentration of the analyte giving Δ λ as signal can be evaluated in the whole detection range.
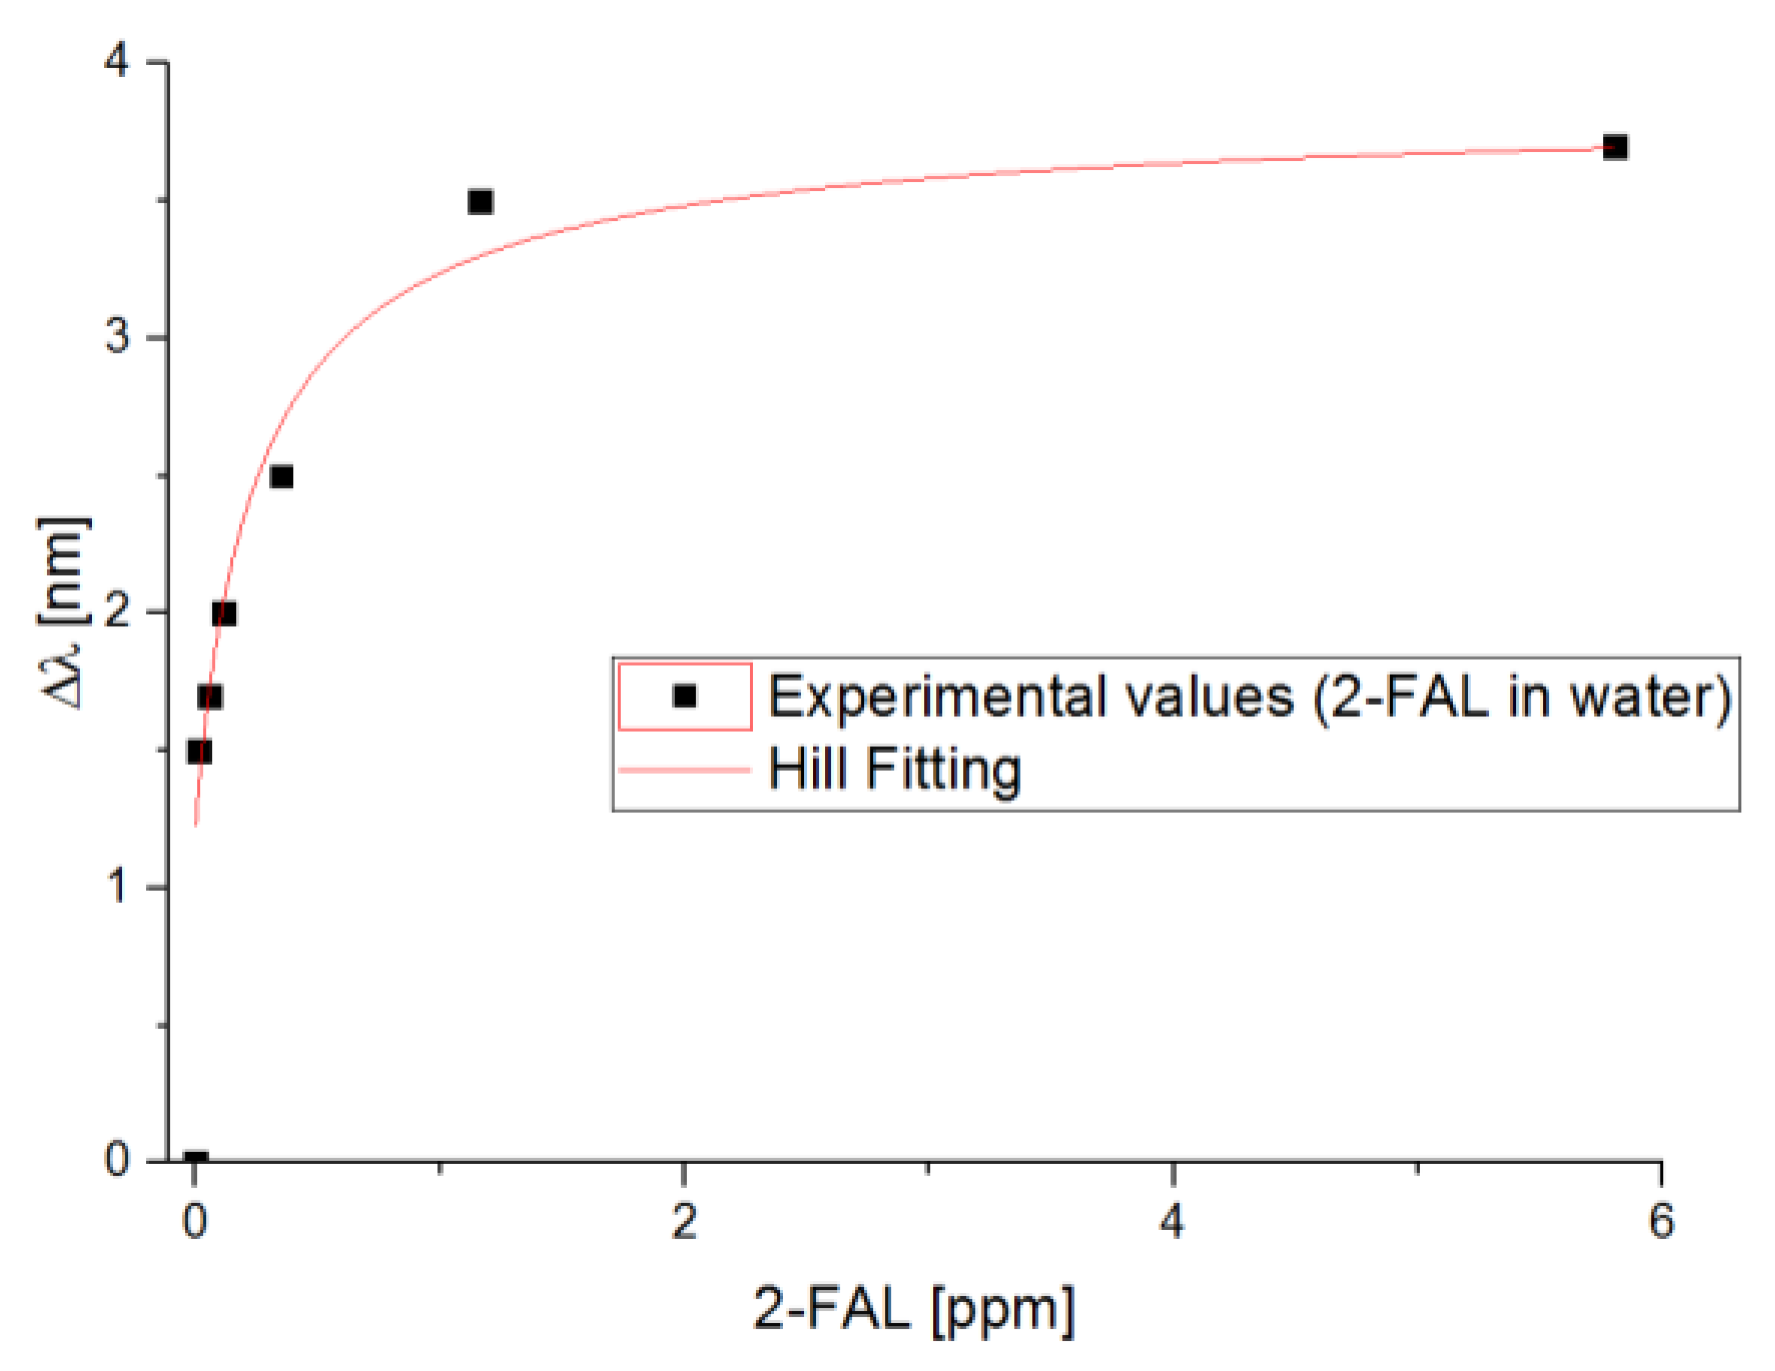
The refractive index (RI) of the dielectric layer over gold depends on the amount of 2-FAL in the MIP layer and so on the concentration in the solution. Thus, the resonance wavelength variation ( Δ λ) in function of the analyte concentration is exploited for analytical purposes. In the case of water as the sample matrix, when the 2-FAL concentration increases, the SPR wavelength is shifted to higher values, as reported in Figure 2. The wavelength variation versus the analyte concentration is well fitted by Equation (1), as expected when the sorption takes place according to the Langmuir model, with a constant response ( Δ λmax) for concentrations higher than 1 mg/L, corresponding to the saturation of the receptor. The parameters, evaluated by the non-linear regression method, are affinity constant, Kaff, 9.4 L/mg (9.0 × 10⁵ M−1), Δ λmax, 3.3 nm, sensitivity at low concentration, 31.6 nm/(mg/L). The limit of detection (LOD) in water was 0.03 mg/L.
In the considered artificial wine, the resonance wavelength is shifted to higher values with respect to that in water. This effect could be due in part to the different refractive index of the wine, but it is probably mainly due to the different acidity and composition, particularly in the presence of alcohol, sugars, and organic acids. The dose-response curve obtained in artificial wine gave the following parameters: Kaff = 75.6 L/mg (7.2 × 10⁶ M−1), Δ λmax = 3.3 nm, sensitivity at low concentration 254.9 nm/(mg/L), LOD = 0.004 mg/L.

4. Conclusions

It has been found that the “wine” matrix has a large effect on the SPR signal. In this matrix, λris is red-shifted compared to that in water. The response of the SPR-MIP sensor to 2-FAL is different in water and in the artificial wine, with a better sensitivity and lower detection limit in artificial wine. The affinity constant is very high both in water and in artificial wine. However the constant is one magnitude order higher in wine than in water. It is mainly for this reason that the LOD is lower in this matrix, with a detection range which is suitable for the determination of 2-FAL in wine.
The sensor here proposed can have a high practical interest on one hand for the possible toxic and carcinogenic effects of furanic aldehydes, particularly of the 2-FAL, on human beings and, on the other hand, for their impact on the aroma.

References

  1. Wang, X.D.; Wolfbeis, O.S. Fiber-Optic Chemical Sensors and Biosensors (2013–2015). Anal. Chem. 2016, 88, 203–227. [Google Scholar] [CrossRef] [PubMed]
  2. Leung, A.; Shankar, P.M.; Mutharasan, R. A review of fiber-optic biosensors. Sens. Actuators B Chem. 2007, 125, 688–703. [Google Scholar] [CrossRef]
  3. Trouillet, A.; Ronot-Trioli, C.; Veillas, C.; Gagnaire, H. Chemical sensing by surface plasmon resonance in a multimode optical fibre. Pure Appl. Opt. 1996, 5, 227. [Google Scholar] [CrossRef]
  4. Wang, X.D.; Wolfbeis, O.S. Fiber-Optic Chemical Sensors and Biosensors (2008–2012). Anal Chem. 2013, 85, 487. [Google Scholar] [CrossRef] [PubMed]
  5. Monk, D.J.; Walt, D.R. Optical fiber-based biosensors. Anal. Bioanal. Chem. 2004, 379, 931–945. [Google Scholar] [CrossRef] [PubMed]
  6. Anuj, K.; Sharma, R.J.; Gupta, B.D. Fiber-optic sensors based on surface Plasmon resonance: A comprehensive review. IEEE Sens. J. 2007, 7, 1118. [Google Scholar]
  7. Gupta, B.D.; Verma, R.K. Surface plasmon resonance-based fiber optic sensors: Principle, probe designs, and some applications. J. Sens. 2009, 2009, 979761. [Google Scholar] [CrossRef]
  8. Wang, X.D.; Wolfbeis, O.S. Fiber-optic chemical sensors and biosensors (2013–2015). Anal. Chem. 2016, 88, 203–227. [Google Scholar] [CrossRef] [PubMed]
  9. Piliarik, M.; Homola, J.; Manikova, Z.; Čtyroký, J. Surface Plasmon Resonance Sensor Based on a Single-Mode Polarization-Maintaining Optical Fiber. Sens. Actuators B Chem. 2003, 90, 236–242. [Google Scholar] [CrossRef]
  10. Jorgenson, R.C.; Yee, S.S. A fiber-optic chemical sensor based on surface plasmon resonance. Sens. Actuators B Chem. 1993, 12, 213–220. [Google Scholar] [CrossRef]
  11. Homola, J. Present and future of surface plasmon resonance biosensors. Anal. Bioanal. Chem. 2003, 377, 528–539. [Google Scholar] [CrossRef] [PubMed]
  12. Cennamo, N.; D’Agostino, G.; Galatus, R.; Bibbò, L.; Pesavento, M.; Zeni, L. Sensors based on surface plasmon resonance in a plastic optical fiber for the detection of trinitrotoluene. Sens. Actuators B 2013, 188, 221–226. [Google Scholar] [CrossRef]
  13. Cennamo, N.; Varriale, A.; Pennacchio, A.; Staiano, M.; Massarotti, D.; Zeni, L.; D’Auria, S. An innovative plastic optical fiber-based biosensor for new bio/applications. The Case of Celiac Disease. Sens. Actuators B 2013, 176, 1008–1014. [Google Scholar] [CrossRef]
  14. Cennamo, N.; D’Agostino, G.; Pesavento, M.; Zeni, L. High selectivity and sensitivity sensor based on MIP and SPR in tapered plastic optical fibers for the detection of L-nicotine. Sens. Actuators B 2014, 191, 529–536. [Google Scholar] [CrossRef]
  15. Cennamo, N.; Di Giovanni, S.; Varriale, A.; Staiano, M.; Di Pietrantonio, F.; Notargiacomo, A.; Zeni, L.; D’Auria, S. Easy to use plastic optical fiber-based biosensor for detection of butanal. PLoS ONE 2015, 10, e0116770. [Google Scholar] [CrossRef] [PubMed]
  16. Cennamo, N.; Pesavento, M.; Lunelli, L.; Vanzetti, L.; Pederzolli, C.; Zeni, L.; Pasquardini, L. An easy way to realize SPR aptasensor: A multimode plastic optical fiber platform for cancer biomarkers detection. Talanta 2015, 140, 88–95. [Google Scholar] [CrossRef] [PubMed]
  17. Cennamo, N.; De Maria, L.; Chemelli, C.; Profumo, A.; Zeni, L.; Pesavento, M. Markers detection in transformer oil by plasmonic chemical sensor system based on POF and MIPs. IEEE Sens. J. 2016, 16, 7663–7670. [Google Scholar] [CrossRef]
  18. Cennamo, N.; Alberti, G.; Pesavento, M.; D’Agostino, G.; Quattrini, F.; Biesuz, R.; Zeni, L. A Simple Small Size and Low Cost Sensor Based on Surface Plasmon Resonance for Selective Detection of Fe(III). Sensors 2014, 14, 4657–4661. [Google Scholar] [CrossRef] [PubMed]
  19. Pesavento, M.; Profumo, A.; Merli, D.; Cucca, L.; Zeni, L.; Cennamo, N. An Optical Fiber Chemical Sensor for the Detection of Copper(II) in Drinking Water. Sensors 2019, 19, 5246. [Google Scholar] [CrossRef] [PubMed]
  20. Camara, J.S.; Alves, M.A.; Marques, J.C. Changes in volatile composition of Madeira wines during their oxidative ageing. Anal. Chim. Acta 2006, 563, 188–197. [Google Scholar] [CrossRef]
Figure 1. SPR-MIP sensor with the experimental setup.
Proceedings 60 00022 g001
Figure 2. SPR wavelength shift versus concentration of 2-FAL in aqueous solution. The red curve is the experimental data fitting by the Hill equation corresponding to Equation (1).
Proceedings 60 00022 g002
Publisher’s Note: MDPI stays neutral with regard to jurisdictional claims in published maps and institutional affiliations.