Research Usage and Social Impact of Crowdsourced Air Traffic Data †


OpenSky Network, 8008 Zurich, Switzerland
†
Presented at the 8th OpenSky Symposium 2020, Online, 12–13 November 2020.
Proceedings 2020, 59(1), 1; https://doi.org/10.3390/proceedings2020059001
Published: 1 December 2020
(This article belongs to the Proceedings of 8th OpenSky Symposium 2020)
Abstract
:Crowdsourced data have played an increasing role in research in the sciences over the past decades. From their early instantiations in the 1990s to the search for extraterrestrial intelligence, the concepts of crowdsourcing and citizen science have gained renewed popularity with the broad availability of big data systems. The OpenSky Network has been a poster child of the successful use of crowdsourced data in research and citizen science for many years, with more than 150 peer-reviewed publications using its data. In this article, we follow the efforts made and the results achieved by the OpenSky Network as a non-profit organization with the mission to advance research in and around aviation. We examine the backgrounds and typical usage patterns of OpenSky’s users, both academic and non-academic. We further look at the social impact of air traffic data, particularly during the COVID-19 crisis, and finally examine ways to improve some existing gaps in the data.
1. Introduction
In this paper, we analyze several aspects of OpenSky’s increasing popularity with the scientific and non-scientific research communities. As the available air traffic data have been growing over time and have increased global coverage, they have enabled more longitudinal and comparative studies. Additionally, unforeseen major events, such as the COVID-19 pandemic, have increased the demand for open air traffic data in fields outside of traditional, purely aviation-focused, research.
We analyze scientific publications in Section 2, database usage in Section 3, and users’ backgrounds in Section 4. In the second part, we examine the social and COVID-19-related impact in Section 5 and Section 6 before concluding with a discussion of potential improvements in Section 7.
Background
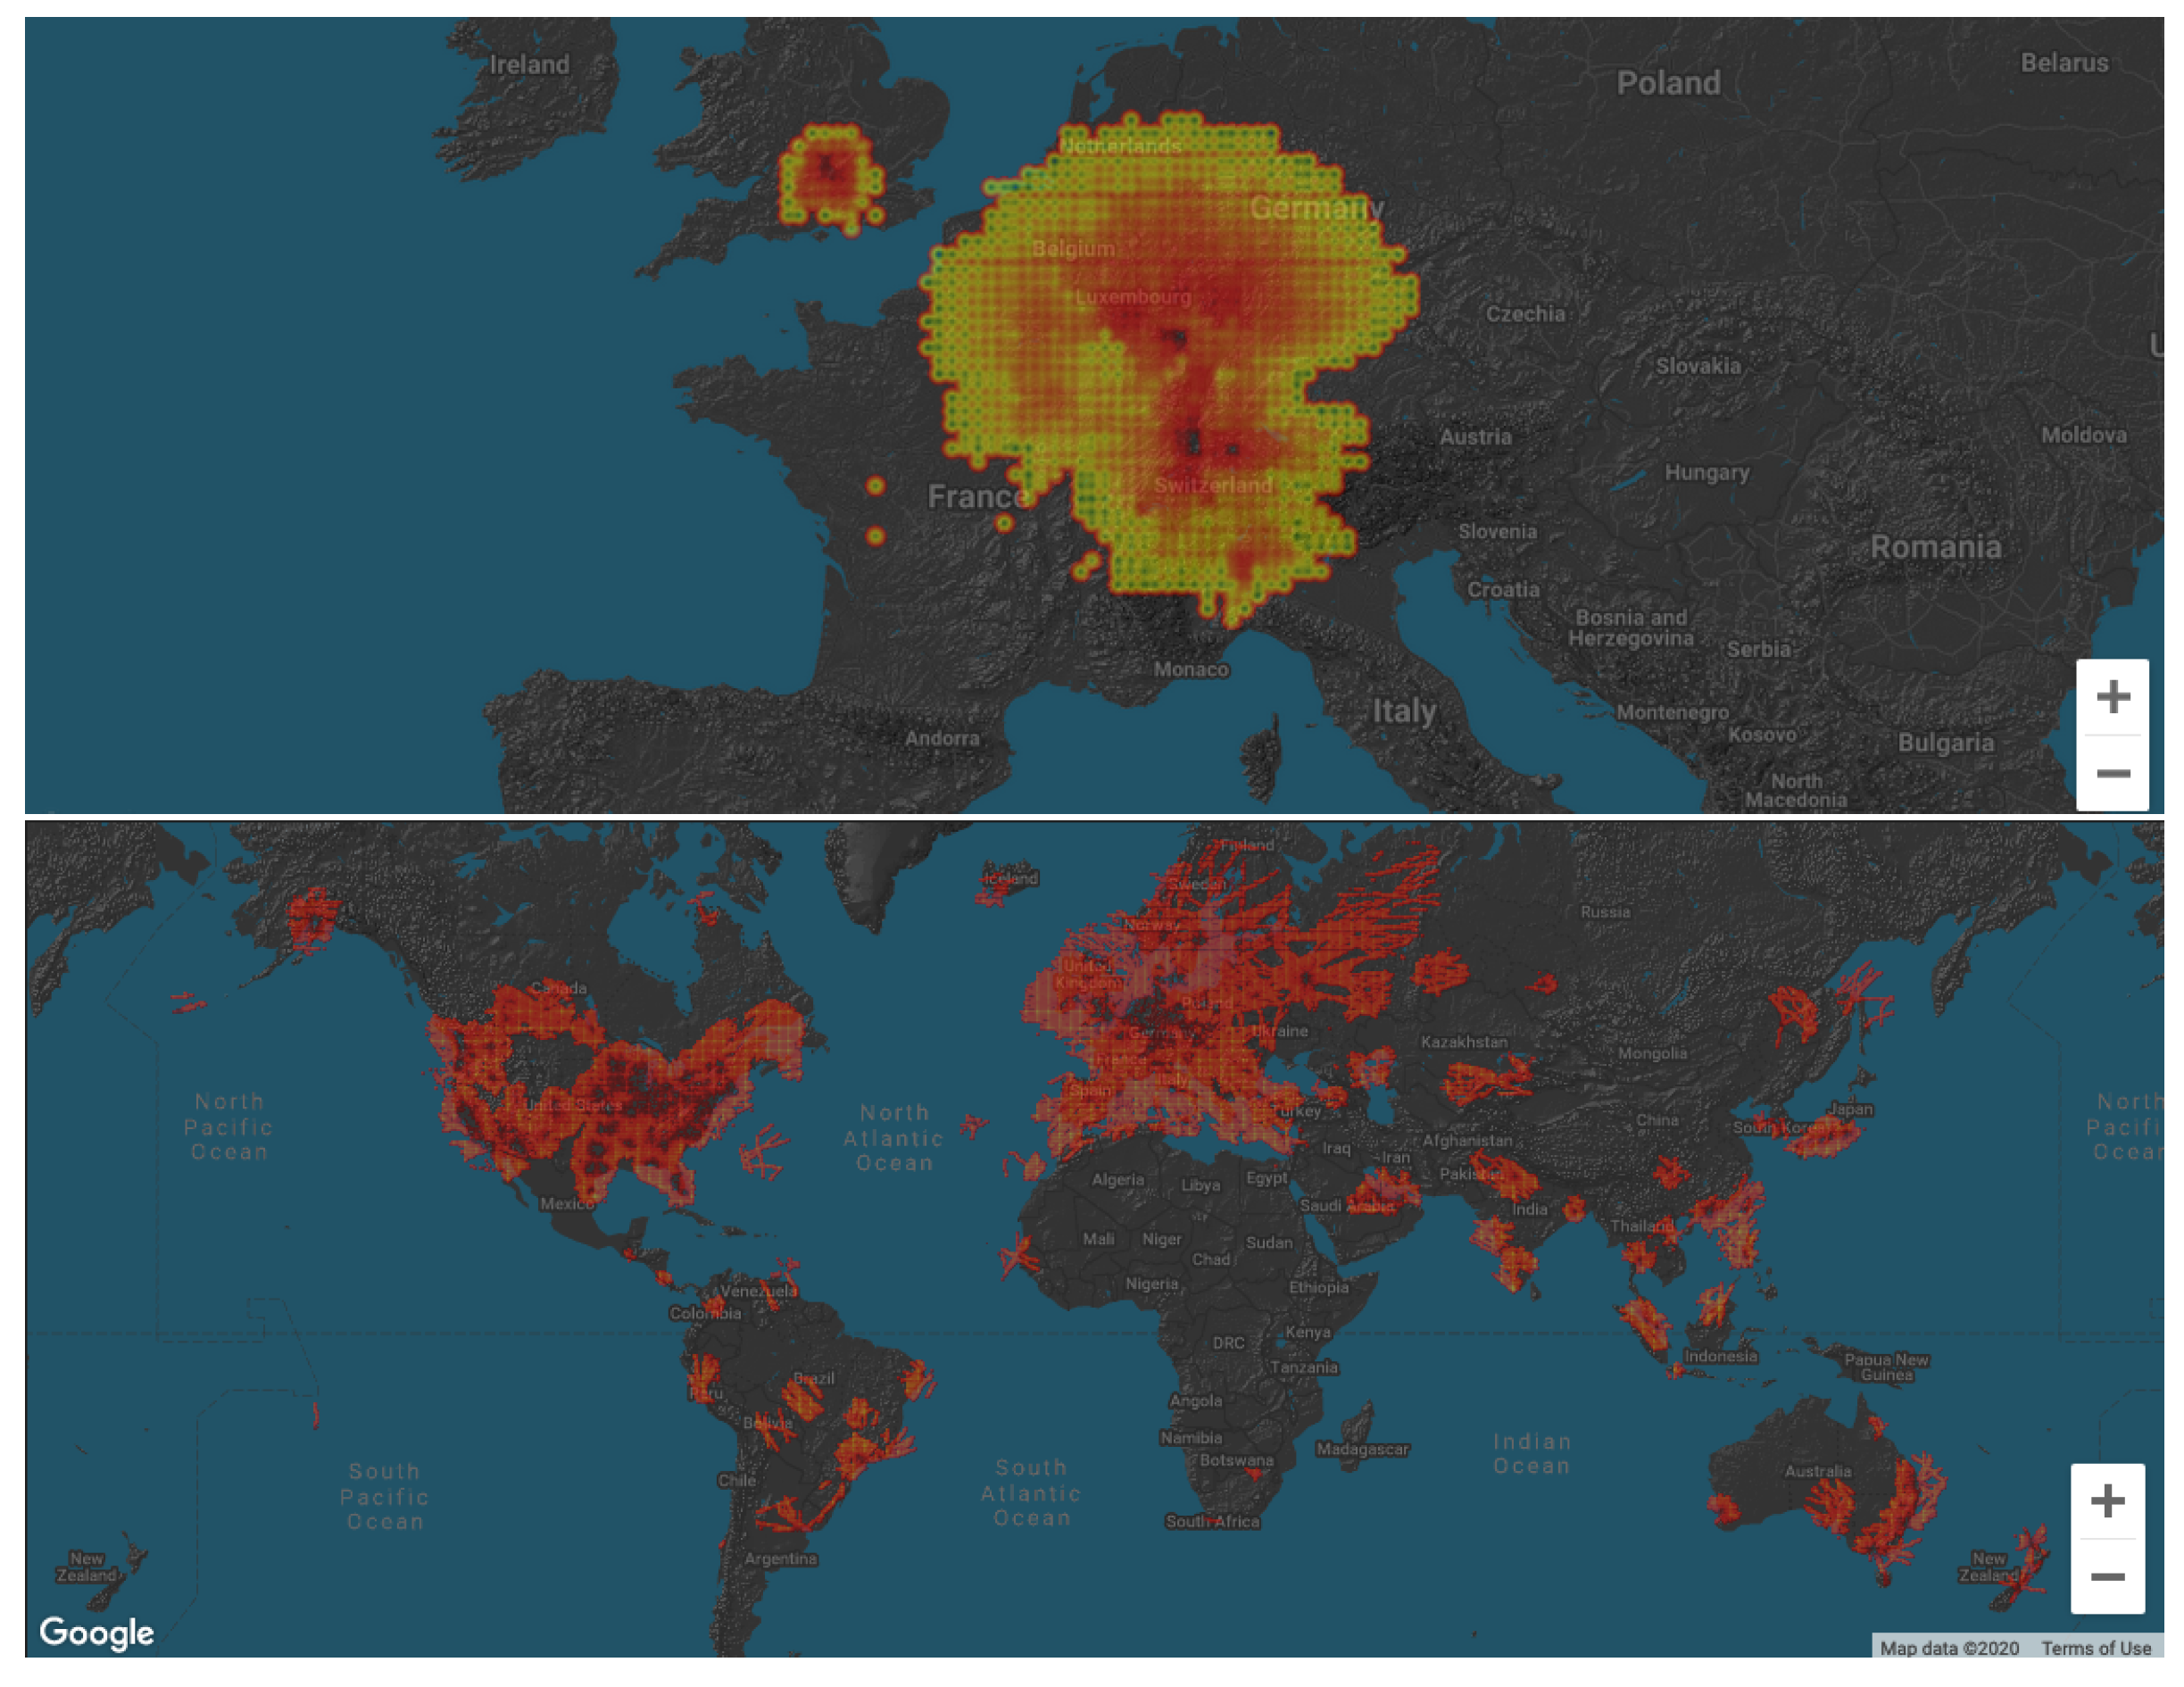
The OpenSky Network has grown from its inception in 2014 with 11 sensors in Switzerland, Germany, and the UK [1] into a global institution, all based on the concept of crowdsourcing. While its coverage is still concentrated in Europe and the US, it receives air traffic data on all continents except Antarctica. Figure 1 compares the coverage from the earliest days with today. In the beginning, the network collected exclusively Automatic Dependent Surveillance-Broadcast (ADS-B) data; this was extended to Mode S data in 2016 [2] and FLARM in 2019. Contrary to other popular and successful flight tracking websites, OpenSky was set up specifically to support non-profit research using low-level air traffic data. To quote from its website:
The mission of our non-profit association is to support open global air traffic research by universities and other not-for-profit institutions.
To this end, many volunteers from OpenSky’s core team developed tools for researchers worldwide to access these data, specifically the live application programming interface (API) and the Impala database access. In the second half of 2020, OpenSky’s open live API had on average of 5.75 million daily requests, with a peak of 8,049,317 requests on 12 October 2020. OpenSky’s Impala database, reserved for non-profit research, has had 291 active users in 2020 so far, posting 5,621,740 database queries, which took 14,792 h to return. We will discuss the Impala database further in Section 3. Beyond this, the crowdsourced aircraft database has also found use among researchers; however, OpenSky does not provide active tracking data for it, and hence, we do not analyze its use.
2. Scientific Publications
The most public-facing measure of OpenSky’s impact on (largely scientific) research is provided by the publications that make use of it. Figure 2 shows the number of publications that have used OpenSky data in one form or another from its inception until November 2020, starting with the original work discussing the OpenSky sensor network in April 2014 [1]. Overall, 151 publications were analyzed; an up-to-date list can be found on the OpenSky webpage (https://opensky-network.org/community/publications).
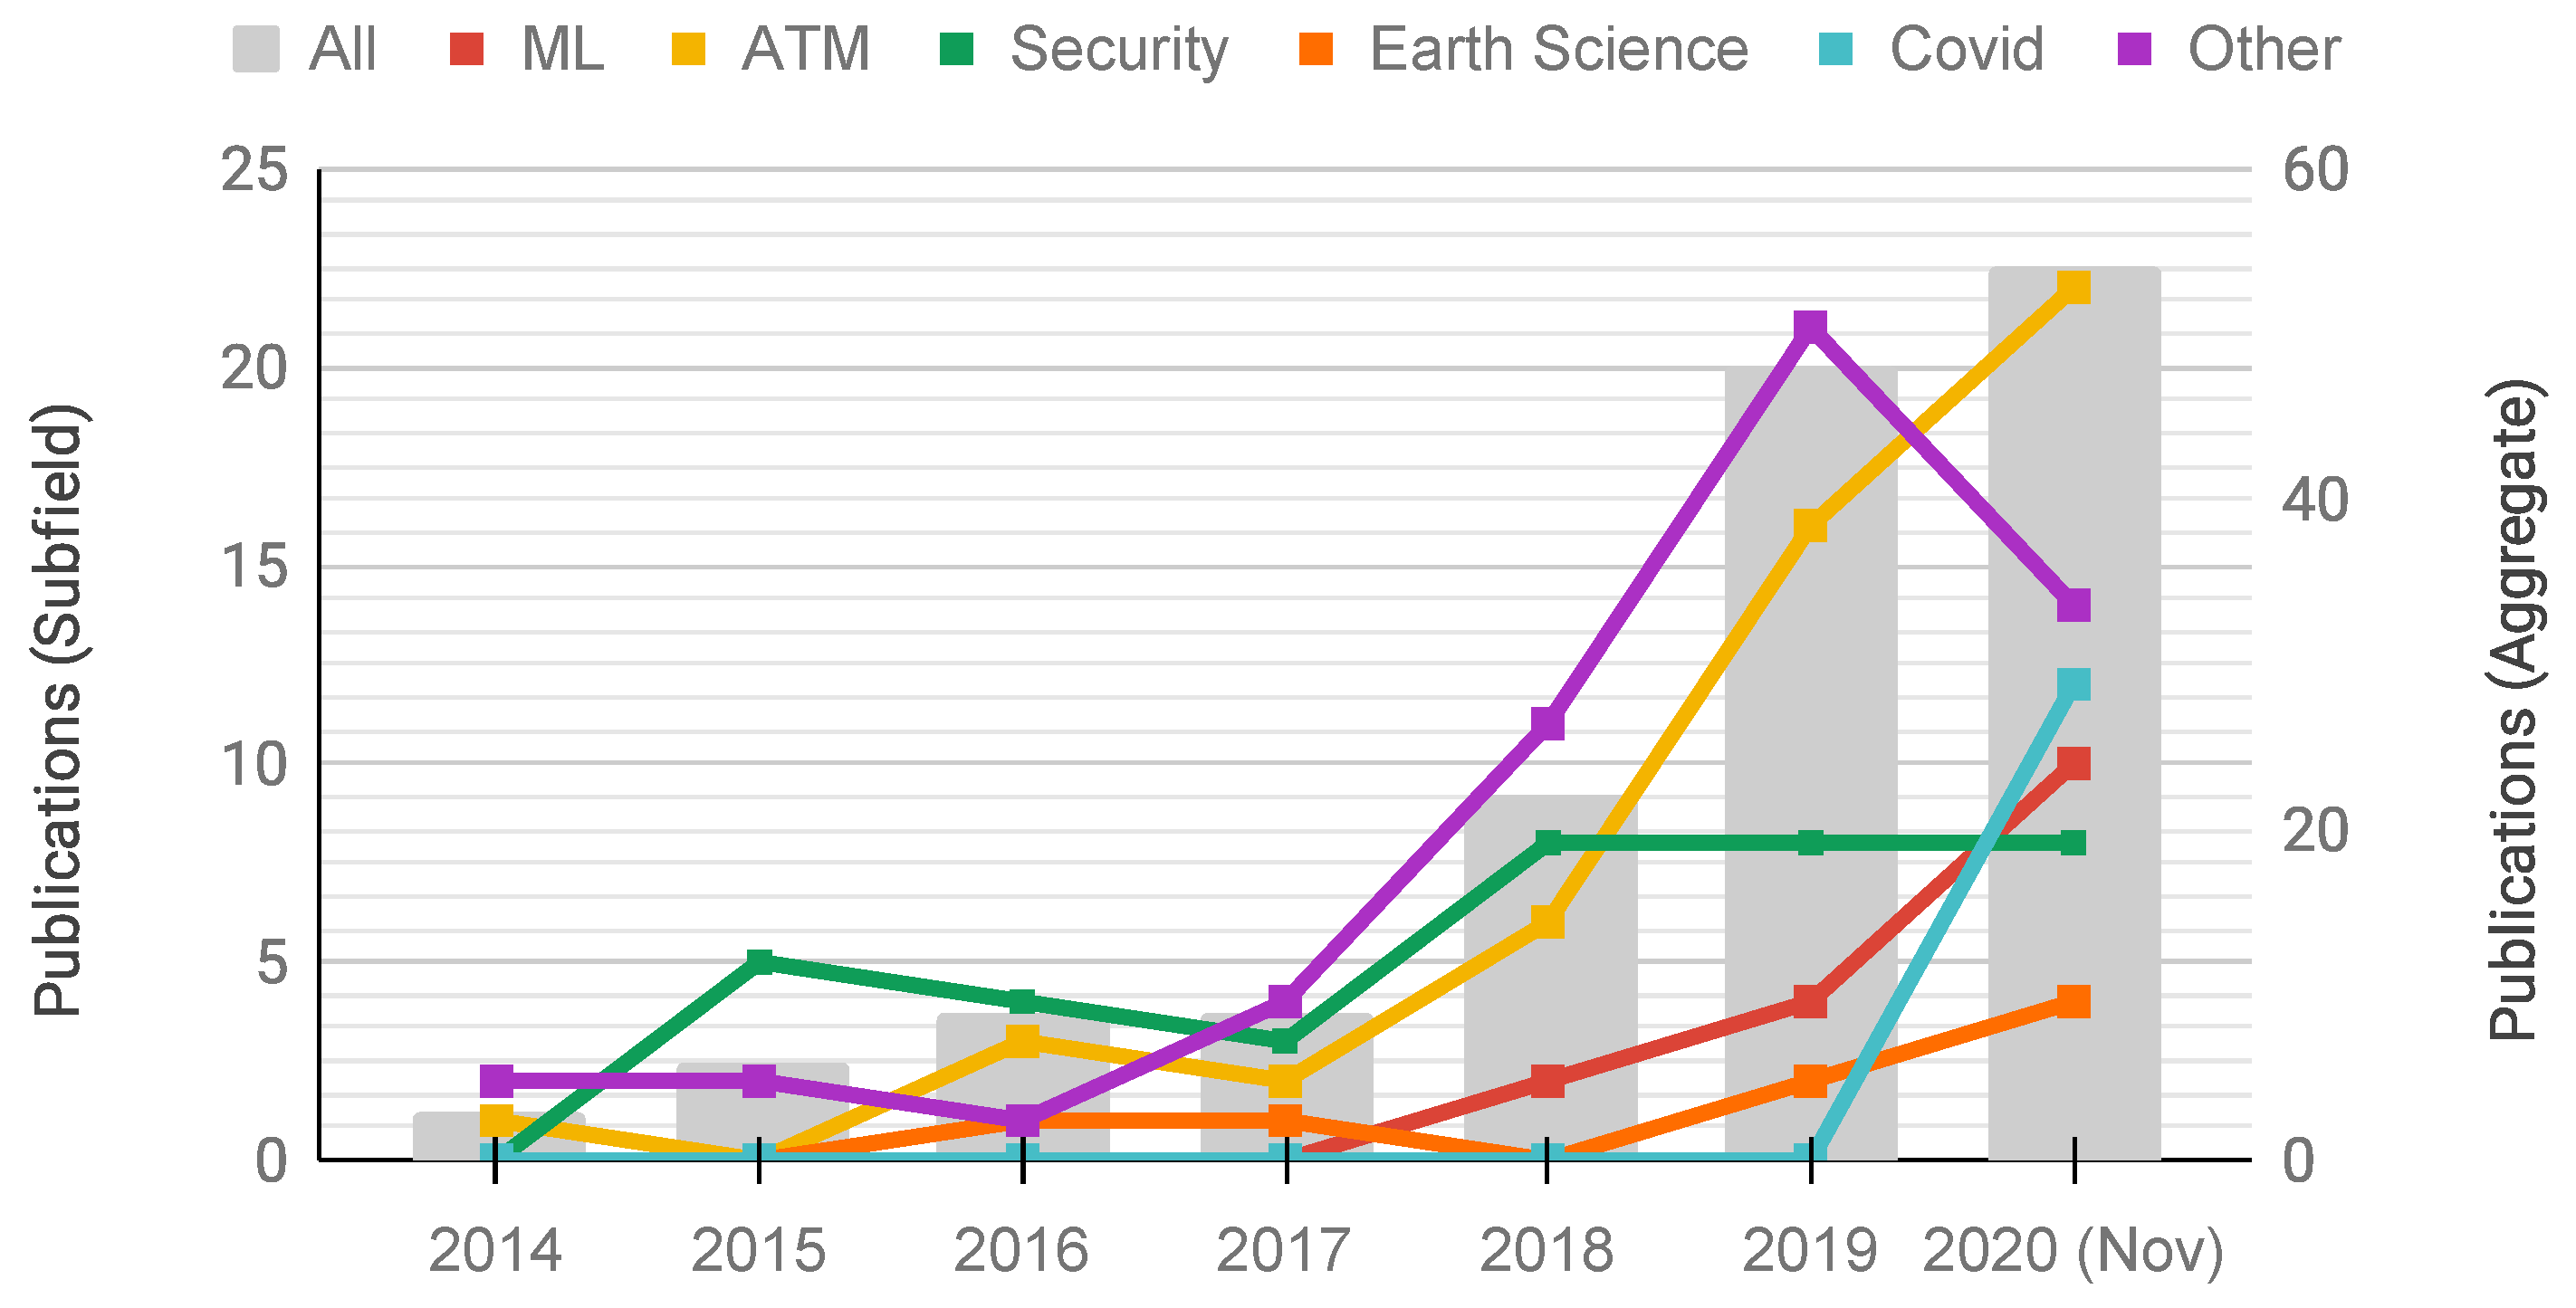
The gray bars illustrate the overall growth trend, which strongly accelerated by 2018 with 22 publications, 144% more than in the previous year. This trend continued in 2019 with a 118% increase. For this year (as of November 2020), 54 publications have been counted, ensuring a new record before the year has ended.
We can break down our analysis further by taking a look at the different scientific subfields in which OpenSky’s data have been used. We identified four large recurring themes: machine learning (ML, 16 papers overall), air traffic management (ATM, 50 papers), (cyber) security (36 papers), and Earth sciences (8 papers). Smaller areas, subsumed under `Others’, include research on noise, high-performance computing, sensor networks, and visualization, among others. From the trends of the subfields, we can see that security was the largest area of OpenSky data use in the early years up to and including 2018, reflecting the interests of the original community.
While this interest remains active, by 2019, it was overtaken soundly by ATM and in 2020 by ML, which make up the bulk of new papers. In the wake of the pandemic, a novel fifth topic has taken center stage in 2020, as air traffic data have been used widely for COVID-19-related research. With 12 publications before November, it quickly became the second largest theme after ATM. We will take a more in-depth look at this topic in Section 6.
3. Historical Database Usage
The Impala shell is one of the main tools developed by OpenSky specifically for the needs of researchers. It can be accessed directly through a shell solution or via several tools developed by OpenSky’s community, including traffic [3] and pyModeS [4].
OpenSky is tracking several metrics of its Impala use, including the number of distinct active users in a period as well as the total number of submitted queries. Table 1 shows how both these metrics developed since 2018, split into quarters and years.
Similarly to the publications, we can see a strong trend of growth over the past three years. Whereas there were, on average, about 40 users per quarter active in 2018 and 94 different active accounts overall, these metrics have now grown by more than 200% to 132 and 295, respectively. In total, the Impala shell had 415 unique users since the beginning of 2018.
Concerning the numbers of submitted queries, the trend is less clear, with the year-on-year numbers decreasing between 2018 and 2019, before picking up in the first three quarters of 2020. This is largely due to a single outlier, Q1 2018, with almost four million queries, caused for the most part by two members of the OpenSky core team. While it is clear that the variability of this metric is very high—as some research undertakings require many small queries—the general usage pattern shows an increase from Q4 2019, as no quarter has fallen below one million queries since.
4. Global Scientific User Analysis
OpenSky has been tracking requests for access to its data through a specific form on the website (https://opensky-network.org/data/apply) since March 2018. Analyzing these data provides valuable insights into OpenSky’s user base and the types of researchers interested in working with air traffic data. Table 2 provides the research-related breakdown for these requests. While it has to be noted that both 2018 and 2020 only contain 10 months’ worth of data, growth trends for all groups are clearly discernible:
- Governmental users, for which we also include requests from military institutions or aviation authorities, have grown sixfold from eight requests in 2018 to 50 in 2019, with a slower growth in the first 10 months of 2020.
- Requests from journalists and investigative media started from a similar level in 2018 and grew to 12 requests in 2019 and 2020 (to date), respectively.
- Academic researchers make up the bulk of the research requests, beginning with 64 in 2018. In 2019, we received twice as many (127) and about three times as many in 2020.
- Educational users include pupils and students in taught programs plus other, wider teaching purposes. With OpenSky’s increase in popularity, these requests grew strongly from 15 in 2018 to 118 in 2020.
- Finally, non-profit users’ requests have grown with a similar trend line, from five in 2018 to nine in 2019 and 13 so far in 2020.
In total, there were 739 tracked requests that could thus be considered research related, making up about two-thirds of all received requests (the remainder are non-institutional and often individual requests as well as commercial requests outside of OpenSky’s core mission of supporting aviation-related research).
Geographic Distribution
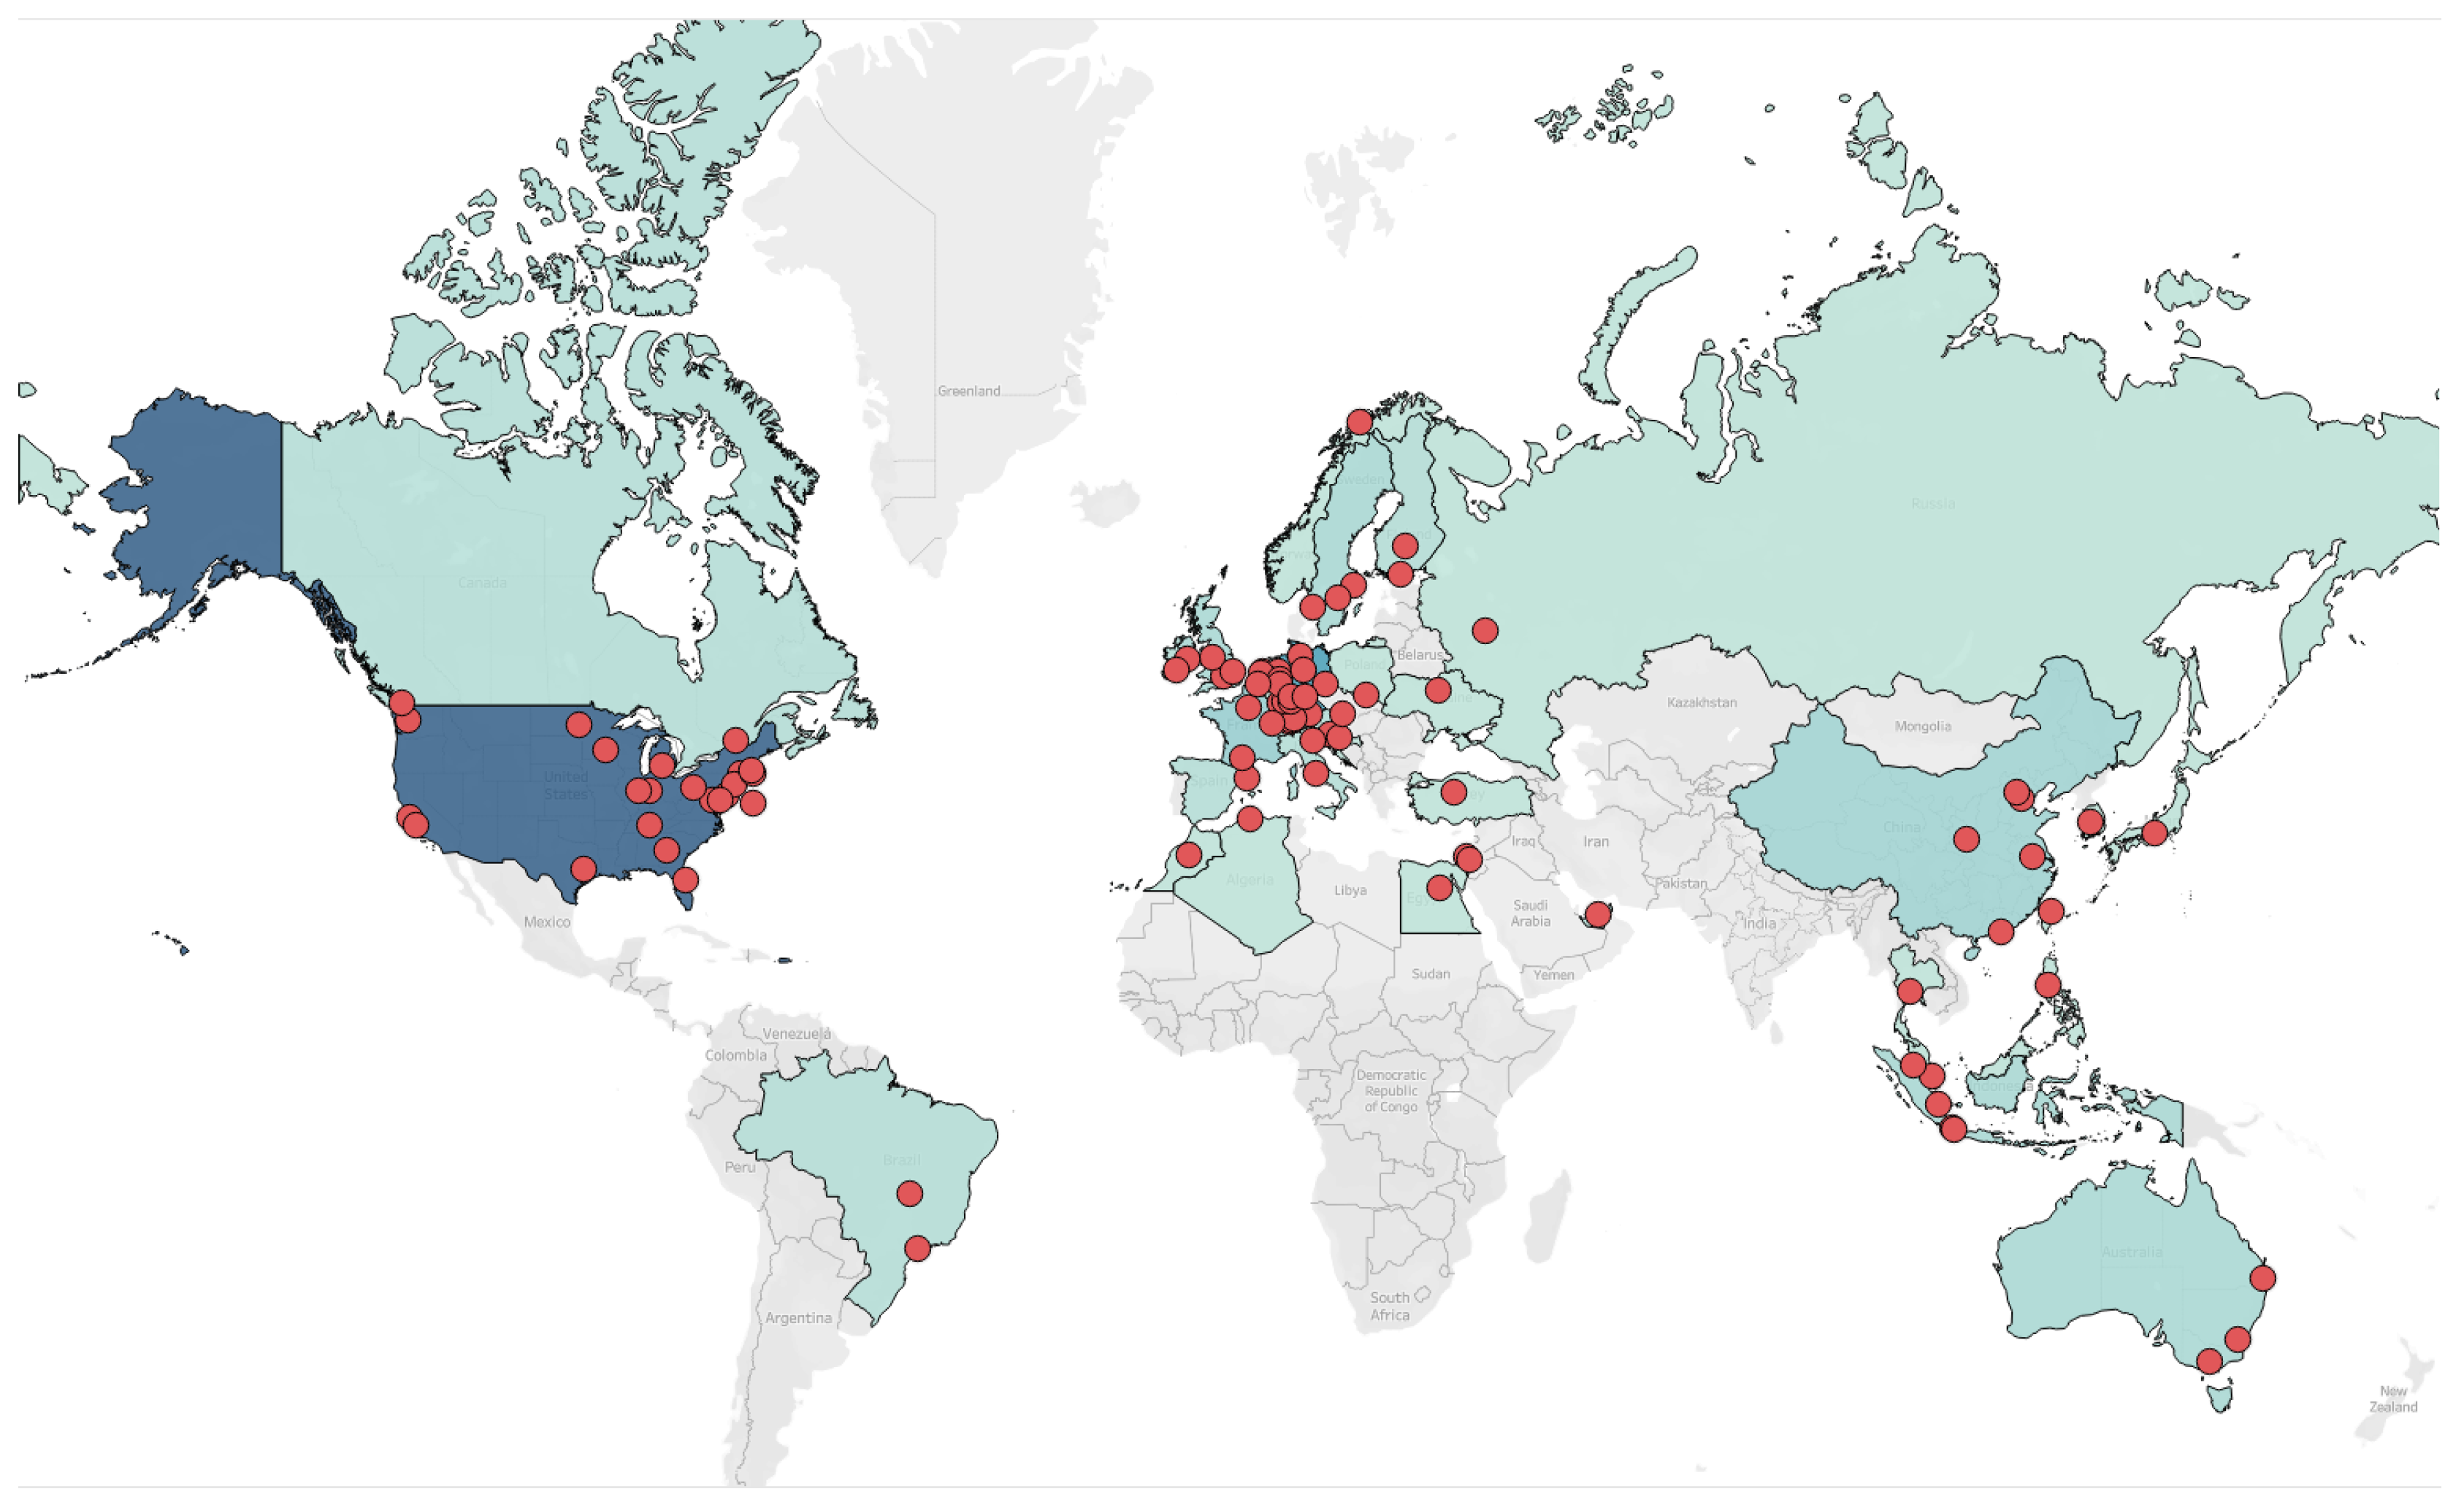
With hundreds of academic groups granted access to OpenSky’s historical databases, we can further analyze their geographic distribution and identify countries and areas where OpenSky is already popular and where there may be potential for expansion. Figure 3 shows the geographic distribution of 100 different academic institutions for the year of 2019. The institutions hail from 38 different countries from all six continents. The countries with the most distinct institutions are the United States (23), followed by Germany (13), France (5), China (4), and the Netherlands (4). Overall, we can see many similarities between OpenSky’s coverage (Figure 1) and its users. This is partly due to the fact that many researchers are themselves providing a data feed. In addition, this may also be an obvious artifact of the crowdsourcing approach, where population density and GDP per capita are likely predictors for both coverage and academic research activity.
5. Broader Social Impact
Over the years of its existence, OpenSky has been freely contributing data for the greater social good. In addition to universities, dozens of non-profits, national and supra-national institutions, non-governmental organizations (NGOs), and journalists have been using OpenSky’s flight data (an updated list is available at https://opensky-network.org/about/social-impact).
These institutions naturally have a very diverse set of interests, ranging from internal research and education to publicly released analyses. To take a closer look at the types of institutions and their data usage (where publicly available), we can group their requests into several broad areas:
- Investigative Journalism: This group is broadly interested in illicit activities conducted with aircraft or high-profile political or corporate movements using concepts similar to those described in [5]. Requests in these directions are typically from international journalist groups such as Bellingcat (https://www.bellingcat.com/) or other members of the Global Investigative Journalism Network (https://gijn.org). One illustrative example was published by Reuters on tracking the jets of the Russian oil corporation Rosneft [6].
- Data Journalism: Another popular branch of journalism is using air traffic data to visualize certain aspects of aviation in order to make it accessible to a broad range of users unfamiliar with the intricacies of flying, let alone ADS-B. Typical use cases include the illustration of flight routes at a particular airport or over a country, with an impressive example provided by Swiss newspaper Blick’s team for the airspace in Switzerland [7].
- (Supra-)National Analysis: Air traffic data can be used either directly or as a proxy for statistical or economic analysis. This use group has increased significantly with the COVID-19 pandemic in 2020 and the need for rapid `nowcasting’ procedures. We will discuss these further below. Beyond this, there are global institutions, such as departments of the United Nations, who have requested data for investigating potentially illicit activities.
- Local Activism: Beyond institutional users and journalists, many individuals and organizations require data to establish the actual facts of their specific local situations. This may, for example, happen in regard to long-term disputes around noise levels or numbers, areas, and times of flight movements near a particular airport. Examples of such OpenSky data use are provided by the App Explane (https://explane.org) for the Dutch airport Schiphol (AMS).
- Recreational Use: Lastly, OpenSky has supported recreational use cases related to aviation. The two most notable ones are the supply of live air traffic data to flight and air traffic control (ATC) simulators. The LiveTraffic project (https://twinfan.gitbook.io/livetraffic/) uses OpenSky’s live API and the crowdsourced air traffic database as the only free source of data for populating the widely used X-Plane flight simulator with live aircraft. Likewise, OpenSky supports real life traffic in the ATC simulator Euroscope, which is part of the Virtual Air Traffic Simulation network (VATSIM) (https://github.com/aap007freak/OpenSkyToEuroscope).
Naturally, in 2020, there has been a large pandemic-related uptick in the data journalism category, as well as high-profile analyses by well-known international institutions. We will look at them separately in the next section.
6. COVID-19 Usage
The outsized importance of the COVID-19 pandemic in 2020 warrants a deeper look at aviation data research in this context. As of 1 November 2020, OpenSky received over 130 data requests related to the novel coronavirus. Requests have been made since the very earliest stages of the pandemic, with the first coming on February 4th from China. With the worldwide spread of the COVID-19 outbreak, the demand for live and historic aircraft flight data then surged further. Researchers around the world wanted to obtain open and free air traffic data to comprehend the spread of the pandemic and analyze the effects of the global containment measures on economies, the climate, and other systems. In the months of March and April 2020 alone, 71 requests were received, more than one per day.
We analyzed 79 of the requests made by institutional researchers from universities, authorities, and non-profit institutions. Six of these were from banks or central banks (e.g., the Bank of England), and a further seven from governmental agencies (e.g., NASA or the Statistical Office of Denmark [8]). Three came from supra-national institutions, such as the International Monetary Fund (IMF) or World Bank, and also three from NGOs/journalists. The final 60 came from universities all over the world.
We find that the main use cases for researchers related to the pandemic are threefold: First, flight data can be used as input for models analyzing and predicting the global spread of the virus, early on in the pandemic in particular. A total of 27 of the requests fell into this range, exemplified by [9]. Second, researchers can compare the abnormal state of many systems (particularly during lockdown scenarios) with their previous state. This is particular useful in fields such as Earth systems sciences, as research into seismic noise [10] illustrates.
The largest exposure of OpenSky data with relation to COVID-19, however, came from institutions that used flights as an indicator of economic activity, either for countries or for the aviation industry as an industrial sector. Several institutions, including the Bank of England in their quarterly Monetary Policy Report [11] or the International Monetary Fund [12], applied OpenSky’s data in such a way in order to `nowcast’ economic activity—with subsequent impact on their policy recommendations.
Dedicated COVID-19 Dataset
In order to facilitate open research quickly, members of the OpenSky community have begun to release a dedicated COVID-19 dataset [13], updated monthly, with all flights seen in 2020 as well as 2019 for comparison. It serves three main purposes that go beyond providing access to the Impala database. First, it is easily accessible in CSV format for those that are less technology and programming savvy. Second, it is aimed at increasing the spread of the data beyond OpenSky’s traditional user group towards those that are new to aviation data and outside of research institutions. Third, it takes some of the load off of OpenSky’s infrastructure and the volunteers handling the access requests.
Beyond information about flight origins and destinations derived from ADS-B data, the dataset is enriched with open flight schedule information on a best-effort level. The dataset has seen very quick uptake on the open science platform Zenodo, with over 8000 downloads across all versions, and we can attribute some of the decrease of COVID-19-related access requests beyond May to its publication.
7. Possible Improvements for Researchers
Our analysis shows that the research use of air traffic data in general is a strongly growing trend, and OpenSky’s offerings to the community in particular have been used more and more over the past few years. Of course, there are many possible avenues for improvement of OpenSky from this point. To qualify them better, we identify gaps in the current research data support provided by OpenSky based on an informal survey of the requirements of the applying researchers (in particular, those that OpenSky could not help). The three main ones collected are: increased coverage, accessibility, and the availability of commercial flight data.
- Coverage: OpenSky’s coverage (see Figure 1) has always focused on organic growth through the crowdsourcing paradigm. As a non-profit organization, it is not possible to finance receivers to the extent necessary to achieve global coverage, let alone redundant coverage. As a result, many research requests regarding areas outside rich and populated centers could not be complied with. Here, community efforts could focus on the existing donation program or language-/country-specific campaigns for those areas with the highest research value.
- Accessibility: The second theme centered around accessibility of the data. While OpenSky collects and stores all messages on the 1090 MHz channel, not all are readily decoded and made available; for example, indicated airspeed or some Traffic Alert and Collision Avoidance System (TCAS) information [14]. Community-developed tools, such as traffic and pyModeS, have been developed to mitigate some of these issues, as have countless wrappers for different programming languages for the REST API. However, improved decoding, storage, and access solutions would help the accessibility of these data.A related theme exists with regards to better Windows support and support for non-technical users, who have difficulty using the shell/programming interfaces.All accessibility issues can be mitigated by preparing datasets for different research use cases and the publication of the datasets used by previous scientific work; 2020 has seen much-increased efforts in this direction, providing much better leverage for OpenSky’s data.
- Commercial Flight Data: The third and final theme considered any research specifically on the business side of commercial air travel. While OpenSky naturally collects communications data from all commercial and scheduled aircraft in its reach, and can derive some additional information such as origin, destination, or aircraft metadata, it does not provide data about delays, flight schedules, or passenger numbers.To conduct such operations research, further data sources must be found and integrated. If this is possible within the requirements of open science, new areas could be supported by OpenSky.
Without prejudice, these points may provide insights where efforts of the community could be focused and where targeted collaborations may improve the further availability of open air traffic data.
8. Conclusions
This work has analyzed and discussed the influence of the OpenSky Network on air-traffic-related research. We illustrated the large and growing impact of OpenSky’s available data in terms of scientific publications, increasing from three publications in 2014 to 54 in the first 10 months of 2020 alone.
We examined the usage trends and backgrounds of its research users, from governmental to academic institutions. We looked further at the expanding influence in terms of social impact, particularly with regard to the COVID-19 pandemic, which has dominated requests in 2020 and necessitated new specialized datasets. Finally, we identified some gaps in OpenSky’s data and interface offerings and discussed possible suggestions to close or mitigate these gaps.
References
- Schäfer, M.; Strohmeier, M.; Lenders, V.; Martinovic, I.; Wilhelm, M. Bringing up OpenSky: A large-scale ADS-B sensor network for research. In Proceeadings of the IPSN-14 Proceedings of the 13th International Symposium on Information Processing in Sensor Networks, Berlin, Germany, 15–17 April 2014; pp. 83–94.
- Schäfer, M.; Strohmeier, M.; Smith, M.; Fuchs, M.; Pinheiro, R.; Lenders, V.; Martinovic, I. OpenSky Report 2016: Facts‚ Figures and Trends in Wireless ATC Communication Systems. In Proceedings of the 35th Digital Avionics Systems Conference, Sacramento, CA, USA, 25–29 September 2016. [Google Scholar]
- Olive, X.; Basora, L. A Python Toolbox for Processing Air Traffic Data: A Use Case with Trajectory Clustering. In Proceedings of the 7th OpenSky Workshop 2019. EasyChair, 2019, EPiC Series in Computing, Zurich, Switzerland, 21–22 November 2019; pp. 73–84. [Google Scholar] [CrossRef]
- Sun, J.; Hoekstra, J. Integrating pyModeS and OpenSky Historical Database. In Proceedings of the 7th OpenSky Workshop 2019. EasyChair, 2019, EPiC Series in Computing, Zurich, Switzerland, 21–22 November 2019; pp. 63–72. [Google Scholar] [CrossRef]
- Strohmeier, M.; Smith, M.; Lenders, V.; Martinovic, I. The real first class? Inferring confidential corporate mergers and government relations from air traffic communication. In Proceedings of the 2018 IEEE European Symposium on Security and Privacy (EuroS&P), London, UK, 24–26 April 2018; pp. 107–121. [Google Scholar]
- Reuters Staff. Business and pleasure: How Russian oil giant Rosneft uses its corporate jets. Reuters 2019. [Google Scholar]
- Huwiler, S.; Wallimann, P.; Aerni, M.; Gygax, J. Gewimmel am Himmel: So ist der Schweizer Luftraum organisiert. Blick 2018. [Google Scholar]
- United Nations Department of Economic and Social Affairs. Using Experimental Statistics to Monitor of the Impact of COVID-19 in Denmark; Technical report; United Nations: New York City, NY, USA, 2020. [Google Scholar]
- Islind, A.S.; Oskarsdottir, M.; Steingrimsdotir, H. Changes in mobility patterns in Europe during the COVID-19 pandemic: Novel insights using open source data. arXiv 2020, arXiv:2008.10505. [Google Scholar]
- Lecocq, T.; Hicks, S.P.; Van Noten, K.; van Wijk, K.; Koelemeijer, P.; De Plaen, R.S.; Massin, F.; Hillers, G.; Anthony, R.E.; Apoloner, M.T.; et al. Global quieting of high-frequency seismic noise due to COVID-19 pandemic lockdown measures. Science 2020. [Google Scholar] [CrossRef] [PubMed]
- Bank of England Monetary Policy Committee. Monetary Policy Report; Technical report; Bank of England: London, UK, 2020. [Google Scholar]
- International Monetary Fund. Ensuring Continuity in the Production of External Sector Statistics During the COVID-19 Lockdown; Technical report; International Monetary Fund: Washington, DC, USA, 2020. [Google Scholar]
- Strohmeier, M.; Olive, X.; Lübbe, J.; Schäfer, M.; Lenders, V. Crowdsourced Air Traffic Data from the OpenSky Network 2019–20. Earth Syst. Sci. Data Discuss. 2020, 1–15. [Google Scholar]
- Schäfer, M.; Olive, X.; Strohmeier, M.; Smith, M.; Martinovic, I.; Lenders, V. OpenSky Report 2019: Analysing TCAS in the Real World using Big Data. In Proceedings of the 2019 IEEE/AIAA 38th Digital Avionics Systems Conference (DASC), San Diego, CA, USA, 8–12 September 2019; pp. 1–9. [Google Scholar]
Figure 1.
Coverage of OpenSky on 5 October 2014 (top) and 1 November 2020 (bottom). © Google Maps.

Figure 2.
Publications with OpenSky data from 2014 to November 2020. Overall numbers as bars on the right vertical axis. Subfield numbers as lines on the left vertical axis. Publications may have multiple fields.
Figure 2.
Publications with OpenSky data from 2014 to November 2020. Overall numbers as bars on the right vertical axis. Subfield numbers as lines on the left vertical axis. Publications may have multiple fields.

Figure 3.
Map of academic research institutions with data access rights granted in 2019.

Table 1.
Usage of OpenSky’s historical Impala database over time.
| Quarter | Distinct Active Users | Submitted Queries |
|---|---|---|
| Q1 2018 | 23 | 3,921,789 |
| Q2 2018 | 27 | 749,094 |
| Q3 2018 | 43 | 803,773 |
| Q4 2018 | 71 | 688,811 |
| Total 2018 | 94 | 6,163,467 |
| Q1 2019 | 57 | 536,347 |
| Q2 2019 | 56 | 1,034,561 |
| Q3 2019 | 39 | 304,751 |
| Q4 2019 | 71 | 2,219,156 |
| Total 2019 | 134 | 4,094,815 |
| Q1 2020 | 102 | 1,363,433 |
| Q2 2020 | 147 | 1,735,302 |
| Q3 2020 | 148 | 1,831,722 |
| Total 2020 (October 31) | 295 | 5,818,746 |
| Total since 2018 | 415 | 16,077,613 |
Table 2.
Formal data access requests to the OpenSky Network, including splits for research-relevant sub-fields. The numbers for overall requests additionally contain non-institutional, commercial, or other non-research requests not discussed in this work.
Table 2.
Formal data access requests to the OpenSky Network, including splits for research-relevant sub-fields. The numbers for overall requests additionally contain non-institutional, commercial, or other non-research requests not discussed in this work.
| Governmental | Journalistic | Academic | Educational | Non-Profit | Overall | |
|---|---|---|---|---|---|---|
| 2018 (since March 1) | 8 | 7 | 64 | 15 | 5 | 165 |
| 2019 | 50 | 12 | 127 | 50 | 9 | 354 |
| 2020 (till November 1) | 52 | 12 | 197 | 118 | 13 | 555 |
| Total | 110 | 31 | 388 | 183 | 27 | 1074 |
Publisher’s Note: MDPI stays neutral with regard to jurisdictional claims in published maps and institutional affiliations. |
© 2020 by the author. Licensee MDPI, Basel, Switzerland. This article is an open access article distributed under the terms and conditions of the Creative Commons Attribution (CC BY) license (https://creativecommons.org/licenses/by/4.0/).
Share and Cite
MDPI and ACS Style
Strohmeier, M. Research Usage and Social Impact of Crowdsourced Air Traffic Data. Proceedings 2020, 59, 1. https://doi.org/10.3390/proceedings2020059001
AMA Style
Strohmeier M. Research Usage and Social Impact of Crowdsourced Air Traffic Data. Proceedings. 2020; 59(1):1. https://doi.org/10.3390/proceedings2020059001
Chicago/Turabian StyleStrohmeier, Martin. 2020. "Research Usage and Social Impact of Crowdsourced Air Traffic Data" Proceedings 59, no. 1: 1. https://doi.org/10.3390/proceedings2020059001