Proceeding Paper

Electricity Sector Organization and Performance in Burundi †

by
René Nsabimana
1,2
1
HEC Liège, University of Liège, 4000 Liège, Belgium
2
Faculty of Economics and Management, The University of Burundi, 1550 Bujumbura, Burundi
Presented at the First World Energies Forum, 14 September–5 October 2020; Available online: https://wef.sciforum.net/.
Proceedings 2020, 58(1), 26; https://doi.org/10.3390/WEF-06938
Published: 14 September 2020
(This article belongs to the Proceedings of The First World Energies Forum—Current and Future Energy Issues)

Abstract

:
Burundi faces low access to electricity and low quality of service. It depends on the interconnected networks constructed in the decade of 1980. Despite the different reforms relating to the liberalization and reorganization of the electricity sector, the REGIDESO remains the public company in charge of the production and distribution of electricity. It has also the responsibility to pump, treat, and supply drinking water in the main and secondary urban centers. This paper makes a review of the policies, reform, and organization of the electricity sector in Burundi. We estimate the performance of the electricity sector using descriptive analysis, on the basis of secondary data collected in East Africa and from the World Development Indicators (WDI), and qualitative data obtained through semi-structured interviews and text analysis. Our results show that despite the different reforms undertaken in 2000 and 2015, the electricity sector remains mainly a natural monopoly of the state. As a result, access to electricity and consumption per capita remain the lowest of East Africa and Sub-Saharan Africa as a whole. The electricity sector is also characterized by the poor quality of service due to technical and non-technical losses. Among the non-technical losses, the unpaid bills especially for the public sector are very high. The study recommendation is to implement the reform undertaken in 2000 by splitting the public services of water and electricity, and the one of 2015 by unbundling the electricity sector. Policy implying private participation in the electricity sector and prioritizing regional projects for interconnection to facilitate cross-border trade of electricity are highly recommended.

1. Introduction

Access to reliable, sustainable, and modern energy services at an affordable cost is one of the goals contributing to the United Nations 2030 Agenda on Sustainable Development Goals (SDG 7). However, in developing countries and particularly in Sub-Saharan Africa (SSA), access to electricity with the high quality of service is far from being a reality [1,2]. Power outages and blackouts ranging from 8 h to 12 h per day in urban areas, or even 18 h in rural areas, characterize certain regions. Low quality of electricity supply is attributed to technical causes and/or managerial and institutional causes. Technical causes include insufficient installed capacity or the obsolescence of the electricity transmission and distribution network. According to [3], the age of the system equipment increases the probability of service interruption due to component failure. Technical causes occur during the transfer of electricity from one point to another due to power dissipation in the process. Non-technical causes include managerial and institutional causes such as the governance structure, the system of redistribution of subsidies, or the political interference in public electricity services [2,4,5,6].
Burundi is one of the SSA countries with low access to electricity and poor quality of supply. It depends on interconnected networks dating from the 1980s. It is a small country located in East Africa, sharing frontiers with the Democratic Republic of Congo (DRC), Rwanda, and Tanzania, respectively, in West, North, and East, with a total area of 27,834 km2. The country is endowed with hydropower resources, with a potential of 1700 MW; among them, 300 MW are economically exploitable [7]. It relies on domestic power plants for a capacity of 32 MW and imports from DRC for a capacity of 16.5 MW.
Access to electricity remains very low. More than 90% of the population does not have access to electricity. For those who are connected, the quality of service is very low. Burundi has experienced long periods of electricity shortages, especially during the last two decades. The question is now why access to electricity and quality of service remain low in Burundi.
The aim of this paper is to investigate the organization of the electricity sector in Burundi and its impact on the performance. Specifically, we describe the electricity sector and the main actors. We also analyze the performance of the electricity sector in terms of access to electricity and the quality of service. The paper constitutes an introduction to benchmark study of the performance of the electricity sector in East Africa. Therefore, it contributes by describing the state of electricity sector in Burundi.
The second section describes the organization of the electricity sector in Burundi. In the third section, we analyze the status of electricity generation, transmission and distribution. In the fourth section, we analyze the access to electricity and describe the state of unpaid bills, a high component of non-technical losses. Finally, we discuss the results and conclude.

2. Material and Method

The assessment of the organization of the electricity sector in Burundi is based on documentation obtained including policies, strategies, acts, and decrees. Most documents visited are, among others, the Vision Burundi 2025, the Poverty Reduction Strategic Framework (CSLP II), the energy policy letter, the energy sector strategy in Burundi, and the National Development Plan (NDP 2018–2027). We also analyzed the different acts, such as the acts of 2000 and 2015, which liberalizes and reorganizes the electricity sector, as well as the implementing decrees.
We also conducted semi-structured interviews with different actors including officials from the Ministry responsible for Energy, the Regulatory Authority, and the REGIDESO. We also entertained with some final users from the private sector. To estimate the performance of the electricity sector, we use the data obtained from the public utility, the REGIDESO. Other data were obtained from the World Development Indicators of the World Bank.

3. Results

3.1. Electricity Sector Organization in Burundi

The electricity sector faced more transformations around the world. In the developing countries, the electricity sector was not sufficiently organized to mobilize sufficient investments to provide access and low tariffs, or to face the poor service quality of quality. Further, the state-owned utilities experienced a context of poor technical and financial performance. The main drivers for electricity sector reform include low possibilities to expand access to service, low quality of service, high transmission, and distribution losses, high costs of the public utilities, lack of financial resources to invest in new generation and transmission or to maintain existing investments, high level of subsidies to the utilities and the need to remove them, the need to raise revenue by selling assets [5,8,9]. The aim of the electricity sector reform consists to improve the performance. Some indicators of performance are described by [8,10], such as the increased installed capacity and amount of electricity produced, the quality of service and the reliability of electricity access, the tariffs and price ratios, the cost recovery. These indicators have an impact on poverty reduction, economic growth, and quality of life.
In Burundi, the REGIDESO was established as a state-owned company in 1968 to produce and distribute electricity and water in the main and secondary cities. The electricity sector reform dates from 2000 and 2015. The Act of 2000 separates the public services of water and electricity. It also unbundled the vertically integrated utility into generation, transmission, and distribution activities. It liberalized the generation and transmission activities, while the distribution and retail were attributed as a concession contract to the REGIDESO during the first period to determine. Due to the lack of implementing texts, and the socio-political crisis during 1993 to 2005, the act did not come into force. REGIDESO remained in a situation of poor performance, much criticized by parliament, civil society, and technical and financial partners.
In 2015, a second act was promulgated to reorganize the electricity sector, in order to create a legal framework favorable to private investment in the electricity sector. The act unbundles the electricity sector into generation, transmission, distribution, and retail. It opens the generation to Independent Power Producers (IPPs) and attributes to the REGIDESO a 25-year concession on electricity transmission, distribution, and retail. It also creates a regulation and control agency, as well as rural electrification agency. In order to attract private participation and investments in all public utilities, the second Act for public-private partnership (PPP) was also promulgated in 2015.
The promulgation of the two Act permits to undertake a pipeline of power projects in order to increase the installed capacity, access to electricity and development. Some projects had to be financed under the government budget, other by Development Financial Institutions and Donors. Some PPPs have also been concluded especially in the renewable energy such as solar projects and hydro, and non-renewable energy such as thermal power. As of 2020, an additional installed capacity of 100 MW may be already available [11].
However, the electricity sector reform in Burundi was not successful. Among the eight steps defined by [9,12,13], only five steps have been realized in Burundi. Corporatization and commercialization of the REGIDESO are recognized under the decree of 1997, with the statutes of public commercial and industrial company. A capital share of 1.44 billion Burundian francs (BIF) (Compared to international USD constant in 2010, USD 1 = BIF 1270.75) was attributed to the REGIDESO, which had to be governed under the Code of private and public companies. The government did not allow the private sector to participate in the capital shares of the society. Therefore, REGIDESO remained a vertically integrated company supplying water and electricity until now.
The electricity sector in Burundi is placed under the supervision of the Ministry of Energy and Mines who designs and implements the national energy policy, supervises the rural electrification, and plans to build and manage energy infrastructures. The execution of the national energy policy is under the responsibility of the Direction Générale de l’Energie. Two personalized state administrations have been established, the Water and Energy Regulatory Authority (AREEN) and the Rural Electrification Agency (ABER). The former is responsible for controlling, regulating, and monitoring electricity activities while promoting competition in the sector. The latter is assigned missions to plan and coordinate rural electrification activities, especially by developing micro-grid projects. Operating activities on interconnected electricity network is placed under the REGIDESO. It is characterized by a high deficit of electricity and water supply and high charges.
According to the decree of 1997, REGIDESO is governed by a Board of Directors comprising nine members, including five representing the state, two representing large and small consumers, one staff representative, and the last designated for his particular skills and experience. Daily operations are managed by the Directorate General and Department directors all appointed by decrees, without any selection criteria. Despite the fix term, the Board of Director, the Director General and the Directors can be removed any time, while the Minister has the right to suspend any decision of the Board of Directors he judges “contrary to law, public order or the general interest”. Especially, the REGIDESO was characterized by a high turnover of the Director General, while they are appointed for four renewable years. From 2004 to 2017, seven Director Generals were appointed with an average duration of two years each.

3.2. Status of Electricity Network

The electricity network comprises interconnected networks and off-grid networks. The interconnected network generation, transmission and distribution network all managed by REGIDESO. The off-grid is managed by ABER and auto-producers. In this section, we describe the electricity generation, transmission and distribution.

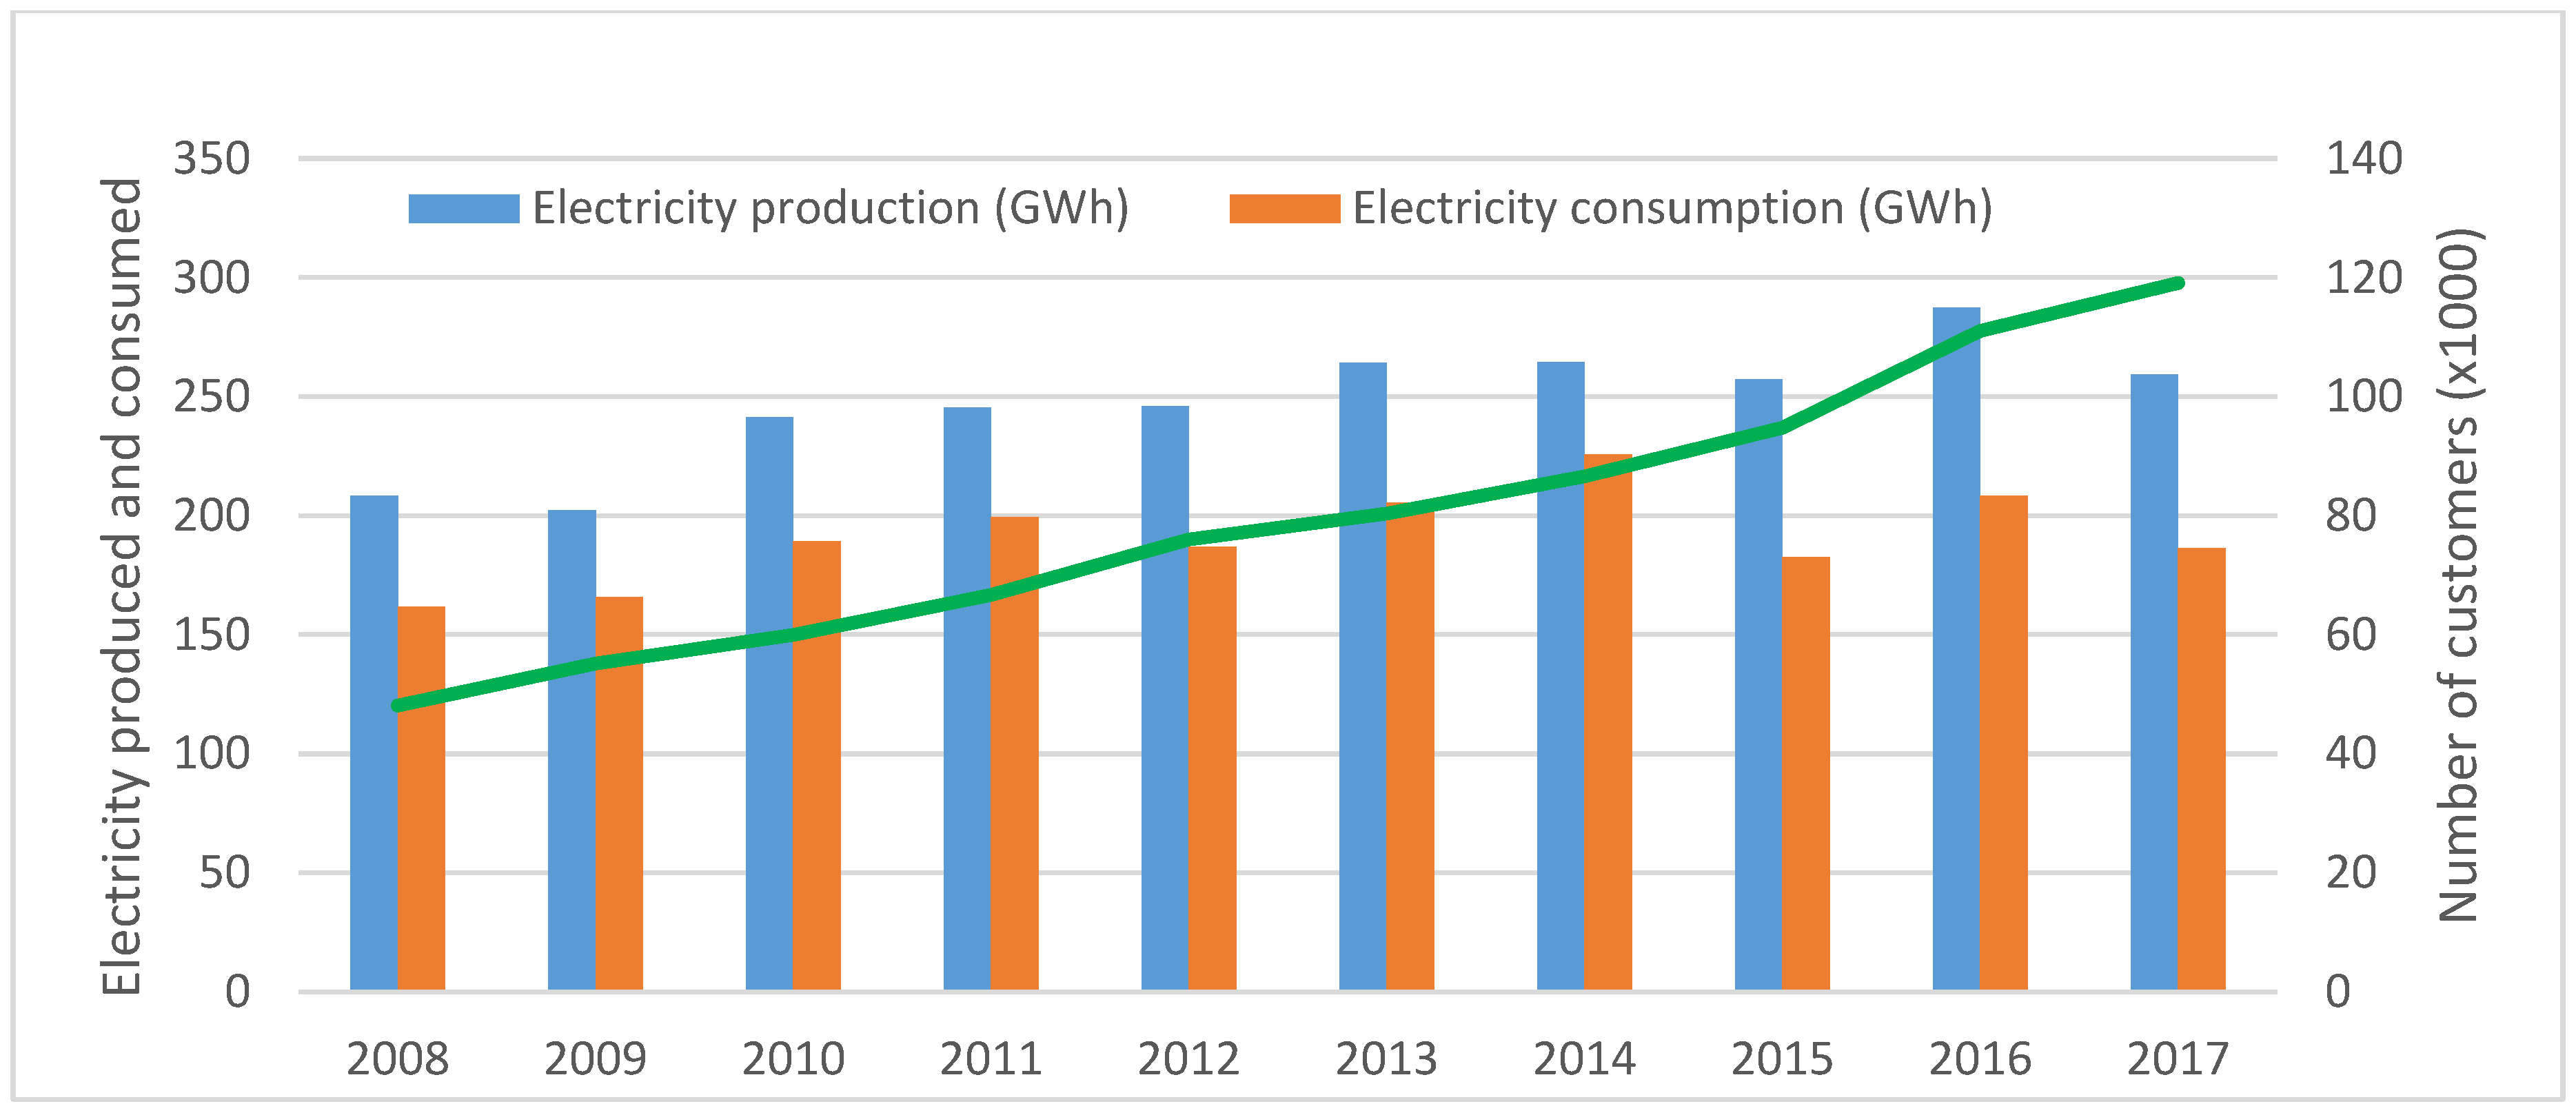
3.2.1. Electricity Generation

Burundi is endowed with high potential in renewable energy such as hydro, solar, wind, and geothermal, and non-renewable energy such as peat. The REGIDESO maintains and operates eight hydroelectric plants for a capacity of approximately 33 MW. Two of these plants (Rwegura with 18 MW and Mugere with 8 MW) represent 81% of total installed capacity. Except for the Rwegura hydroelectric plant, other power stations are qualified for “run-of-river” and can entirely use their installed capacity, which reduces in the dry seasons. With its reservoir of 17 million m3, the Rwegura hydroelectric can be used with a guaranteed power of 8 MW for about eight hours a day [14]. Since 1995, a thermal plant for a capacity 5.5 MW has been installed to further diversify the electricity supply and reduce the electricity deficit. This thermal plant has been rarely used due to its high operational cost. Another 5 MW thermal plant has been operating with the subsidies of the World Bank and the European Union.
Since 2013, the REGIDESO contracted a lease contract with the Interpetrol company to supply 10 MW of thermal plant [11]. This company has been granted an exemption from all taxes and other fiscal levies on imports, on equipment, lubricants, spare parts, and fuel imported, for a period of 24 months starting from 1 April 2015 (Ministerial Order N° 540/649 Of 5 May 2015 Relating to Total Exemptions on the Importation of Equipment and Consumables Granted to the Interpetrol / Energyst Group, Independent Energy Producer). After a long period of electricity shortage, the REGIDESO negotiated a second contract with Interpetrol for a capacity of 30 MW in 2017. The country imports 16.5 MW from the hydroelectric plants of Ruzizi I and Ruzizi II from DRC. Actually, the total interconnected power plants operated by the REGIDESO includes a total installed capacity of around 80 MW comprising 41% for domestic hydroelectric plants, 38% for thermal plants, and 21% for imports. Table 1 shows the current status of electric power in Burundi.
Off-grid electricity includes six small hydro plants operated by ABER, for a total capacity of 1.38 MW. Other small plants including hydro, diesel generators, bagasse, and solar panels are operated by a range of private and public actors in the areas not covered by the interconnected network, or to serve as backup due to shortages in the electricity supply [7]. Even not accounted in the national production, solar panels are increasingly used as a source of power for households and firms connected to the main grid or located far away from the interconnected grid. Solar power has become an alternative way to cope with the low quality of electricity supply. Under the support of the European Union and the Belgian cooperation through ENABEL, a series of off-grid projects have been developed, including photovoltaic (PV) electrification of 30 schools and 20 clinics, and 30 health centers [15].
In order to increase access to electricity and meet increasing demand, a series of power generation has been planned, under government and development partner support. Most of the donors include multilateral and bilateral partners, such as the World Bank (WB), European Union (EU), European Investment Bank (EIB), the Government of China, Exim Bank of India, and some PPP projects. The Government of Burundi has also signed a memorandum of understanding to import electricity from Ethiopia [15]. A total installed capacity of 400 MW is planned to be commissioned by 2024 as shown in Table 2.

3.2.2. Electricity Transmission and Distribution

Transmission and distribution networks play an important role in access to electricity. The transmission networks carry electricity over long distances from the power generation plants to substations through high voltage (HV) lines [16]. The transmission characteristics, such as pylons, transmission substations, and HV power lines, are different from those of distribution networks. Each substation is equipped with transformers that step-up the electricity produced from the medium voltage (MV) and low voltage (LV) to HV (transmission substation) and step-down by decreasing the voltage [17]. While the transmission network operates under HV, the distribution system operates at LV and directly connects the end-users [16]. The change in voltage is one source of electricity losses. To reduce the network losses, the electricity transmission is conducted at HV, while the generation and distribution are performed at LV [18]. In order to deliver high quality of service, expansion, and maintenance of the transmission and distribution networks are required.
The transmission network in Burundi is composed of lines of 110 kV, 70 kV, 35 kV, and 30 kV. The 110 kV dating from the 1980s links Ruzizi II and Rwegura hydroelectric plants to two cities, Bujumbura and Gitega, for a total length of 210 km. Another transmission line 70 kV commissioned in 1958 links Ruzizi I hydroelectric plant to Bujumbura for a distance of 112 km. The 35 kV line of 15 km linking Mugere hydroelectric plant to Bujumbura dates from 1982. Other regions are interconnected by the 30 kV lines, which also serve as distribution networks in certain areas. All these lines are overhead.
The distribution network comprises medium voltage (MV) lines of 6.6 kV, 15 kV, and 10 kV, and LV lines of 220/380 V. The 6.6 kV networks are especially underground and located in Bujumbura and Gitega cities, for a total distance of 150 km. These lines were built in the 1960s and were already declared outdated since 1990, which required replacement [14]. From 1991 to 2007, no extension of the transmission network has been made. During this period, the distribution network increased by 2% per year, and by 4% from 2007 to 2017. As of 2017, the total interconnected network is estimated at 2360 km. Table 3 shows the length of transmission and distribution networks.
A program of cross-border interconnection facility with the EAPP has been launched to exchange electric power between the national grids. In order to interconnect with the EAPP, Burundi plans to develop three lines of 220 kV Burundi to Tanzania (161 km), Rwanda (143 km) and DRC (78 km). Burundi plans also to develop 110 kV linking the hydroelectric plants under construction to Bujumbura, such as Jiji-Mulembwe, Ruzibazi, and Kabu 16.

3.3. Performance of Electricity Sector in Burundi

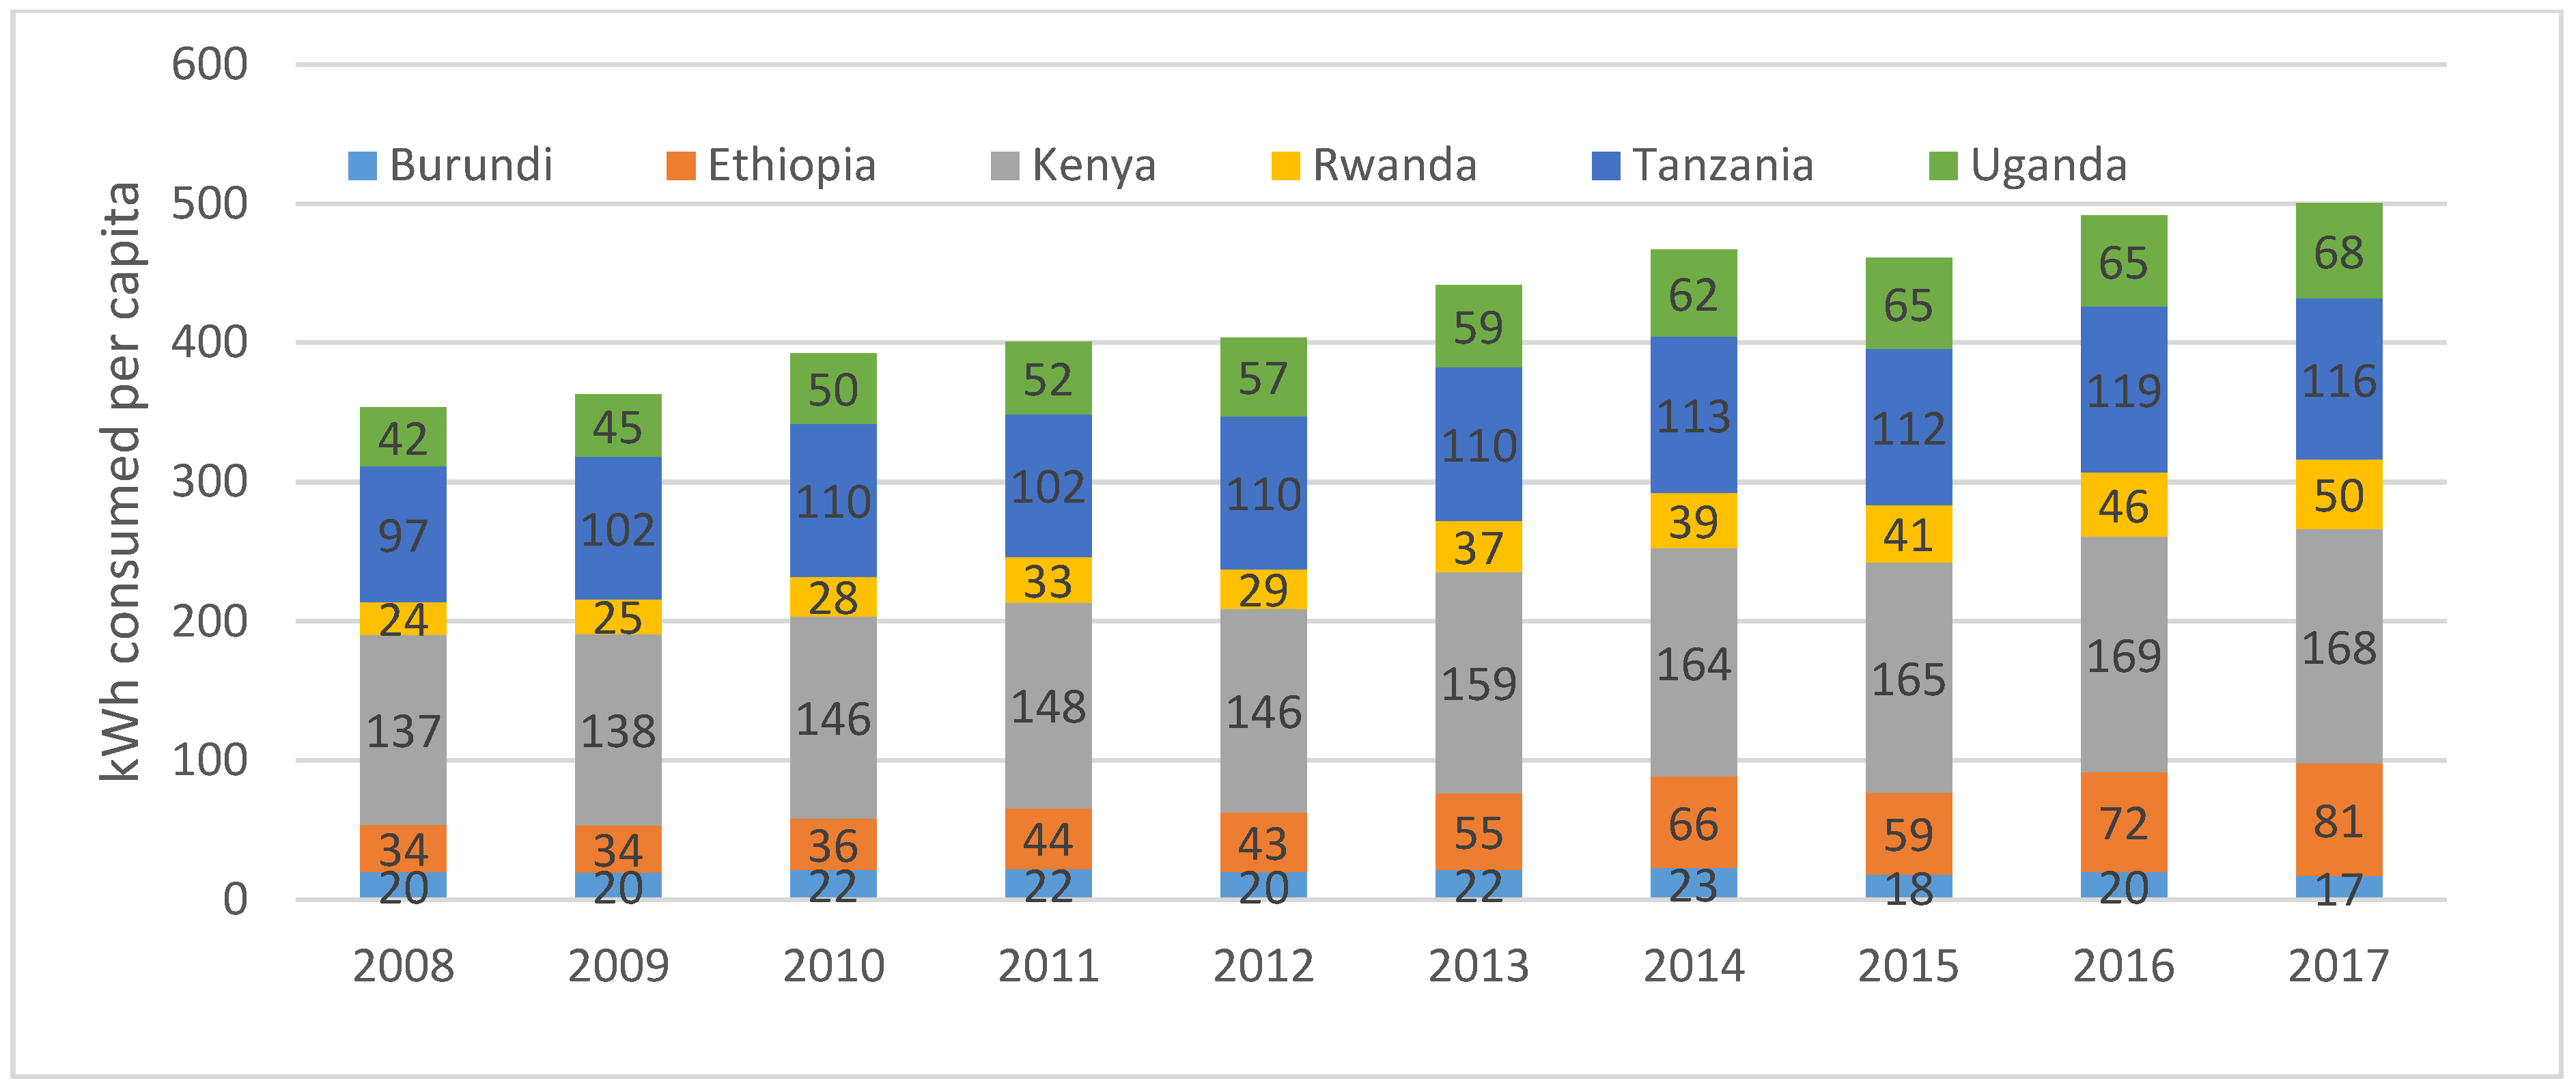
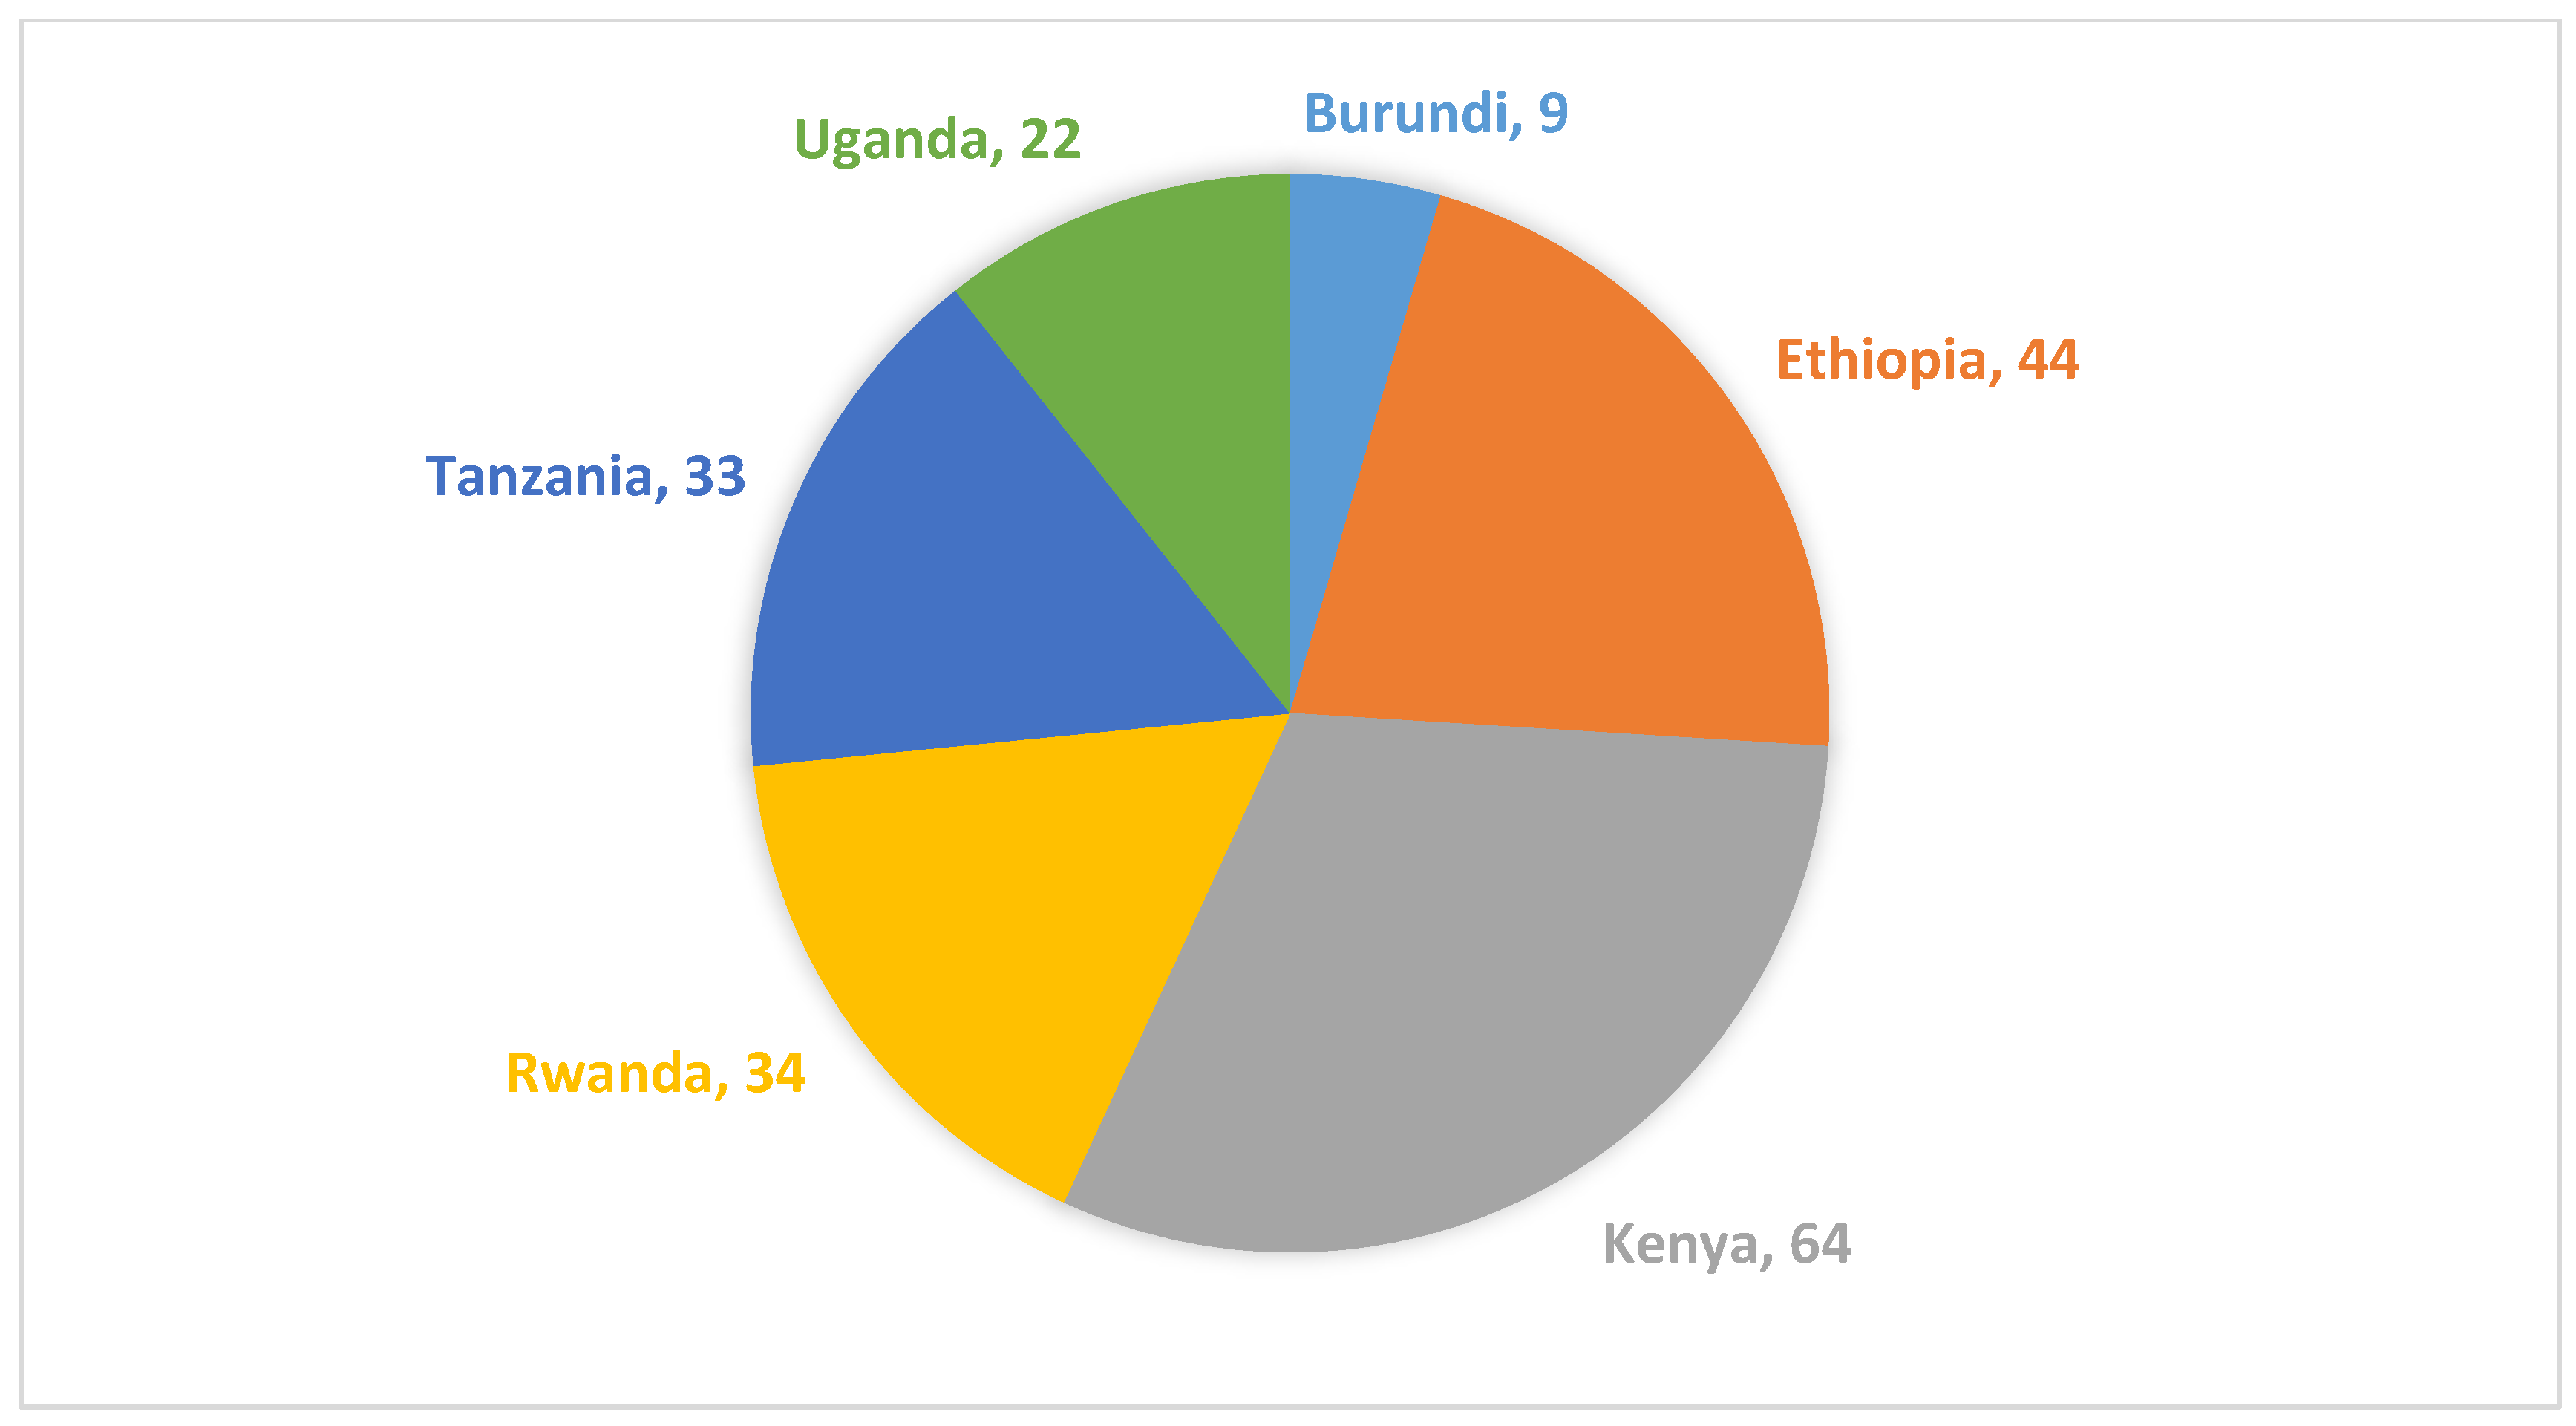
3.3.1. Access to Electricity

Burundi remains the least country in the world in terms of access to electricity. Statistics from the World Development Indicator show that more than 90% of the Burundian population does not access to electricity in 2017. Access to electricity benefits much more urban areas (61.8%) than rural ones (2%). Despite its position in the Great Lakes in East Africa, access to electricity remains very low compared to other countries. Figure 1 compares access to electricity in East Africa. Data from WDI indicate a high trend of connection in Kenya and Rwanda. In the last country, access to electricity increased from 6% in 2008 to 34% versus 4.8 to 9.3% in Burundi.
The lack of investments in power generation is one of the main causes of low access to electricity in Burundi. When the last hydroelectric plant was commissioned in 1989, Burundi accounted for 13,799 customers, which increased to 119,132 in 2017. According to [4], low access to electricity could be attributed to the affordability gap and structural challenges. They show that pure demand-related accounts for two-fifths of access gap, which comprises high connection charges, irregular income for households, dispersion from the electrical grid, and lack of minimum building standard. Among the structural causes, the authors cite low regulated tariffs not sufficient for cost-recovery. In such a manner, the electric utility faces poor financial position. Figure 2 compares the evolution of customers, electricity produced, and consumed.
Figure 2 shows that while the number of customers continues to increase, the electricity consumed remains very low. The high decrease in electricity consumed, especially from 2015 to 2017 was due to power rationing. Especially, the level of water in the Rwegura basin reduced by 9.45 m from April to December 2016, which reduced the electricity produced by half. The poor financial position of the REGIDESO did not allow it to maintain existing infrastructures, especially the underground distribution networks in Bujumbura city.
Consumption per capita remains also very low in Burundi. Blimpo and Cosgrove-Davies (2019) show that in 2014, average consumption per capita in SSA is 483 kWh. It is an amount needed to power a 50-watt lightbulb continuously a year. In Burundi, consumption per capita remains around 20 kWh per year and is one of the lowest value in East Africa and the world. In 2017, it represents 17 kWh for Burundi, 50 kWh in Rwanda, 68% in Uganda, 81 kWh in Ethiopia, 116 kWh in Tanzania, and 168 kWh in Kenya (We calculated the consumption per capita using data on electricity sector in the different countries and total population obtained from the WDI). Figure 3 shows that Kenya has the highest level of consumption per capita, followed by Tanzania. Statistics of the World Development indicators estimate the per capita consumption in SSA for 486 kWh in 2017. There is a long way for Burundi to reach this average.

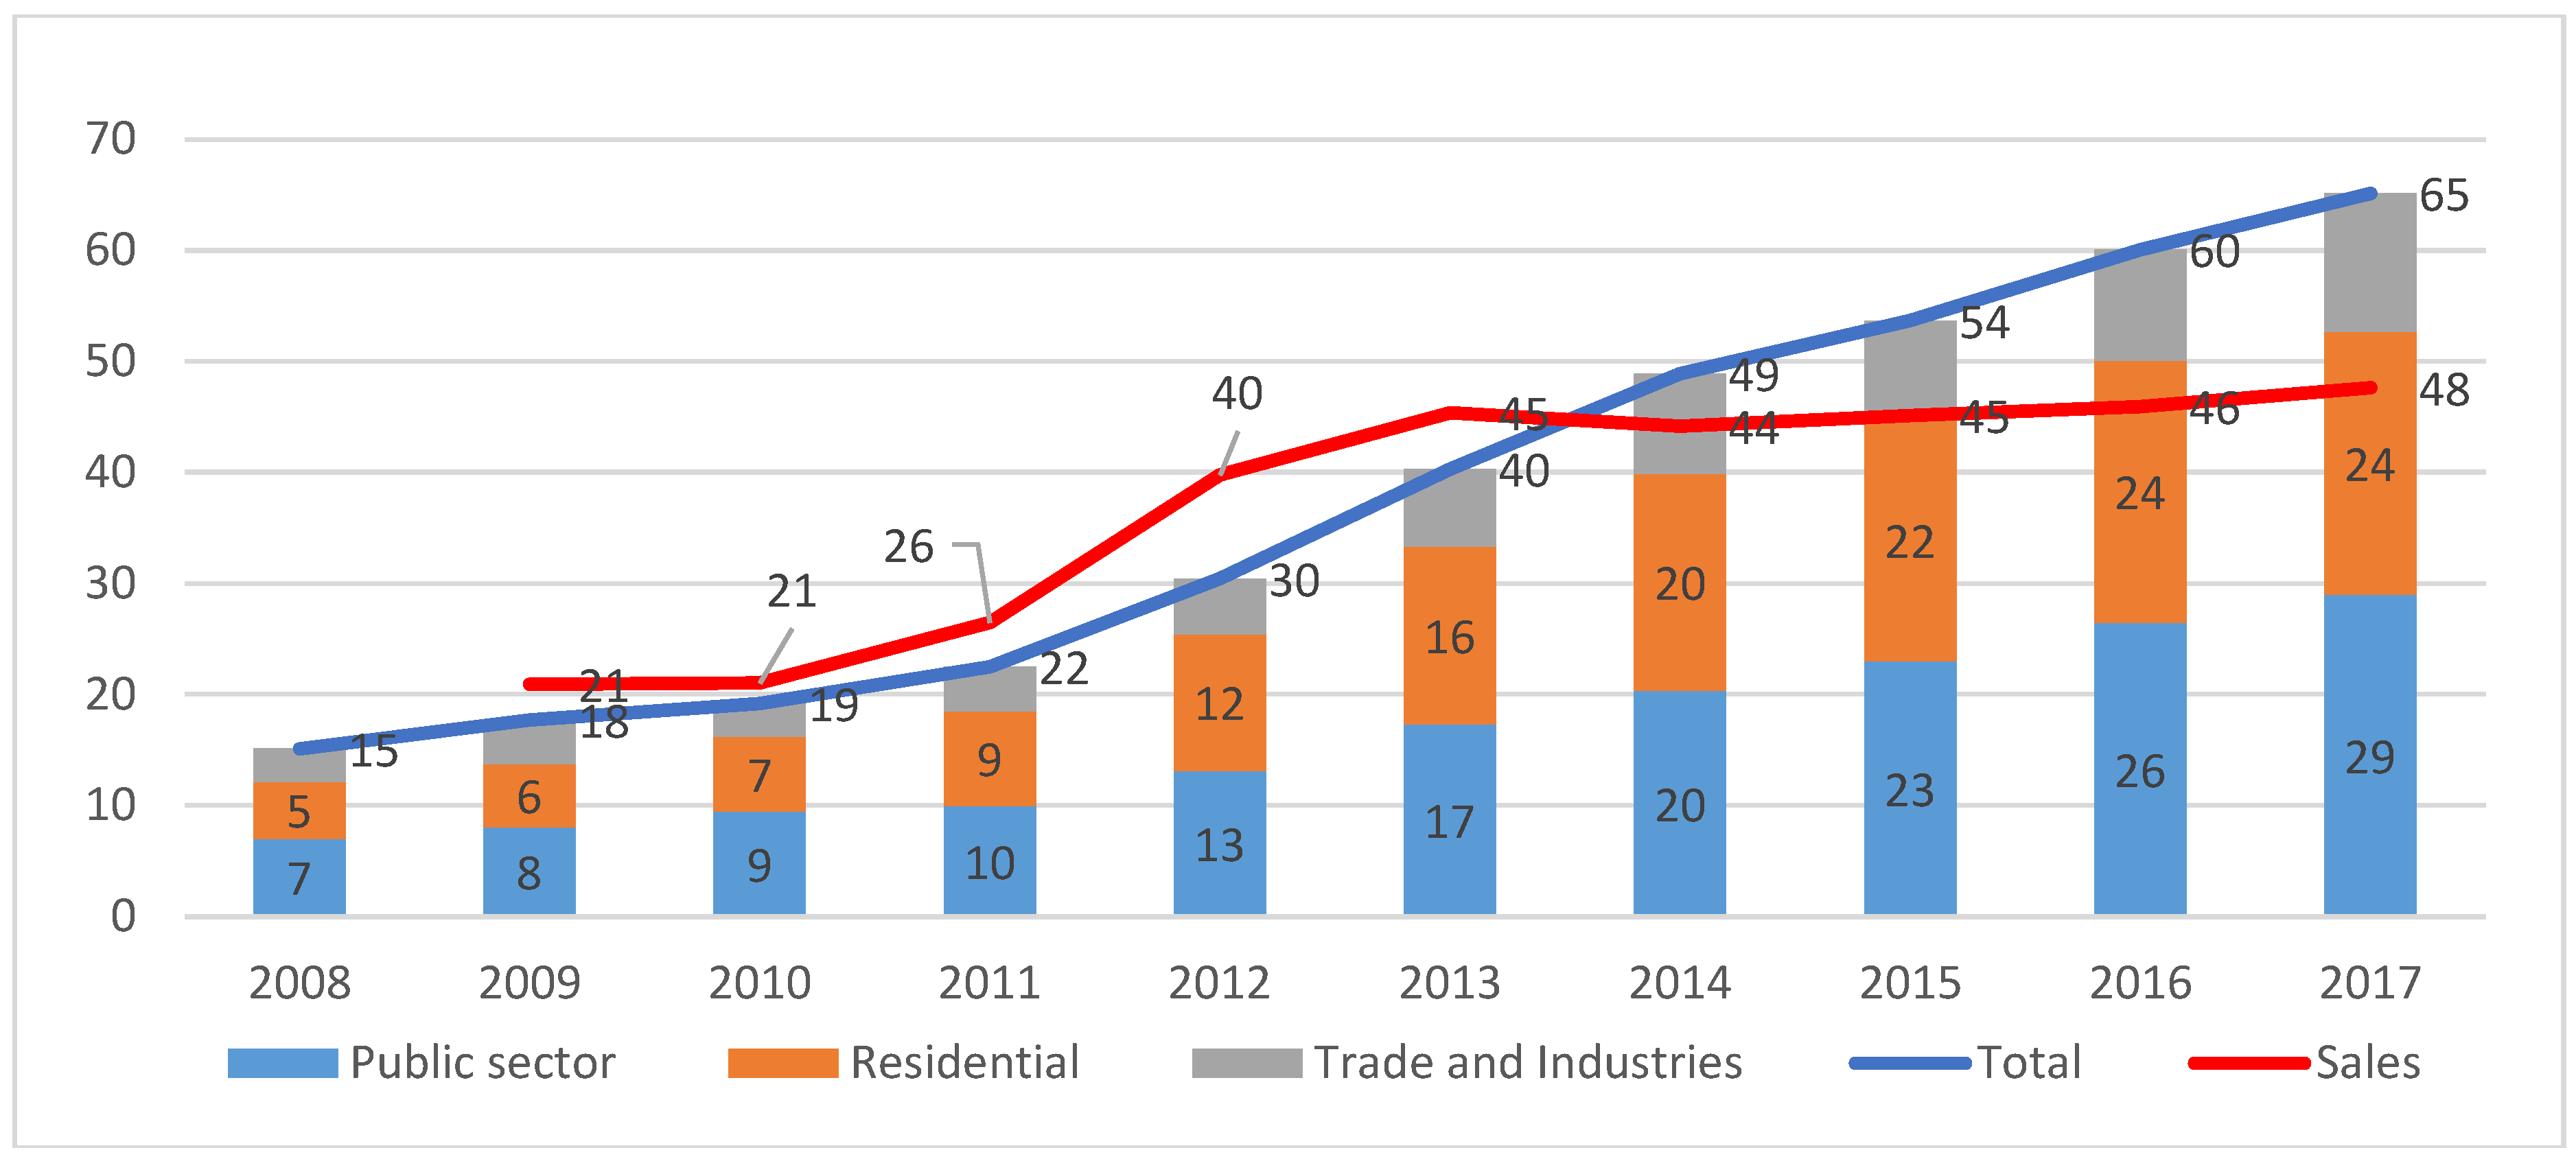
3.3.2. Electricity Losses

The literature distinguishes two types of electricity losses; technical and non-technical losses. The technical losses are due to the dissipation of electric energy through the transmission and distribution, such as poor equipment level, unbalanced loading, and heating insulation materials between conductors [19,20]. The non-technical losses are associated with the connections to the network, the system of metering, billing, or fraudulent behavior [19,20,21,22,23]. According to [24], power theft and unpaid bills are the major contributor to non-technical losses.
In Burundi, the transmission and distribution networks are the main causes of technical electricity losses in Burundi, which represented 24% of total supply in 2012 [7]. The low voltage of the lines, the lack of funds to rehabilitate, and invest in new transmission and distribution networks are among the main causes of technical losses. Ref. [15] recommends also to replace small section conductors and not to use them in future new lines.
In terms of non-technical losses, the public company has been unable to collect all bills which continue to increase, particularly for the public sector as shown in Figure 4. Especially, the unpaid bills exceed the total sales for REGIDESO from 2014 to 2017. Since 2009, the use of prepaid metering systems was generalized, which was successful to increase the performance in terms of tariff collection from 13.7% in 2008 to 41.7% in 2017. However, not all customers were connected with the new technology and still use the classic meters. Further, the new technology has not been applied to water utilities. Figure 4 shows the distribution of unpaid bills between public sector, residential, and trade and industrial customers.
It shows a high level of unpaid bills for the public sector and residential sector (the government debt includes those of ministries, public schools, military camps, and municipalities, personalized state administrations, and diplomatic missions. Debt for residential includes households and religious missions). Most unpaid bills are attributed to water, for which no prepaid meter technology has been implemented.
The high unpaid bills are associated with the bad financial position of the REGIDESO, which lack funds to rehabilitate the existing electricity network and to invest in the new generation, transmission, and distribution of electricity. REGIDESO is characterized by a high increase in charges, especially for manpower. The ratio for customer per employee passed from 59 to 84 and 28 and 44, respectively, for permanent and total employees in 2012 and 2017. For the same period, the ratio of manpower charges to value-added increased from 37% in 2012 to 91% in 2016 and 285% in 2017.
The high unpaid bills associated with the higher charges contribute to the circular debt [2]. As reported [24], the non-collection of all bills conducts the public utility to increase tariffs to recover losses. Since 2011 to 2017, tariffs were raised three times in 2011, 2012, and 2017, which resulted in under-consumption, as seen above.

4. Conclusions

The electricity sector in Burundi faces many challenges. In this paper, we described the electricity sector organization and the main institutions. Two acts have been promulgated to separate the public service of water and electricity, and to reorganize the electricity sector. However, the public company, REGIDESO, still remains the only provider of the two facilities in the main and secondary centers. This company failed to increase investment in generation, transmission, and distribution. Access to electricity remains very low compared to other countries in East Africa and SSA as a whole. The quality of service is also hampered by technical and non-technical losses. Especially, unpaid bills become more and more important, which increases the circular debt of the REGIDESO. Electricity sector challenges in Burundi can be classified into cyclical and structural causes. The cyclical challenges include internal and external crises, while the structural challenges result from the poor capacity to fund new infrastructure projects.
Since the 1990s, Burundi has faced a series of internal crises, such as the socio-political crisis of 1993–2005 and the post-electoral crisis of 2015. These crises delayed the planned infrastructures in power generation, transmission and distribution. Since 1988, a power master plan showed a number of hydroelectric projects to be commissioned later in 1998, especially in north-west and southern Burundi, coupled with the regional projects. The different hydroelectric plants would increase the installed capacity to more than 300 MW [14]. Since 2015, many bilateral and multilateral development financial institution were engaged to fund new energy infrastructures. However, the crisis of 2015 was followed by collapse in external aid. We cannot forget the effects of the financial crisis of 2008–2009, where Burundi suffered from the reduction in development aid. A similar case could occur with the current health crisis due to Corona Virus. Reference [25] estimated that a global recession seems to be inevitable, showing that each additional month of lockdown costs 2.5–3% of global GDP. Since most of the power plant projects undertaken rely on multilateral grant and loan, the current health crisis due to coronavirus could delay the planned projects.
According to the structural challenges, Burundi is classified among the poorest countries in the world. The GDP per capita remains below USD 300. The high connection charges and high tariffs of electricity could make it unaffordable for large part of population. It is also shown that the share of electricity consumed is higher for households than industrials [26]. In fact, most raw materials are imported. Due to the lack of foreign currencies, most industries do not function continuously. (Burundi faces a lack of foreign currencies. In its exchange market, the Central Bank rationalized the supply of external currencies by prioritizing imports of strategic products such as fuel, medicines, chemical fertilizers, and some other raw materials). All these factors contribute to under-consumption of electricity and increase in electricity losses. Non-technical losses are exacerbated by structural factors such as unpaid bills, especially for the public sector. Ref. [2] provides the main causes of inefficiencies, such as poor governance, red-tape, and political interference. In the REGIDESO, all members of the Board of Directors, the directorate general, and the directors, are all appointed by decree. Their power is limited as they can be licensed at any moment. Administrative instability can be also the basis of poor performance in the collection of unpaid bills. REGIDESO’s leaders should be appointed according to professional merit and political interference should be avoided to increase performance.
The public company faces to high charges, especially for manpower. With this situation, the REGIDESO cannot entertain its equipment, nor pay its debts. The government could pursue the liberalization and reorganization undertaken in 2000 and 2015. It should implement favorable investment climates, clear policy and regulatory frameworks, and local availability of cost-competitive fuels [27,28].
The National Development Plan (2018–2027) recommends to diversify the energy mix, largely dominated by the hydroelectric sector. This fuel resource may face high risks, such as supply failures, drought, increased losses on the transmission grid. The electricity generation may be diversified. Burundi may continue its interconnection program with the neighboring countries in order to import electricity and reduce technical losses. It has to prioritize regional projects for generation, transmission and cross-border trade. Further research could compare electricity sector efficiency in East Africa.

Funding

This research received no external funding.

Acknowledgments

This research has been conducted under the supervision of Axel Gautier and Charles Kabwigiri. The author would like to thank all people who contributed for the success of this work, and the anonymous peer reviewers and the editor for their comments and suggestions. However, all the views explained in this paper are those of the author and not for the supervisors or donor.

Conflicts of Interest

The author declares no conflict of interest.

References

  1. Carlsson, F.; Demeke, E.; Martinsson, P. Cost of Power Outages for Manufacturing Firms in Ethiopia: A Stated Preference Study. Energy Econ. 2018, 2473, 104753. [Google Scholar] [CrossRef]
  2. Das Valasai, G.; Uqaili, M.A.; Memon, H.U.R.; Samoo, S.R.; Mirjat, N.H.; Harijan, K. Overcoming electricity crisis in Pakistan: A review of sustainable electricity options. Renew. Sustain. Energy Rev. 2017, 72, 734–745. [Google Scholar] [CrossRef]
  3. Bongo, M.F.; Ocampo, L.A.; Magallano, Y.A.D.; Manaban, G.A.; Ramos, E.K.F. Input–output performance efficiency measurement of an electricity distribution utility using super-efficiency data envelopment analysis. Soft Comput. 2018, 22, 1–15. [Google Scholar] [CrossRef]
  4. Blimpo, M.; Mcrae, S.; Steinbuks, J. Electricity Access Charges and Tariff Structure in Sub-Saharan Africa; Africa Development Forum Series; The World Bank: Washington, DC, USA, 2017. [Google Scholar]
  5. Imam, M.I.; Jamasb, T.; Llorca, M. Sector reforms and institutional corruption: Evidence from electricity industry in Sub-Saharan Africa. Energy Policy 2019, 129, 532–545. [Google Scholar] [CrossRef]
  6. Ullah, K.; Arentsen, M.J.; Lovett, J.C. Institutional determinants of power sector reform in Pakistan. Energy Policy 2017, 102, 332–339. [Google Scholar] [CrossRef]
  7. Bamber, P.; Guinn, A.; Gereffi, G. Burundi in the Energy Global Value Chain: Skills for Private Sector Development. 2014. Available online: http://citeseerx.ist.psu.edu/viewdoc/download;jsessionid=67BBF65D6856DB9F76A550E053CFC323?doi=10.1.1.720.8019&rep=rep1&type=pdf (accessed on 18 April 2020).
  8. Bacon, R. Taking Stock of the Impact of Power Utility Reform in Developing Countries A Literature Review (No. 8460). World Bank Group, Energy and Extractives Global Practice. 2018. Available online: https://openknowledge.worldbank.org/handle/10986/29889 (accessed on 15 March 2020).
  9. Jamasb, T.; Nepal, R.; Timilsina, G.R. A Quarter Century Effort Yet to Come of Age: A Survey of Electricity Sector Reform in Developing Countries. Energy J. 2017, 38, 195–234. [Google Scholar] [CrossRef]
  10. Dertinger, A.; Hirth, L. Reforming the electric power industry in developing economies evidence on efficiency and electricity access outcomes. Energy Policy 2020, 139, 111348. [Google Scholar] [CrossRef]
  11. Nkama, H.G.; Nsabimana, R.; Ndayishimiye, L. Evaluation de l’Intégration du Burundi dans la Communauté d’Afrique de l’Est à travers le Développement des Infrastrucutres. Bujumbura. 2017. Available online: http://idec.org.bi/images/PDF/2017/mai/Evaluation_Intégration_Burundi_Communauté_Afrique_Est_travers_Développement_Infrastrucutres.pdf (accessed on 15 February 2020).
  12. Gratwick, K.N.; Eberhard, A. Demise of the standard model for power sector reform and the emergence of hybrid power markets. Energy Policy 2008, 36, 3948–3960. [Google Scholar] [CrossRef]
  13. Joskow, P.L. Electricity Sector Restructuring and Competition: Lessons Learned. Cuadernos de Economía 2003, 40, 548–558. Available online: http://web.a.ebscohost.com/ehost/pdfviewer/pdfviewer?vid=1&sid=6f22070b-e9b0-42f6-9983-3304f7b1d0ee%40sdc-v-sessmgr01 (accessed on 15 February 2020). [CrossRef]
  14. The World Bank. Burundi, Issues and Options in Energy Sector; The World Bank: Washington, DC, USA, 1992; Available online: http://documents.worldbank.org/curated/en/156331468770400328/pdf/multi-page.pdf (accessed on 19 April 2020).
  15. The World Bank. Sustainable Energy for All Technical Assistance Program (S-TAP) for Burundi Summary Report. 2019. Available online: http://documents.worldbank.org/curated/en/224921560147541144/Sustainable-Energy-for-All-Technical-Assistance-Program-S-TAP-for-Burundi-Summary-Report (accessed on 13 March 2020).
  16. Llorca, M.; Orea, L.; Pollitt, M.G. Efficiency and environmental factors in the US electricity transmission industry. Energy Econ. 2016, 55, 234–246. [Google Scholar] [CrossRef]
  17. Chakravorty, U.; Pelli, M.; Marchand, B.U. Does the quality of electricity matter? Evidence from rural India. J. Econ. Behav. Organ. 2014, 1, 1–20. [Google Scholar] [CrossRef]
  18. Vaninsky, A. Efficiency of electric power generation in the United States: Analysis and forecast based on data envelopment analysis. Energy Econ. 2006, 28, 326–338. [Google Scholar] [CrossRef]
  19. Jawad, Y.A.; Ayyash, I. Analyze the Loss of Electricity in Palestine. Case Study: Ramallah and Al-Bireh Governorate. Int. J. Energy Econ. Policy 2020, 10, 7–15. [Google Scholar] [CrossRef]
  20. Viegas, J.L.; Esteves, P.R.; Melício, R.; Mendes, V.M.F.; Vieira, S.M. Solutions for detection of non-technical losses in the electricity grid: A review. Renew. Sustain. Energy Rev. 2017, 80, 1256–1268. [Google Scholar] [CrossRef]
  21. Cambini, C.; Croce, A.; Fumagalli, E. Output-based incentive regulation in electricity distribution: Evidence from Italy. Energy Econ. 2014, 45, 205–216. [Google Scholar] [CrossRef]
  22. Fumagalli, E.; Schiavo LLo Delestre, F. Service Quality Regulation in Electricity Distribution and Retail; Springer: Berlin, Germany, 2007. [Google Scholar] [CrossRef]
  23. Smith, T.B. Electricity theft: a comparative analysis. Energy Policy 2004, 32, 2067–2076. [Google Scholar] [CrossRef]
  24. Tasdoven, H.; Fiedler, B.A.; Garayev, V. Improving electricity efficiency in Turkey by addressing illegal electricity consumption: A governance approach. Energy Policy 2012, 43, 226–234. [Google Scholar] [CrossRef]
  25. Fernandes, N. Economic Effects of Coronavirus Outbreak (COVID-19) on the World Economy. IESE Business School Working Paper No. WP-1240-E. Available online: https://ssrn.com/abstract=3557504 (accessed on 7 May 2020). [CrossRef]
  26. REN21. EAC Renewable Energy and Energy Efficiency, Regional Status Report. 2016. Available online: https://www.ren21.net/wp-content/uploads/2019/05/REN21-EAC-web-EN.pdf.pdf (accessed on 16 January 2020).
  27. Eberhard, A.; Gratwick, K.; Morella, E.; Antmann, P. Independent Power Projects in Sub-Saharan Africa: Investment trends and policy lessons. Energy Policy 2017, 108, 390–424. [Google Scholar] [CrossRef]
  28. Eberhard, A.; Gratwick, K.N. IPPs in Sub-Saharan Africa: Determinants of success. Energy Policy 2011. [Google Scholar] [CrossRef]
Figure 1. Electricity access in East Africa % (2017).
Proceedings 58 00026 g001
Figure 2. Electricity produced, consumed, and number of customers.
Proceedings 58 00026 g002
Figure 3. Evolution of electricity consumption per capita in East Africa.
Proceedings 58 00026 g003
Figure 4. Evolution of unpaid bills and sales in Billion BIF.
Proceedings 58 00026 g004
Table 1. Interconnected and off-grid network.
INTERCONNECTED NETWORK
Hydro Power PlantsLocation OwnerCommissioned YearInstalled Capacity (MW)
RweguraGitengeREGIDESO198618
MugereMugereREGIDESO19828
RuvyironzaRuvyironzaREGIDESO1980/19841.5
NyemangaSiguvyayeREGIDESO19882.8
GikongeMubaraziREGIDESO19821
KayenziKavurugaREGIDESO19840.8
MarangaraNdurumuREGIDESO19860.28
BuhigaNdurumuREGIDESO19840.47
Nyamyotsi REGIDESO 0.3
Total Hydro 33.15
Diesel Power Plant
5 MWBujumburaREGIDESO 5
5.5 MWBujumburaREGIDESO19965.5
LocationBujumburaInterpetrol2016–201720
Total0020Diesel power plants30.5
Total REGIDESO (I) 63.65
Imports
Ruzizi IIRusizi 198913
Ruzizi IRusizi 19583.5
Total imports (II) 16.5
INTERCONNECTED NETWORK (I+II)80.15
OFF-GRID NETWORK
KigwenaNzibweABER19840.062
ButeziSanzuABER19900.25
RyaruseraKagogoABER19840.32
NyabikereNyabisiABER19900.212
MuroreRusumoABER19870.024
KayongoziKayongoziABER20110.5
Total ABER 1.368
MugeraRuvyironzaPrivate19620.03
KirembaBuyangwePrivate19810.064
MasangoKitengePrivate19790.025
MusongatiNyamabuyePrivate19810.006
MutumbaKirasaPrivate19830.045
MpingaMukandaPrivate19830.016
TezaNyabigondoPrivate19710.36
KigandaMucecePrivate19840.044
GisoziKayokwePrivate19830.015
BurasiraRuvubuPrivate19610.025
Total Private - -0.63
Total OFF-GRID 1.998
TOTAL INSTALLED CAPACITY 82.148
Table 2. Power projects and financing (source: The World Bank, 2019).
PlantFuelInstalled Capacity (MW)FinancingCommission
MpandaHydro10.4Burundian Government2021
Kabu 16Hydro20Exim Bank of India2021
Jiji-MulembweHydro49WB, AfDB, EU, EIB2024
Kagu 006Hydro8PPP Swedenergy2023
Solar projectsSolar7.5PPP Gigawatt Global2019
Peat Power ProjectPeat15PPP with BUCECO2020
RuzibaziHydro15Chinese Government2022
Rusumo Falls Hydro26.6World Bank, AfDB2021
Ruzizi III Hydro49WB, AfDB, EU, EIB2024
Imports from Ethiopia200Burundian Government2020
Total 400.5
Table 3. Transmission and distribution line length by voltage level (Source: REGIDESO).
Year110 kV70 kV35 kV6.6k V–30 kV220 V–400 VTOTAL
1956011200.000.00112.00
1982011215208.20206.60541.80
198413811215420.87462.891148.76
198613811215420.87462.891148.76
199121011215420.87462.891220.76
200721011215782.44462.891582.33
200821011215897.64462.891697.53
200921011215992.64462.891792.53
2010210112151331.14462.892131.03
2011210112151361.59504.682203.26
2012210112151367.13526.372230.49
2013210112151367.13526.372230.49
2014210112151367.13526.372230.49
2015210112151367.19582.032286.22
2016210112151381.75593.512312.26
2017210112151383.38595.942316.32
2018210112151396.47610.192343.66
Publisher’s Note: MDPI stays neutral with regard to jurisdictional claims in published maps and institutional affiliations.

