Proceeding Paper

Variation of the Nutritional Composition of Quinoa According to the Processing Used †

Laboratorio de Investigación en Nutrición Aplicada, Facultad de Ciencias de la Nutrición Universidad Juan Agustín Maza, Lateral Sur del Acceso Este 2245 Dorrego Guaymallén Mendoza, CP 5519, Argentina
*
Author to whom correspondence should be addressed.
Presented at the 2nd International Conference of Ia ValSe-Food Network, Lisbon, Portugal, 21–22 October 2019.
Proceedings 2020, 53(1), 4; https://doi.org/10.3390/proceedings2020053004
Published: 4 August 2020
(This article belongs to the Proceedings of The 2nd International Conference of Ia ValSe-Food Network)

Abstract

:
Quinoa is consumed as a seed, flour, expanded, sprout (germinated) and activated (hydrated). The objective of this work was to determine the nutritional composition of the different preparations. The same batch of quinoa seeds was processed as flour, expanded, hydrated and germinated. It showed that there is a statistically significant difference of nutrients between all groups. For proteins, it varies from 12.78 ± 0.02 g/100 g in whole seed to 5.25 ± 0.01 g/100 g in the hydrated seed. In total fats, it varies from 7.80 ± 0.02 g/100 g in flour to 0.72 ± 0.01 g/100 g in sprouts. For fiber, the germinated quinoa provides the highest content (23.50 ± 0.01 g/100 g), whereas the hydrated quinoa the lowest content (8.71 ± 0.02 g/100 g). This shows how different preparations influence the nutritional contribution of quinoa. With this information, one can recommend different types of preparations depending on the type of nutrient that is wanted for consumption.

1. Introduction

According to Food and Agriculture Organization of the United Nations FAO [1], quinoa (Chenopodium quinoa Willd.) is a millenary crop that contributes to world food security. The protein content varies from 13 to 21% depending on the variety; it’s essential amino acids profile is one of the most complete in the vegetable kingdom. That makes it an ideal food for populations with protein malnutrition [1]. Quinoa has an adequate content of dietary fiber, which decreases grain digestibility. The fiber contributes to granting satiety. It has been shown that the fatty acids of quinoa maintain quality due to the high natural value of vitamin E, which acts as a natural antioxidant [2]. Quinoa provides omega 6 polyunsaturated fatty acids (50% of their fat content) and omega 9 monounsaturated fatty acids (25% of their fat content) [3].
In Argentina, it is cultivated especially in the northwest; however, in the area of Mendoza, the crop shows good yields. Due to the type of harvest, it is ideal for small-scale production, benefiting small producers. In this context, Juan A. Maza University, the Provincial Legislature and the Family Agriculture Secretary of National Government are working on a project of the agronomist engineer Amanda Di Fabio [4].
In a global context with a strong demand for natural and nutritious products, quinoa is one of the Andean and ancestral crops most requested by consumers and with better economic prospects in recent years [5].
It is consumed as a seed, flour, expanded, sprout (germinated) and activated (hydrated). The popular belief is that all these forms have the same nutritional contribution. Taking into account this belief, the objective of this work was to determine the nutritional composition of the different forms of preparation for consumption of this grain.

2. Materials and Methods

This study was based on the same lot of quinoa, purchased from a local producer, which was washed, dried and free of saponins [6].

2.1. Ways of Preparation

Quinoa seed: It was washed and dried. This form of consumption is common.
Quinoa flour: The seed was grounded until a granulometry of 60 meshes (0.25 mm) was reached. In the present study, a laboratory mill was used and sieved prior to its analysis.
Activated quinoa (hydrated): Quinoa seeds were placed in water, at a room temperature of 20–25 °C, in a ratio of 1 part of seeds to 3 parts of water. They were left for 5 h. Then they were drained, cooked and used in different preparations. This method is common among vegans and vegetarians.
Quinoa was moistened overnight, drained, and placed in a glass jar upside down with a canvas as a lid for breathing. The next day it was moistened, drained and left face down again. The bottle was placed in the light and within 3 days the seeds began to sprout.
Expanded quinoa: A frying pan was heated over direct heat, with a small amount of oil. Quinoa seeds were added and after 5 min, they began to expand. The pan was removed from heat and the rest of the grains expanded.

2.2. Laboratory Analysis

To determine the nutritional composition of the different preparations of quinoa, the following laboratory determinations were made:
Humidity: Method of A.O.A.C 950.46. This was an indirect method that involved drying in an oven at 100–105 energy value (kcal) = (protein × 4) + (carbohydrates × 4) + (fat × 9). C, until constant weight was achieved.
Total fats: The direct method by extraction with ethyl ether (crude fat), Soxhlet gravimetric method (A.O.A.C. 960.39, 1990) was used.
Fibers: Dietary fiber (AOAC, 15th edition 1990) [7] was used.
Crude protein: The Kjeldahl method, (A.O.A.C. 928.08, 1990), determining nitrogen, using 6.25 as a protein conversion factor, was used.
Ashes: The direct Method (A.O.A.C. 923.03, 1990), involving incineration in a muffle (at 500 ± 10 Energy value (kcal) = (protein × 4) + (carbohydrates × 4) + (fat × 9). C), until constant ash weight was achieved, was used.
Carbohydrates: Carbohydrates were determined by difference, using the following formula:
100 − (Weight in grams [protein + fat + water + ash + fibers]), in 100 g of food.
Energy value: Energy value was calculated according the following equation:
Energy value (kcal) = (protein × 4) + (carbohydrates × 4) + (fat × 9).
The conversion is 2000 kcal = 8400 kJ.

2.3. Statistical Analysis

The same batch of quinoa was taken and processed (treatment) as flour, expanded, hydrated and sprout. The samples were analyzed in triplicate. For the statistical analysis, ANOVA was applied first and then a multiple comparison test was applied to discriminate between the means, and the honestly significant difference procedure (HSD) of Tukey was also applied.

3. Results

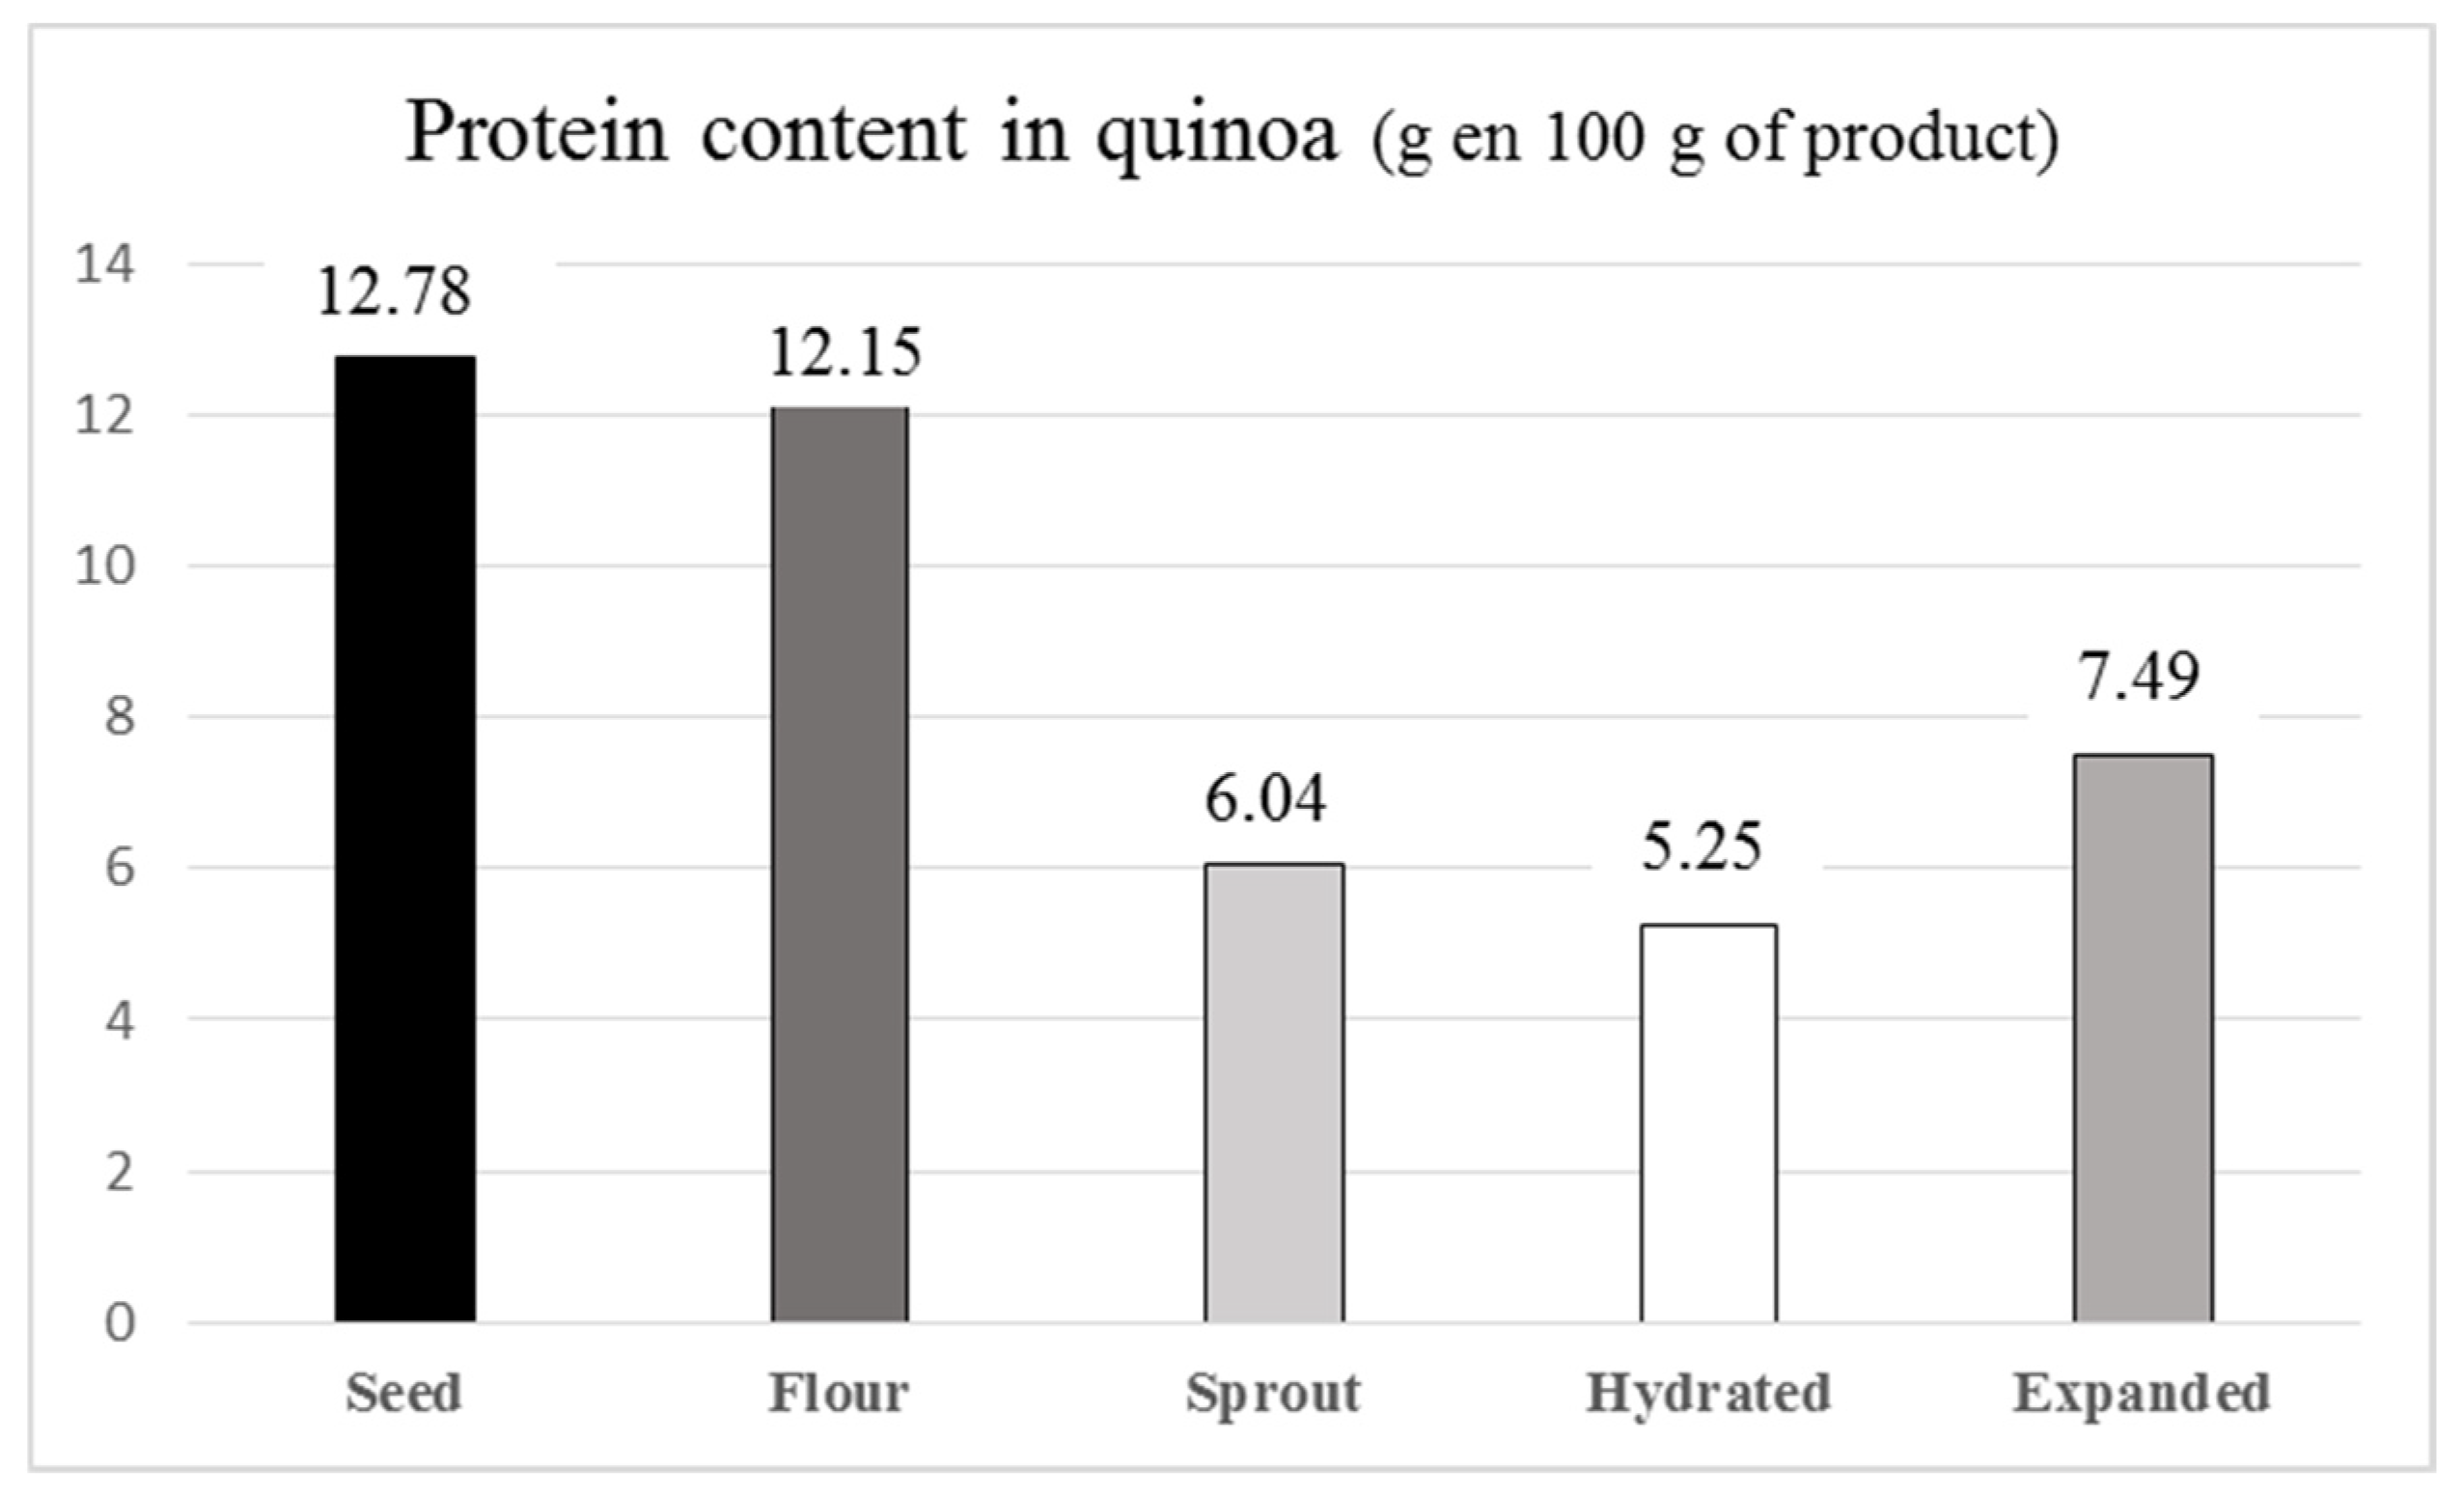
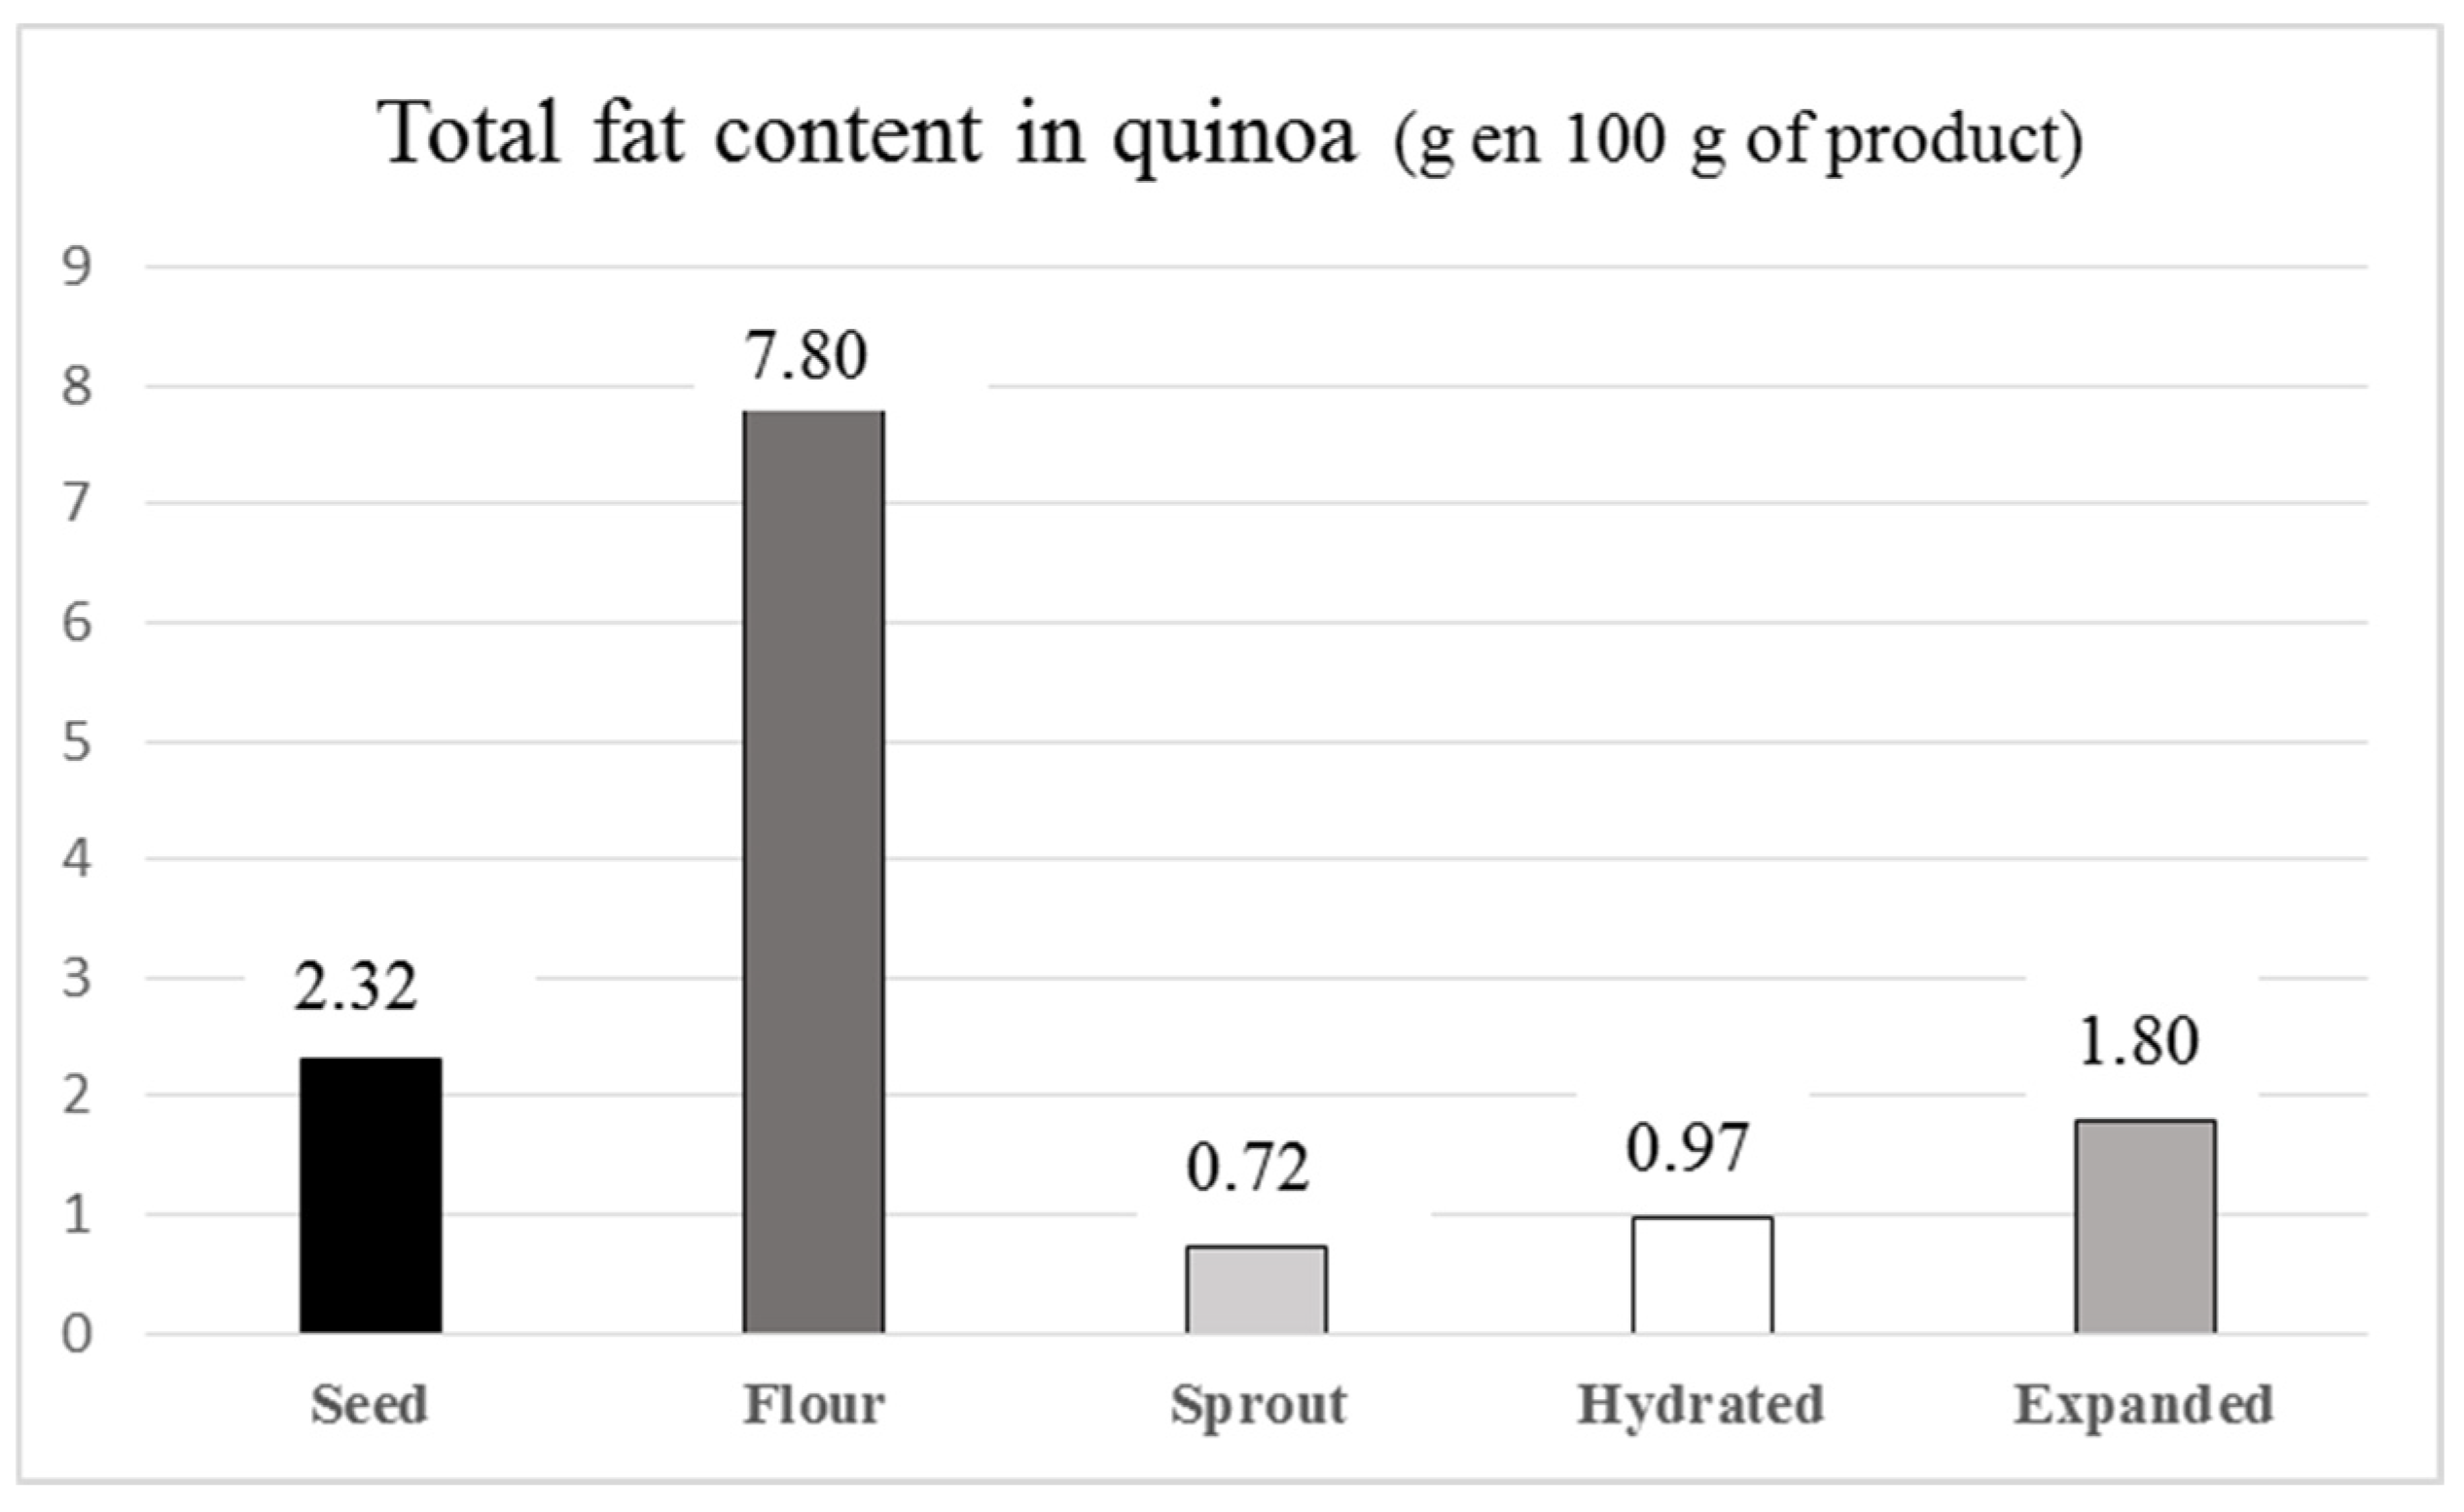
3.1. Nutrients Content for Each Type of Preparation

There were statistically significant differences (a < 0.05) between the nutrients of each type of preparation (seeds, sprouts, expanded, hydrated and flour).
A statistically significant difference was shown between all groups of nutrients. For proteins, it varied from 12.78 ± 0.02 g/100 g in whole seeds to 5.25 ± 0.01 g/100 g in the hydrated seed (Figure 1). In total fats, it varied from 7.80 ± 0.02 g/100 g in flour to 0.72 ± 0.01 g/100 g in sprout (Figure 2). For fiber, the germinated quinoa provided the highest content (23.50 ± 0.01 g/100 g) and the hydrated the lowest content (8.71 ± 0.02 g/100 g). The energy value was (kJ/100 g): whole seed 1299, flour 1430, germinated 291, hydrated 594 and expanded 1368 (See Table 1).

3.2. Statistical Analysis of the Data

The ANOVA statistical test was applied to analyze differences in means, and the HSD Tukey Multiple Ranges test was subsequently applied to analyze the difference between groups. The ANOVA result was statistically significant (p = 0.000) for all the variables analyzed (protein, carbohydrates, total fat, saturated fat, ash, fiber, moisture, sodium, and energy value).
The HSD Tukey Multiple Range test gave the following results:
Proteins: showed statistically significant differences between all levels, with the whole grain being the one with the highest content and the activated seed being the one with the lowest content.
Carbohydrates: showed statistically significant differences between all levels, with the expanded being the one with the highest content and the outbreak being the one with the lowest content.
Total fats: showed statistically significant differences between all levels, with the flour being the one with the highest content and the sprout with the lowest content.
Saturated fats: There were three homogeneous levels (sprout-activated-expanded) and this group showed statistically significant differences with flour and grain levels. The flour was the one with the highest content and (sprout-activated-expanded) the one with the lowest content.
Ash: There were two homogeneous levels (activated-expanded) and this group showed statistically significant differences with the flour, sprout and grain levels.
Humidity: There were two homogeneous levels (flour-grain) and this group showed statistically significant differences with the outbreak levels, activated and expanded. The outbreak was the one with the highest content and the expanded one with the least content.
Fiber: They showed statistically significant differences between all levels, the sprout being the one with the highest content and the activated seed the one with the lowest content.
Energy value: They showed statistically significant differences between all levels, the flour being the one with the highest content and the sprouts with the lowest content.

4. Discussion

The values found for the whole seeds are similar to those of the bibliography [8], except the fat content, which showed to be lower, since the grain was not ground for its determination. The determination of lipids was done in this way to simulate what would happen at the digestive level if the cuticles of the seed were not to be destroyed in the stomach. In the case of flour, the values are similar to those in the literature [1,8]. By making the lipid fraction more bioavailable, the energy contribution increases.
During the germination process, (quinoa sprout) nutrients diminished and the proportion of fiber increased, which made it ideal to grant satiety.
When the quinoa seed was placed in water (activated quinoa) it was hydrated by 205%, which meant that the content of all nutrients was reduced.
Finally, expanded quinoa increased its carbohydrate content, decreasing its protein and lipid value, and maintaining its fiber content.

5. Conclusions

This shows how different preparations influence the nutritional contribution of quinoa. With this information, it is possible to recommend different types of preparations depending on the type of nutrients that are relevant to add in a diet plan and wanted for consumption.

Funding

This research received no external funding.

Acknowledgments

This work was supported by Ia ValSe-Food-CYTED grant (119RT0567) and Juan Agustín Maza University.

References

  1. FAO. 2011, La Quinua: Cultivo Milenario Para Contribuir a la Seguridad Alimentaria Mundial. Available online: http://www.fao.org/3/aq287s/aq287s.pdf (accessed on 8 May 2019).
  2. Su-Chuen Ng Anderson, A.; Cokera, J.; Ondrusa, M. Characterization of lipid oxidation products in quinoa (Chenopodium quinoa). Food Chem. 2007, 101, 185–192. [Google Scholar] [CrossRef]
  3. Delatorre-Herrera, J.; Sánchez, M.; Delfino, I.; Oliva, M.I. La quinua (Chenopodium quinoa Willd.), un tesoro andino para el mundo. Idesia (Arica) 2013, 31, 111–114. [Google Scholar] [CrossRef]
  4. Di Fabio, A. Proyecto de Producción, Comercialización y Promoción del Consumo de Quinoa en el Oasis Norte de Mendoza. 2018. Available online: https://www.legislaturamendoza.gov.ar/wp-content/uploads/2018/03/proyecto-de-quinoa-mdz-compressed.pdf (accessed on 8 May 2019).
  5. INTA. 2012. Available online: http://intainforma.inta.gov.ar/?p=12134 (accessed on 8 May 2019).
  6. Ahumada, A.; Ortega, A.; Chito, D.; Benítez, R. Saponinas de quinua (Chenopodium quinoa Willd.): Un subproducto con alto potencial biológico. Rev. Colomb. Cienc. Quím. Farm. 2016, 45, 438–469. [Google Scholar] [CrossRef]
  7. AOAC Official Methods of Analysis. 1990. Available online: https://archive.org/stream/gov.law.aoac.methods.1.1990/aoac.methods.1.1990_djvu.txt (accessed on 24 April 2019).
  8. INTA (Valerio Alejandro). Ciencia y tecnología de los cultivos industriales, Quinua. Año 3, N° 5—2013. ISSN 1853-7677. 2013. Available online: https://inta.gob.ar/sites/default/files/script-tmp-inta-revista-ciencia-y-tecnologa-de-los-cultivos-indu_4.pdf (accessed on 8 May 2019).
Figure 1. Content of proteins in quinoa for each of the treatments.
Proceedings 53 00004 g001
Figure 2. Content of total fat in quinoa for each of the treatments.
Proceedings 53 00004 g002
Table 1. Centesimal composition of quinoa, for different forms of preparation a.
SeedFlourSproutHydratedExpandedANOVA
p
Carbohydrates59.36(0.05)55.42(0.01)9.64 c(0.04)27.94(0.03)69.86 b(0.02)0.000
Saturated fats0.26(0.01)0.86 b(0.02)0.08 c(0.00)0.11(0.00)0.06(0.01)0.000
Trans fatn.d. dn.d. dn.d. dn.d. dn.d. d0.000
Ashes2.23(0.02)2.29 b(0.01)0.93 c(0.01)1.22(0.01)1.22(0.01)0.000
Humidity10.64(0.02)10.63(0.01)59.16 b(0.01)55.91(0.01)7.00 c(0.01)0.000
Dietary fiber12.68(0.01)11.71(0.02)23.50 b(0.01)8.71 c(0.02)12.63(0.01)0.000
Energy value kcal309(0.5)341 b(0.5)69 c(0.0)141(0.6)326(0.6)0.000
Energy value kJ1299(0.5)1430 b(0.0)291 c(0.6)594(0.6)1368(0.6)0.000
a Mean (SD); b Indicates the highest value; c Indicates the lowest value; d n.d., not detected.
Publisher’s Note: MDPI stays neutral with regard to jurisdictional claims in published maps and institutional affiliations.

