Abstract
Passing a ball is a central aspect in the game of American Football. However, current passing machines do not fulfill the high quality standards for adequate catch training. The goal was to realize a passing machine that could do precise and accurate passes in a fully automated way in order to create high quality automated catch training. Automation was carried out to a degree that the release angle in terms of azimuth and elevation, release velocity and the release spin of the ball could be controlled via a wireless device within a reasonable range. Additionally, a pass prediction model was developed to determine where the pass went to and which height to catch it by least squares fit of 225 sample points with a second order function (). Normalized precision and accuracy of the machine were verified in an experiment with precision being less than 1% and accuracy less than 3% for more than 90% of all relevant passes.
1. Introduction
Passing is a major part of most ball related team sports such as rugby, soccer, handball or American Football. During the last forty years, researchers have tried to understand the physics of a pass with various ball shapes and under various conditions [1,2,3,4]. For most sports, the findings of the mentioned research and the given technology have led to the creation of passing or pitching machines that are used in the state of the art training of athletes (e.g., baseball and soccer). In American Football, passing machines (e.g., [5]) are a part of the training equipment although interviews with coaches and players showed that the machines are used rarely due to the lack of usability, precision and accuracy. Increasing the passing performance of the machines to the level of a highly skilled human quarterback (QB) is therefore necessary to have better catch training in American football.
Improving the pass performance of machines to be competitive with a QB needs an evaluation of the passes. In American Football an ideal QB always throws passes of highest quality without any dependencies to his and/or the surrounding conditions. A QB’s throw towards a receiver can be evaluated with the variables of precision, accuracy, velocity and spin. Precision, as the repeatability of a pass, and accuracy, as a trueness of a pass relative to the aimed spot, must be seen in context to the throwing distance since deeper passes have a long hang time and therefore the receiver is able to compensate for the scattering of the passes better. Velocity as a pass quality criterion is dependent on the pass type. Receiving players who run short routes (e.g., slant, in, post), often demand shallow passes with high velocity so the defending players have less time to intercept the pass. Short but arching passes (e.g., for a screen pass) sometimes have a lower velocity but high spin. Spin is a stabilizing factor for the trajectory of the pass, which means that passes with low spin can be considered as low quality passes. All of the aforementioned quality criteria have many dependencies. The major dependencies are the QB’s skills, but additionally his internal and surrounding conditions are factors for the QB’s passing performance.
Fatigue appears in every sport on many different levels. The passing performance is prone to mental and physical fatigue in all sports with immanent passing. In American Football the mental stress to get sacked by the defense affects the passing performance additionally [6,7]. In training, passing is piled on the QB but catching is distributed to many receiving players; physical fatigue is much more relevant for the QB’s arm, shoulder and trunk muscles than for receiving players. All of these circumstances lead to a limited number of high quality passes per training. With an adequate passing machine that has at least the same accuracy and precision as a QB this bottleneck can be solved and the QB can be relieved.
State of the art passing machines in American Football do not fulfill the required performance criteria to support training adequately according to the statements of players and coaches. The lack of such machines was the motivation for this project. The following goals were set to have a passing machine that excels a highly skilled human quarterback with respect to accuracy and precision:
- Develop a passing machine that meets the criterion that 90% of all relevant passes scatter within ±1% of the thrown distance.
- Develop a pass distance prediction model that can be applied to the passing machine that predicts the real pass distance within ±3% for 90% of all relevant passes.
2. Materials and Methods
The first step to reach the aforementioned goals was to design a passing machine based on the state of the art machine of that time but that operated completely atomized. This was necessary to limit the external disturbances in the passing process that appeared, e.g., when feeding the football to the machine manually. This atomization also led to many possibilities to autonomously influence the trajectory of a pass and therefore the targeted catching point but how this relation worked in detail was unknown at that point.
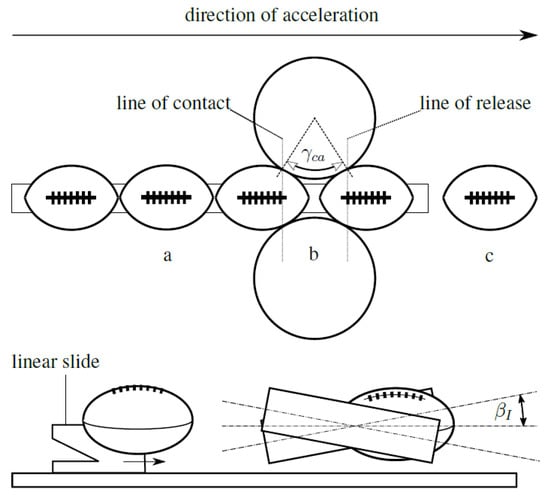
To better understand the passing process, from feeding the ball to catching the pass for the newly designed machine, the process was broken up into three phases as shown in Figure 1. During the delivery phase, the football is delivered with a constant velocity to the narrowing formed by the flywheels. As soon as the football is in contact with the flywheels the friction between them leads to an acceleration of the football, hence this phase is named the acceleration phase. At some point there is no contact between the football and the flywheels any more. The football is now released and in the free flight phase.

Figure 1.
Three phases of the acceleration process, a: delivery phase, b: contact phase, c: free flight phase. The figure shows one ball at equidistant time steps of the process. Therefore, it can be seen that the ball is faster in phase b and c than in phase a.
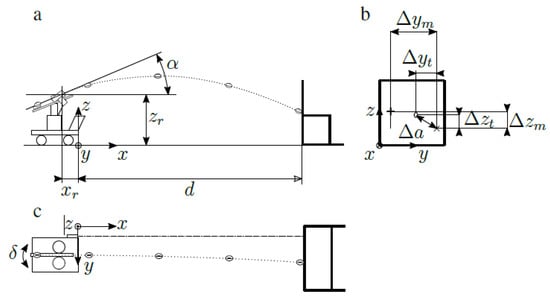
The apparatus that takes care of the passing process is called the launch unit and was orientated in space with additional motors (the relevant parameter for the orientation is described in Figure 2). This orientation of the launch unit in space led to some initial conditions for the trajectory. Nevertheless, the condition of the initial speed of the football at the time of release was unclear. An experiment [8] found a way to predict the initial speed based on the machine settings.

Figure 2.
The schematic experiment setup with the passing machine and the target as (a): side view, (b): front view and (c): top view. + marks the reference point on the target that was used to align the machine and the target wall. The dashed and dotted line indicates the laser that was used for alignment. marks the first impact point of one sample. 0 marks the mean first point of impact for a set of samples with the same and . In (b) the target can be observed with as the distance between 0 and . The dotted line indicates the trajectory.
Parameters such as as the rotational speed of the flywheels, as the elevation angle, as tilt angle, as the contact angle and as the azimuth angle can be chosen as machine settings. During the design of the machine, the focus lay on dampening the disturbances on the passing process (e.g., vibration due to imbalances of the flywheels, homogeneous rubber material on the flywheels and play in positioning motors). Due to the damped disturbances, a good precision was expected. After the assembly of the machine and some optimizations, the precision was checked for some pass scenarios. Based on the findings within these scenarios, an experiment was designed to verify precision and to gain data for the development of an accurate pass distance prediction model.
Design of Experiments
The basic idea for the experiment was that every pass can be seen as a relation between the input parameters () and the catching point in space (pass distance , catching height and catching angle in cylindrical coordinates). As the relation reflects a multidimensional input and a three-dimensional output with a respective range for the outputs, the necessary amount of data for a reasonable regression would be too large for a reasonable experiment.
Therefore, the input variables were limited to the rotational speed of the flywheels and the elevation angle Additionally, the output space was simplified from three-dimensional to one-dimensional, with the pass distance . This was possible with the use of a trajectory extrapolation for all passes to a catching height of 1 m. The catch angle was highly dependent on the azimuth , which was set as 0° constantly for the experiment. Therefore, the catch angle could be estimated close to 0° as well. By measuring the point of impact at a target wall that was exactly the distance away, the pass distance could be calculated due to geometric relations and, as already mentioned, extrapolation of the fitted trajectory for each sampled pass. The approach resulted in the functional relation as .
The first approach to calculate the extrapolation was to model each of the phases in the passing process. After reviewing the first two phases in the passing process, it was decided to use the model that was developed in [8] to determine the conditions at release time. These conditions served in the free flight phase as initial conditions of the model that described the trajectory. The trajectory could be modeled simply mechanically, neglecting aerodynamic interactions, with:
where as gravity with , as the vertical component, as the horizontal component of the point of release according to Figure 2, as the release speed of the ball, as the vertical position and as the horizontal position of the ball.
For an extrapolation with Equation (1) it was necessary to know the initial conditions of the pass and at least two points in space on the trajectory where one point was preferably close to the designated catching point in space and the other point was the release point of the pass. Therefore, the idea was to pass the football (a slightly used Wilson NCAA GST 1003) and measure the impact point on a target wall (see Figure 2). To minimize the disturbances, indoor tests with almost windless conditions were chosen. In addition, a checklist was used for the test procedure to ensure there were stable conditions. In this process, the ball was inspected for every throw concerning its surface (dryness, damages), orientation and pressure to decrease the impact of disturbances as much as reasonably possible.
Samples were taken (15 for each set of parameters) for each pair of parameters within and , which led to 225 data points. Figure 2 shows the experimental setup. The samples were processed to get the normalized precision () and pass distance accuracy () with as the forecasted pass distance with of 1 m. was forecasted with a polynomial ansatz of a second order and and as input variables according to:
3. Results
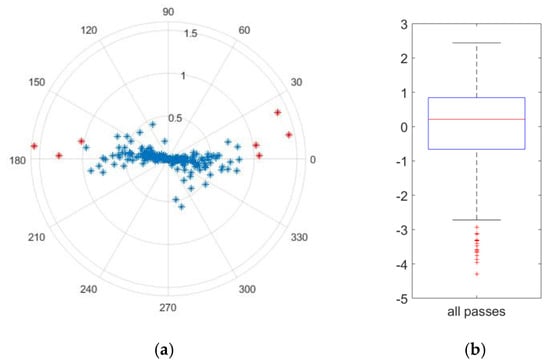
The results showed that the first goal for an adequately precise passing machine was met with 218 of 225 passes (more than 90%), which were within ±1%. Figure 3a reflects the evaluation. As the second goal was to develop a pass distance prediction model, Equation (2) was used to fit the data with the result that 209 of 225 passes were within the limits of ±3%. Figure 3b shows the corresponding data, which were based on the parameters in Table 1.

Figure 3.
The normalized precision (a) in % on the r-coordinate. The passes that exceeded the limit of 1% are marked in red. The accuracy of the pass distance prediction is shown in % in (b). The parameters used for the forecast are listed in Table 1.

Table 1.
Parameters of the pass distance forecast according to Equation (2) confidence bounds of 95%.
4. Discussion
In this section the method, different approaches in the experiment, their limitations and the results are discussed.
4.1. Limitation of Method, Fitting Approach and Extrapolation
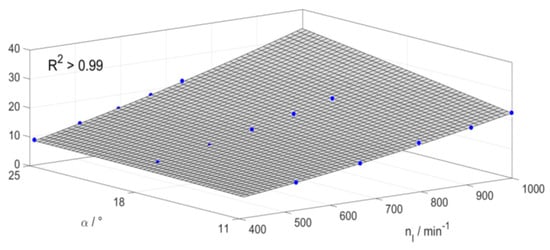
The results can be seen as valid within the range of the input variables. In addition, inputs that lay between the sampled points resulted in trustworthy results due to the smooth surface of the function, which can be observed in Figure 4. Outside of the given range, the function will deliver more inaccurate results and the limit, which is given with ±3%, is not given any more.

Figure 4.
According to Equation (2) the fit shows a high degree of determination with .
For a better prediction of the pass distance outside the given range of and , the parameter can be forced to zero. That is the same as adding an additional forced point to the fitting process, where the pass distance is zero if and are zero. Since this paper focuses on the prediction of the passes within the boundaries, this approach was considered but not seen as suitable.
In addition, the method of fitting the approach with a polynom of a second order works well for distances within the given range and is a reasonable approach. Of course, it would be possible to use higher order polynoms or other fitting functions that would result in a better fit, but this would not reflect the physical nature of the pass and the fit would be prone to an overfitting problem.
The data, which was derived of the experiment, were processed with an extrapolation according to Equation (1). Again, there are more precise models to use for the extrapolation but in this project it was not reasonable to use them. The additional effort for the experiment in terms of additional measurement equipment, a widely increasing number of passes and the computational work was not worth the very limited increase in accuracy. Arguably, an accuracy of ±3% for 90% of the passes is much more accurate than necessary for high quality training with athletes.
All of the measurements were executed with one football (Wilson GST 1003), so the results can be reproduced with this type of football. If another type of football (e.g., Wilson NFL the Duke) is used, the result may vary. However, the possibility to adapt the pass distance prediction to other football types is given, if the same method and experiment is done with another type of football.
4.2. Results
Figure 3a shows a notably wider distribution in the horizontal direction. The reasons for this were several disturbances that could not be reasonably damped further, e.g., the azimuth was controlled with an electrical drive and a gear box, and the nature of this setup meant there was some play in the angle. The play was measured with approximately 1°, which affected the precision in a worst case scenario with 0.87%. This just shows that the precision was not yet optimal but in this project there was no further need for improvement since the precision was already sufficiently good for training.
5. Conclusions
With the aforementioned development of the American Football passing machine, it is possible to perform at least as well as a QB in terms of accuracy and precision, as can be seen in the Supplementary Materials. In the field of sport science, the findings open up new possibilities for research, because catching can now be monitored under stable conditions for the passer (hand-eye coordination, motion and performance analysis). In addition, new possibilities open up within training of athletes. The passing machine can be set as mandatory for the specific training outcome, e.g., it is possible to execute passes with a randomized release time, preconfigured scattering or suchlike. The machine can be seen as foundation for further research in several fields.
Supplementary Materials
A video, which summarizes the performance of the passing machine, can be accessed via https://www.youtube.com/watch?v=YwdwJTIHpOc&feature=youtu.be.
Funding
This research received no external funding.
Acknowledgments
The authors are grateful to Jan Eisenbraun, the main pass receiver during the testing phase of the machine. The authors thank the football team of the SWARCO Raiders for their major support during the design process of this machine.
Conflicts of Interest
The authors declare no conflict of interest.
References
- Rae, W.J.; Streit, R.J. Wind-tunnel measurements of the aerodynamic loads on an American football. Sports Eng. 2002, 5, 165–172. [Google Scholar] [CrossRef]
- Rae, W.J. Flight dynamics of an American football in a forward pass. Sports Eng. 2003, 149–163. [Google Scholar] [CrossRef]
- Cunningham, J.; Dowell, L. The effect of air resistance on three types of football trajectories. Res. Q. Am. Alliance Health Phys. Educ. Recreat. 1976, 47, 852–854. [Google Scholar] [CrossRef]
- Ward, M.; Passmore, M.; Spencer, A.; Tuplin, S.; Harland, A. Characterisation of football trajectories for assessing flight performance. Proc. Inst. Mech. Eng. Part P J. Sports Eng. Technol. 2019, 233, 16–26. [Google Scholar] [CrossRef]
- Barron, C. Ball Throwing Apparatus. U.S. Patent US20050072417 A1, 30 June 2003. [Google Scholar]
- Baumeister, R.F.; Showers, C.J. A review of paradoxical performance effects: Choking under pressure in sports and mental tests. Eur. J. Soc. Psychol. 1986, 16, 361–383. [Google Scholar] [CrossRef]
- Liao, C.M.; Masters, R.S. Self-focused attention and performance failure under psychological stress. J. Sport Exerc. Psychol. 2002, 24, 289–305. [Google Scholar] [CrossRef] [PubMed]
- Hollaus, B.; Raschner, C.; Mehrle, A. Development of release velocity and spin prediction models for passing machines in American football. Proc. Inst. Mech. Eng. Part P J. Sports Eng. Technol. 2018, 47. [Google Scholar] [CrossRef]
Publisher’s Note: MDPI stays neutral with regard to jurisdictional claims in published maps and institutional affiliations. |
© 2020 by the authors. Licensee MDPI, Basel, Switzerland. This article is an open access article distributed under the terms and conditions of the Creative Commons Attribution (CC BY) license (https://creativecommons.org/licenses/by/4.0/).