Abstract
For many runners, mechanical characteristics of running shoes, such as cushioning ability, are important in finding their suitable shoes. In addition to that, subjective comfort has come to be regarded as a non-negligible factor these days. According to previous studies, it has been found that more comfortable shoe conditions are associated with less oxygen consumption and fewer injury frequencies as compared to the less comfortable shoe conditions. However, there is also the fact that the shoes that they feel comfortable with are different from runner to runner, and it still remains unclear why the runners consider their shoes comfortable. Therefore, in this study, we tried to find the differences between several groups with different shoe preferences, applying an equilibrium-point (EP)-based muscle synergy analysis to know the reason why runners consider the shoes comfortable. As a result of the study, it was found that ankle EP velocity could distinguish between the groups classified by shoe preference. This fact indicates that some force-related parameters calculated from posture and stiffness affect the feeling of comfort.
1. Introduction
It is essential to understand the runners’ shoe preferences to develop suitable running shoes for each runner. However, the runners themselves hardly understand which shoes are the most suitable for them. Some studies [1,2,3] reported that runners tend to prefer the shoes they feel comfortable with, and they unconsciously change their limb posture according to the characteristics of shoes. In addition, it has already been reported that the comfort of shoes varies from runner to runner [4]. Therefore, it is very difficult to understand runners’ preferences of running shoes using basic kinematics/kinetics analyses only. To clarify the reason for why runners perceive the shoes as comfortable, we focused on the electromyography (EMG) activity of agonist–antagonist (A–A) muscle pairs in lower limbs and applied an equilibrium-point (EP)-based muscle synergy analysis to estimate the EP trajectory during running. As the EP trajectory indicates the posture that the runners want to take, it is important to know EP trajectory to understand a runner’s motion in detail.
2. Materials and Methods
2.1. Subjects
Fourteen male runners were recruited for the experiment (age 33.0 ± 8 years, height 174.6 ± 5.2 cm, weight 65.2 ± 5.0 kg). None of the subjects reported any history of neuromuscular disorders or injuries to their lower limbs. This study was approved by the ethical committee of Mizuno Corporation.
2.2. Procedure
All subjects wore a neutral running shoe (Mizuno WaveRider21). Treadmill running tests were performed on an instrumented treadmill. After a brief familiarization and warm-up period, they ran on a treadmill for 5 min at a speed of 2.78 m/s. The overground running test was conducted on a runway of approximately 20 m. Subjects were instructed to run overground trials along the runway at a speed range of 2.78 ± 0.3 m/s for five times.
2.3. Data Collection
Kinematic data of 43 markers on the body were captured at 500 Hz using a 14 camera motion capture system (Mac3D, Motion Analysis Corp, Santa Rosa, CA, USA). Kinetic data and ground reaction forces were measured with a force platform (9281A, Kistler Instruments AG, Switzerland) at 1000 Hz. EMG data were collected from eight major muscles of the subjects’ right legs. The examined muscles were the gluteus maximus (m1), iliopsoas (m2), hamstring (m3), rectus femoris (m4), vastus medialis (m5), biceps femoris short head (m6), soleus (m7), and tibialis anterior (m8). Surface EMG signals were recorded using a Trigno Avanti system (Delsys, Boston, MA, USA) at 2000 Hz. Before analysis, the raw EMG data were processed as follows: Band-pass filtering (10–450 Hz), full-wave rectification, butterworth smoothing, and normalization to maximum voluntary contraction (%MVC) [5]. The gait cycle was defined with respect to the right leg movement, beginning with right foot contact with a surface. All data were organized to represent 0%–100% of the gait cycle using 101 data points.
2.4. Shoe Preference Test
According to the previous study [6], we already know the fact that there are three types of runners’ preferences for running shoes. In order to know which group the runner belongs to, we selected three pairs of shoes with very different ratings depending on the groups used in the previous study. Using these shoes, we conducted a questionnaire of shoe preference and classified runners into these three groups.
2.5. Data Analysis
2.5.1. Agonist–Antagonist Ratio and Agonist–Antagonist Sum
Table 1 lists the definitions and motor functions of A–A ratios and A–A sums. In the running motion, the activity of A–A muscle pairs contributes to three joint movements: Ext/Flex, Ant/Post, and Plant/Dorsi. The , , and pairs contribute to ankle translation (i.e., Ext/Flex and Ant/Post), whereas the pair contributes to ankle rotation (i.e., Plant/Dorsi).
Table 1.
Definition of the agonist–antagonist (A–A) ratio and A–A sum (modified from [7]).
Figure 1a shows the joint angle and ankle position, Figure 1b shows the musculoskeletal system, and Figure 1c shows an ankle position of a human lower limb. The eight indicated muscles (m1 to m8) constitute the motion of the lower limb in the sagittal plane. This study focused on the EMG activity of muscle pairs of A–A muscles, especially the ratio of A–A muscle activity (A–A ratio) and the sum of A–A muscle activity (A–A sum):
where and are %MVC s of the A–A muscles. Hereafter, we focus on the A–A muscle contribution to ankle translation, although the A–A concept has the potential to clarify the A–A muscle contribution to not only ankle translation, but also ankle rotation.
Figure 1.
Definition of musculoskeletal model of lower limb. (a) Kinematic joint angle and ankle position. (b) Measuring muscles. (c) Ankle translation/rotation, Ext/Flex, Ant/Post, and Plant/Dorsi.
2.5.2. Synergy Vectors and Synergy Activation Coefficients
Through physical analysis of the musculoskeletal lower limb model in Figure 1, a previous study [7] revealed that the displacement of ankle EP translation in polar coordinates was planned based on the synergy vectors (Equation (3)) and that the synergy activation coefficients could be approximated as the product of the synergy vectors and the A–A ratio variations (Equation (4)).
where and are the time-variant displacements of the radial directional EP and angular directional EP; and are invariant coefficients determined by the muscle properties, moment arm of each joint, and limb length; and are the synergy vectors in the radial direction and angular direction; and are the A–A ratio vector with respect to time t and its average vector during running motion; and are the time-variant synergy activation coefficients in the radial direction and angular direction. The synergy vector can then be represented as a function of the A–A sum only.
From Equations (3) and (4), the ankle EP () in polar coordinates is expressed in Equations (9) and (10). The ankle EP can then be represented in Cartesian coordinates (Equation (11)) in the same way as ankle EP velocity - in Equation (12).
3. Results
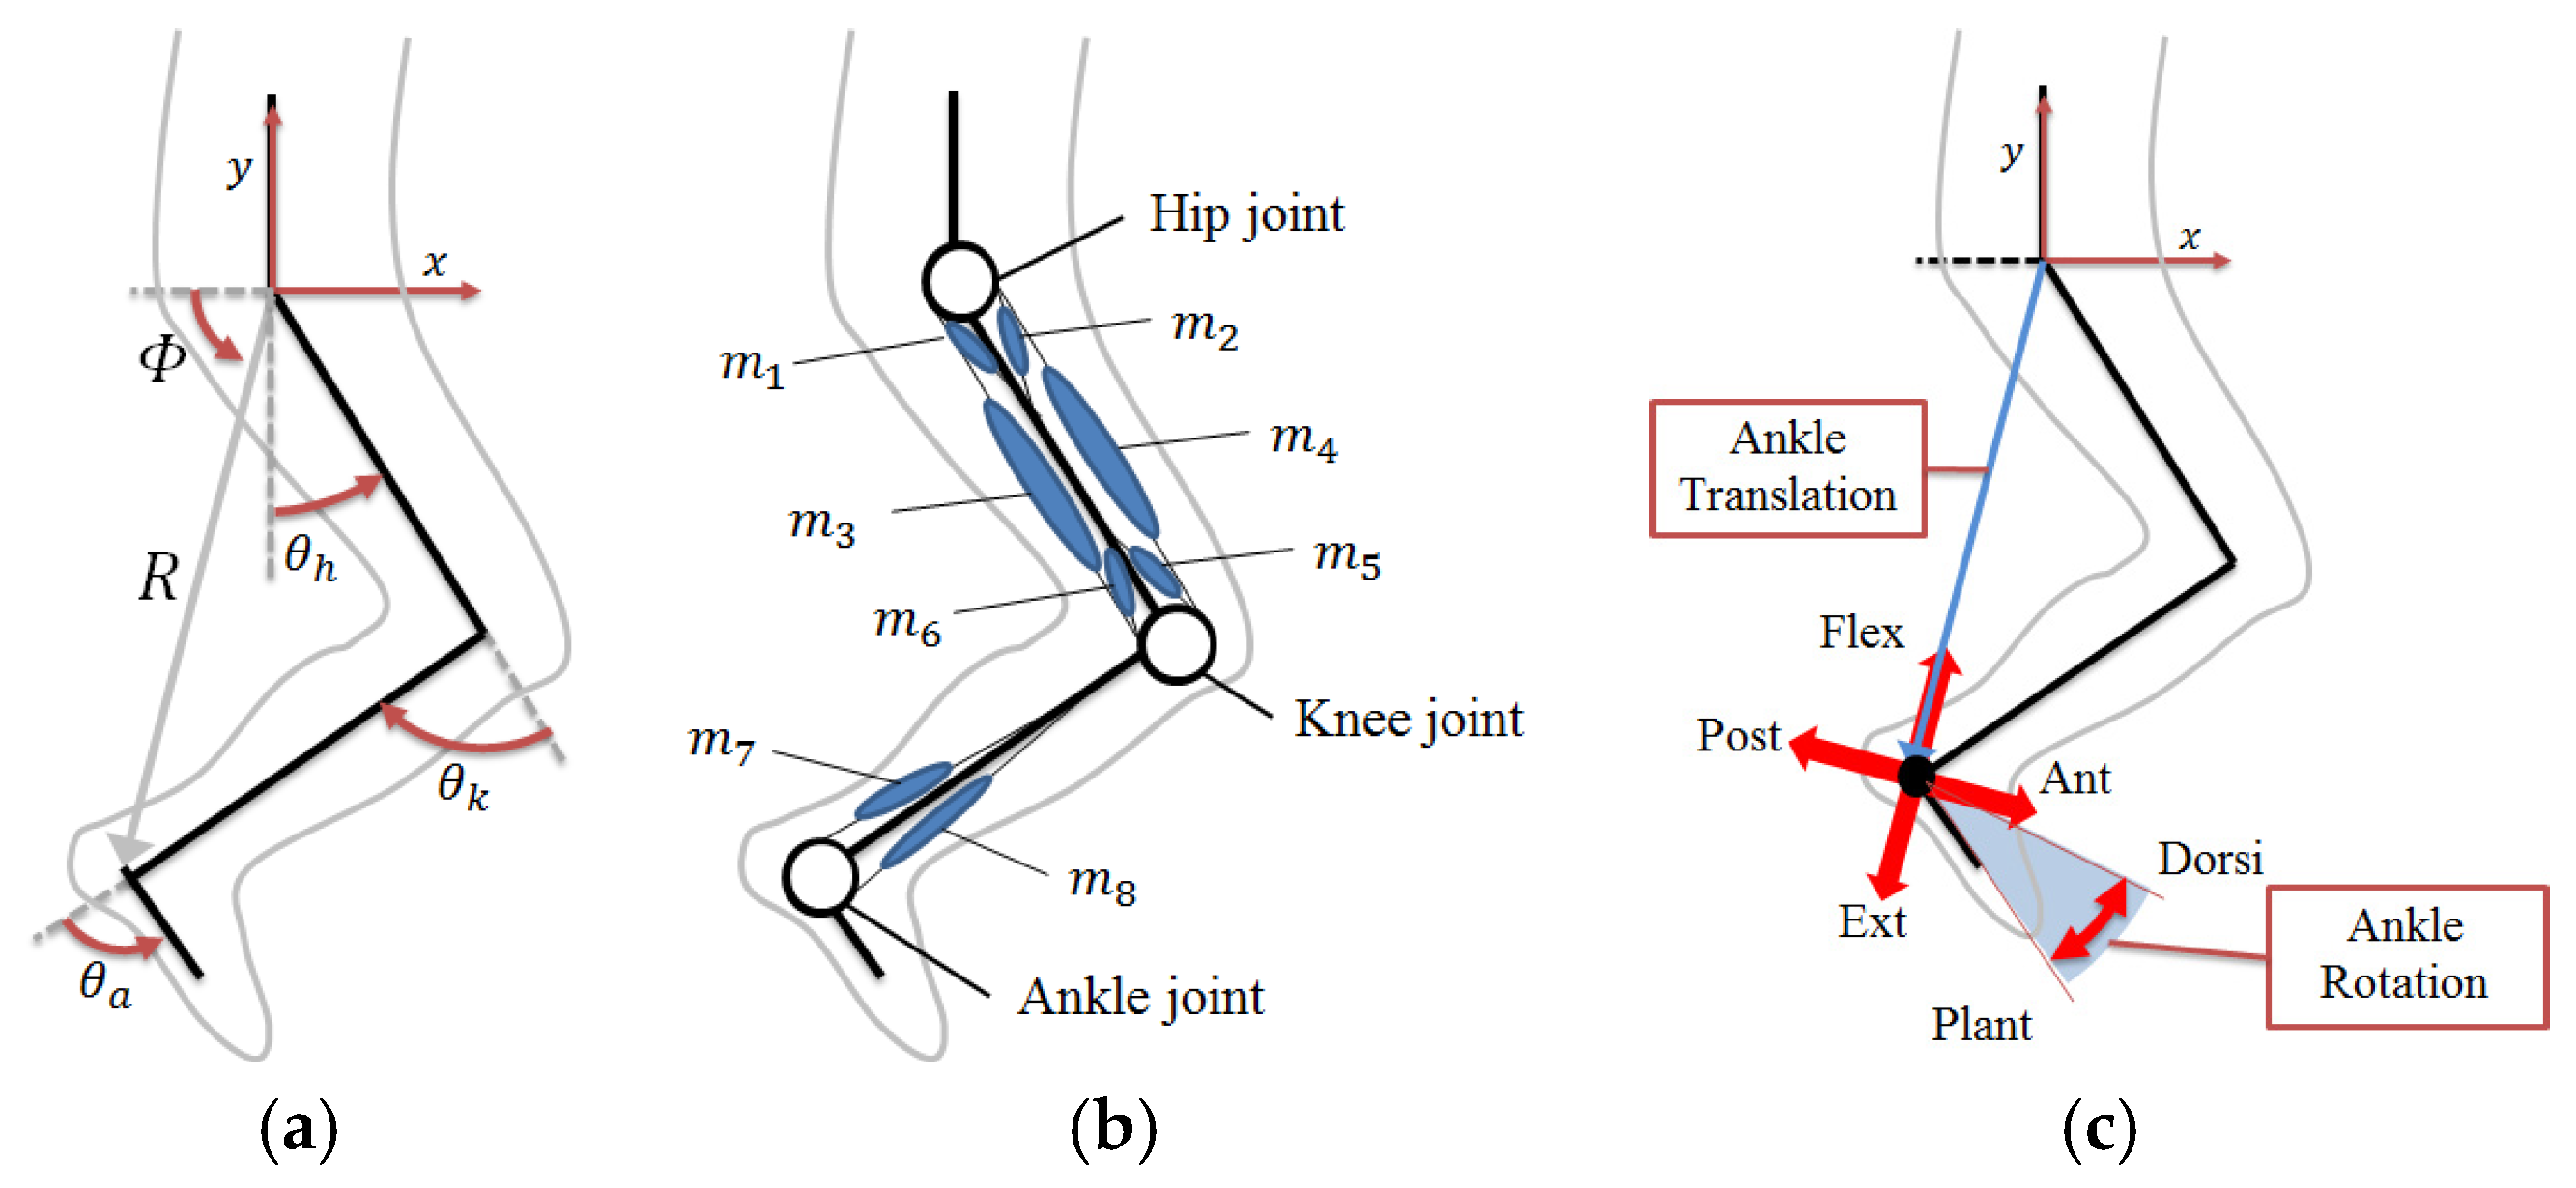
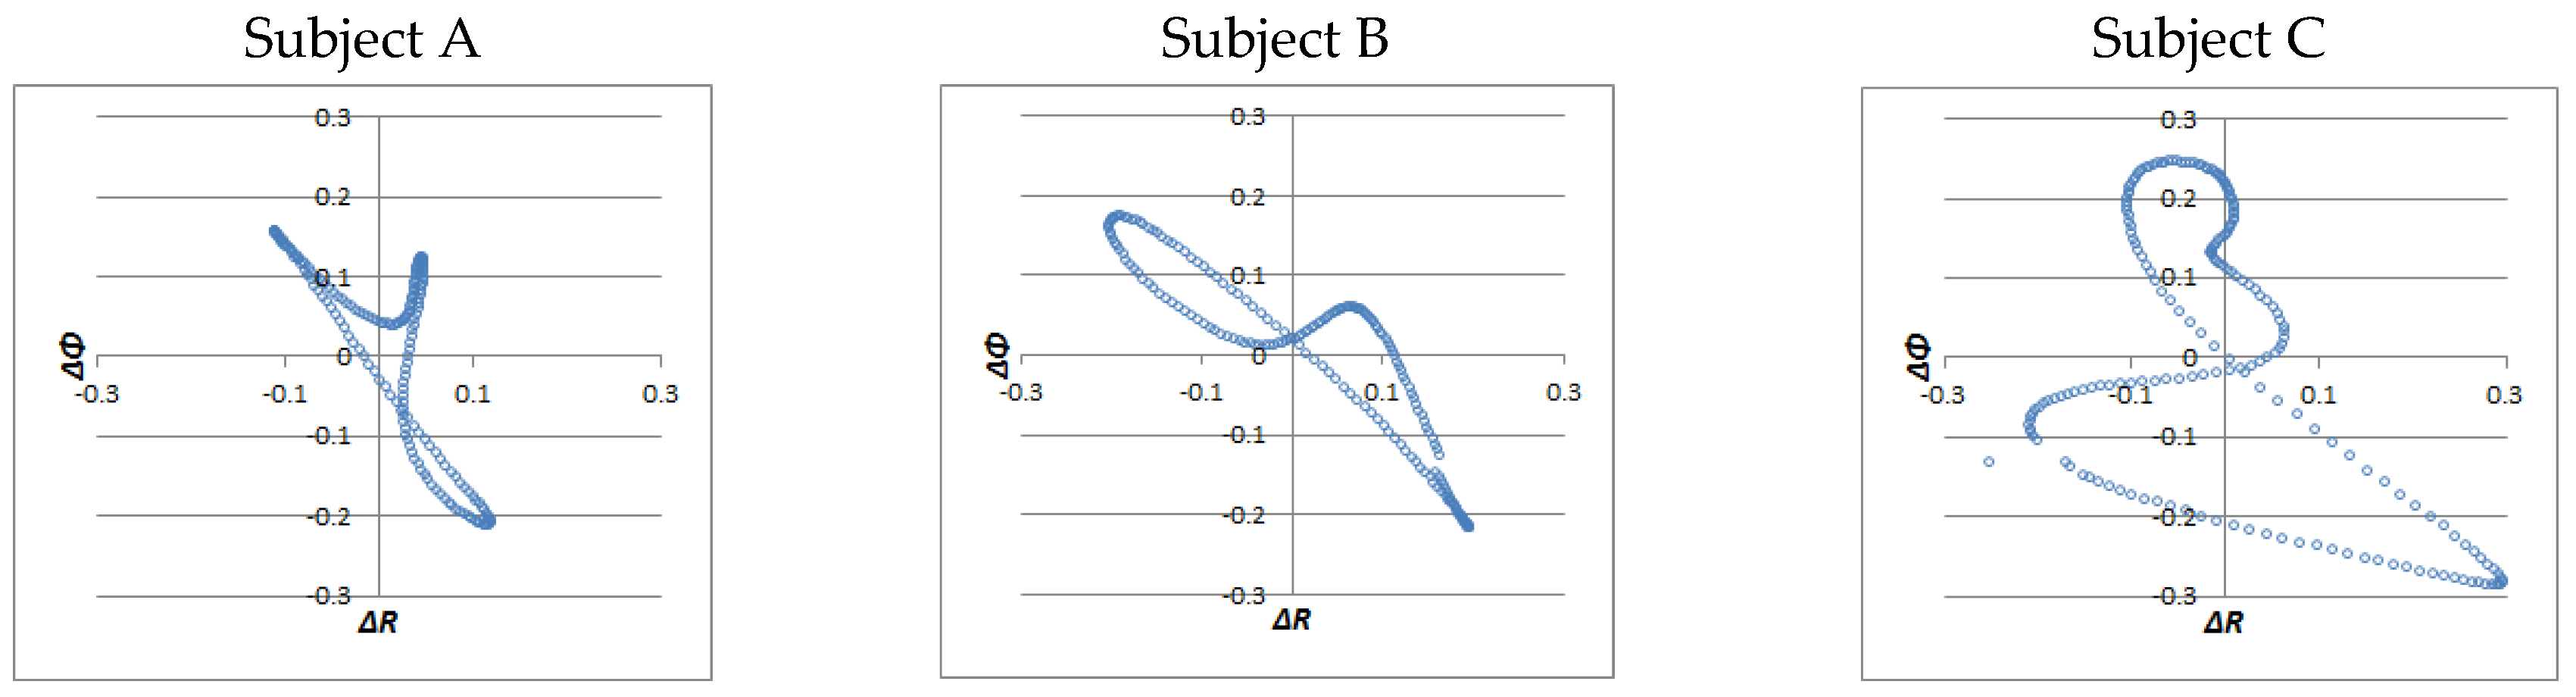
3.1. Ankle EP Trajectory
According to the previous study [6], it is already known that runners have three different preferences for running shoes. Figure 2 shows the typical results of ankle EP trajectory of three runners (A,B,C). Each runner shows the different trend of ankle EP trajectory. In particular, there is a widespread distribution in the third quadrant in Subject C compared to Subject A and Subject B.
Figure 2.
Pattern formations of ankle EP trajectory in running motion.
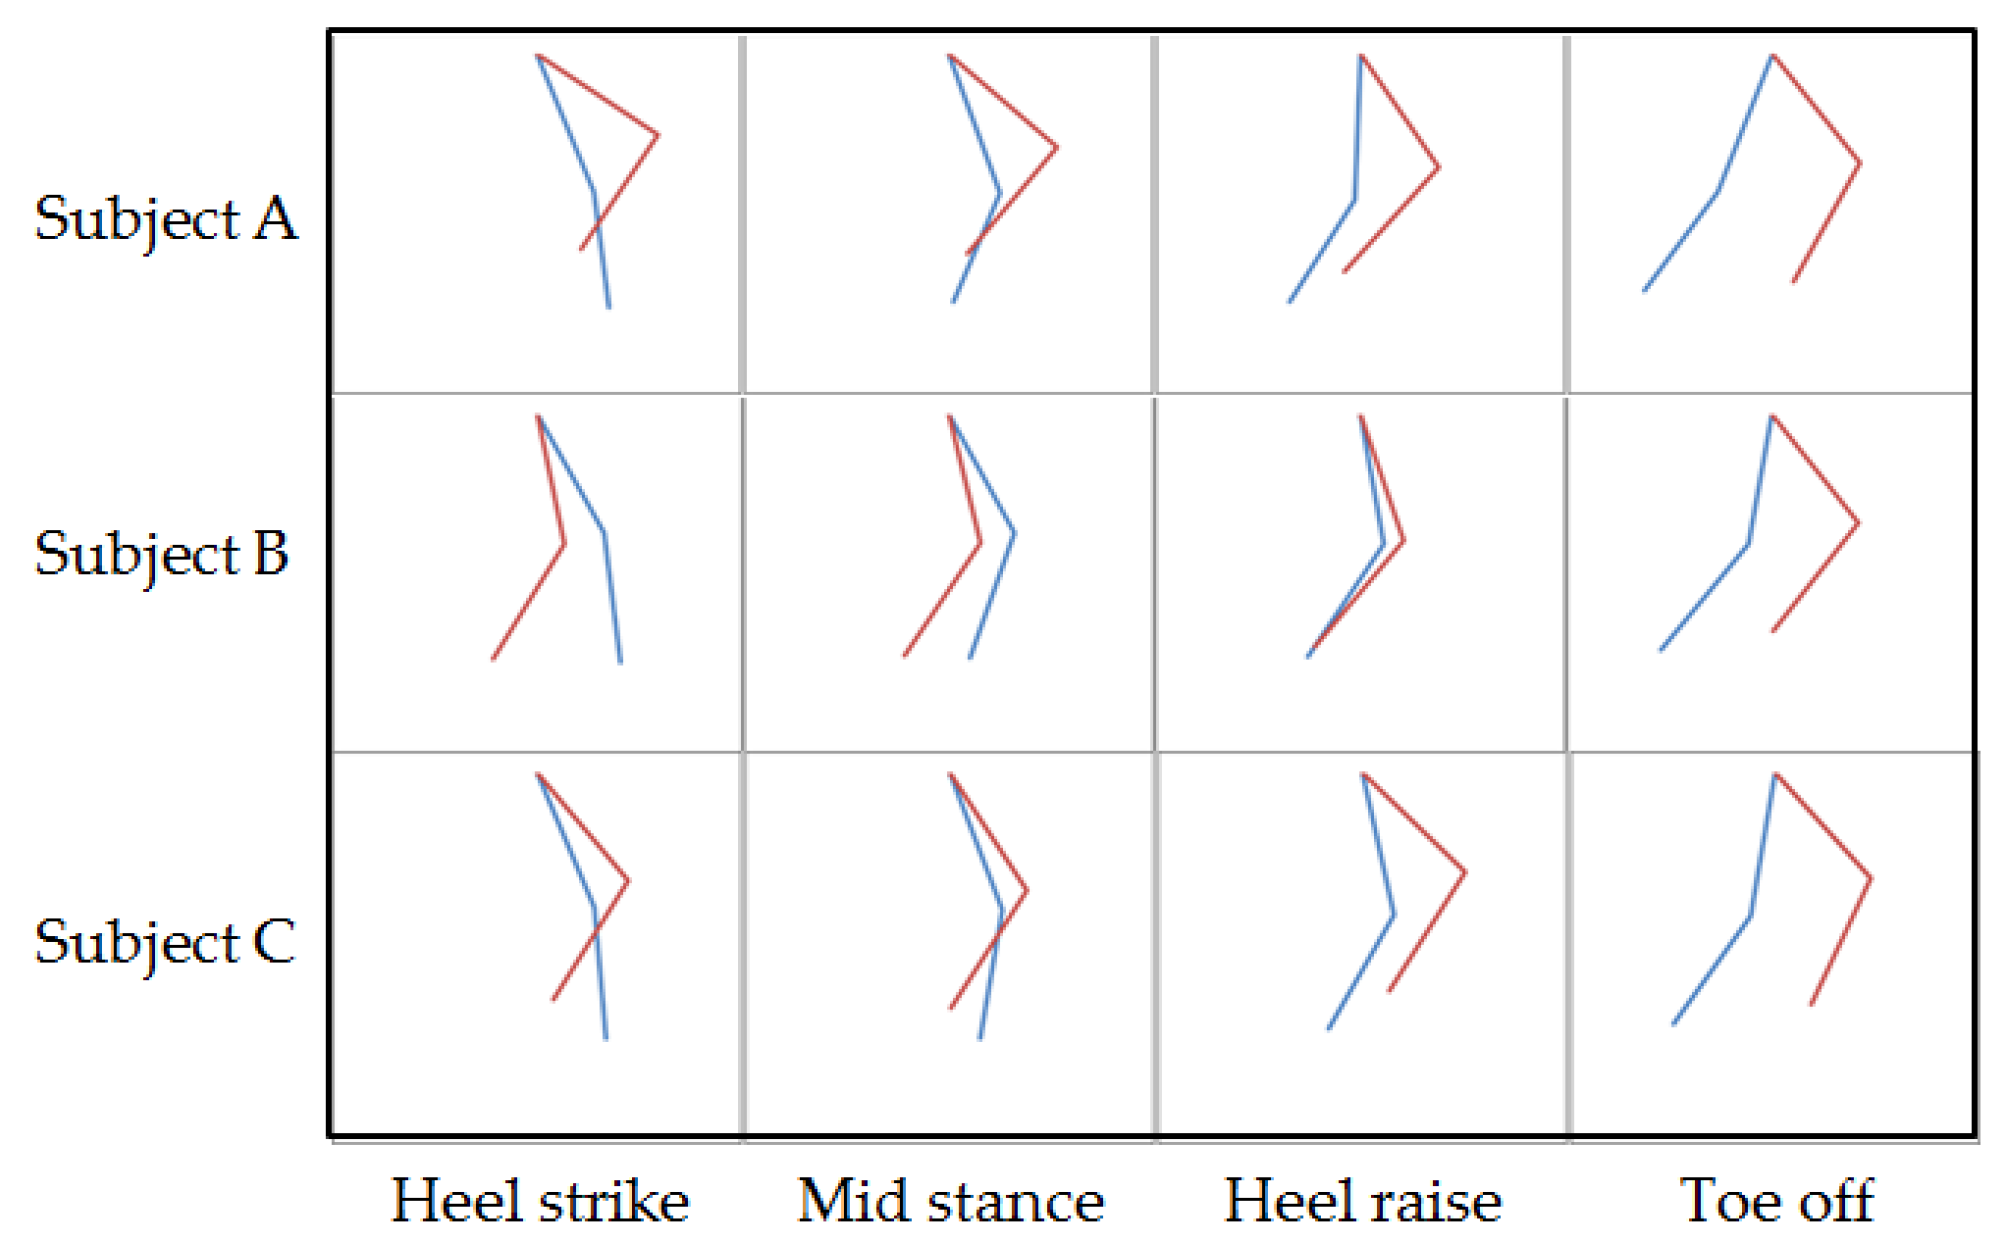
3.2. Lower-Limb EP Posture
Figure 3 shows the lower-limb EP postures and actual motions of the runners shown in Figure 2. The ankle EP was calculated using Equation (11). The EP posture preceded the actual leg posture in almost all aspects. Even though all runners showed similar postures at the toe-off phase, there were big differences at the heel strike phase. The EP posture of Subject B was situated behind the actual motion. On the other hand, the EP postures of Subject A and Subject C were situated in front of the actual motions.
Figure 3.
The EP posture (red) and actual leg posture (blue).
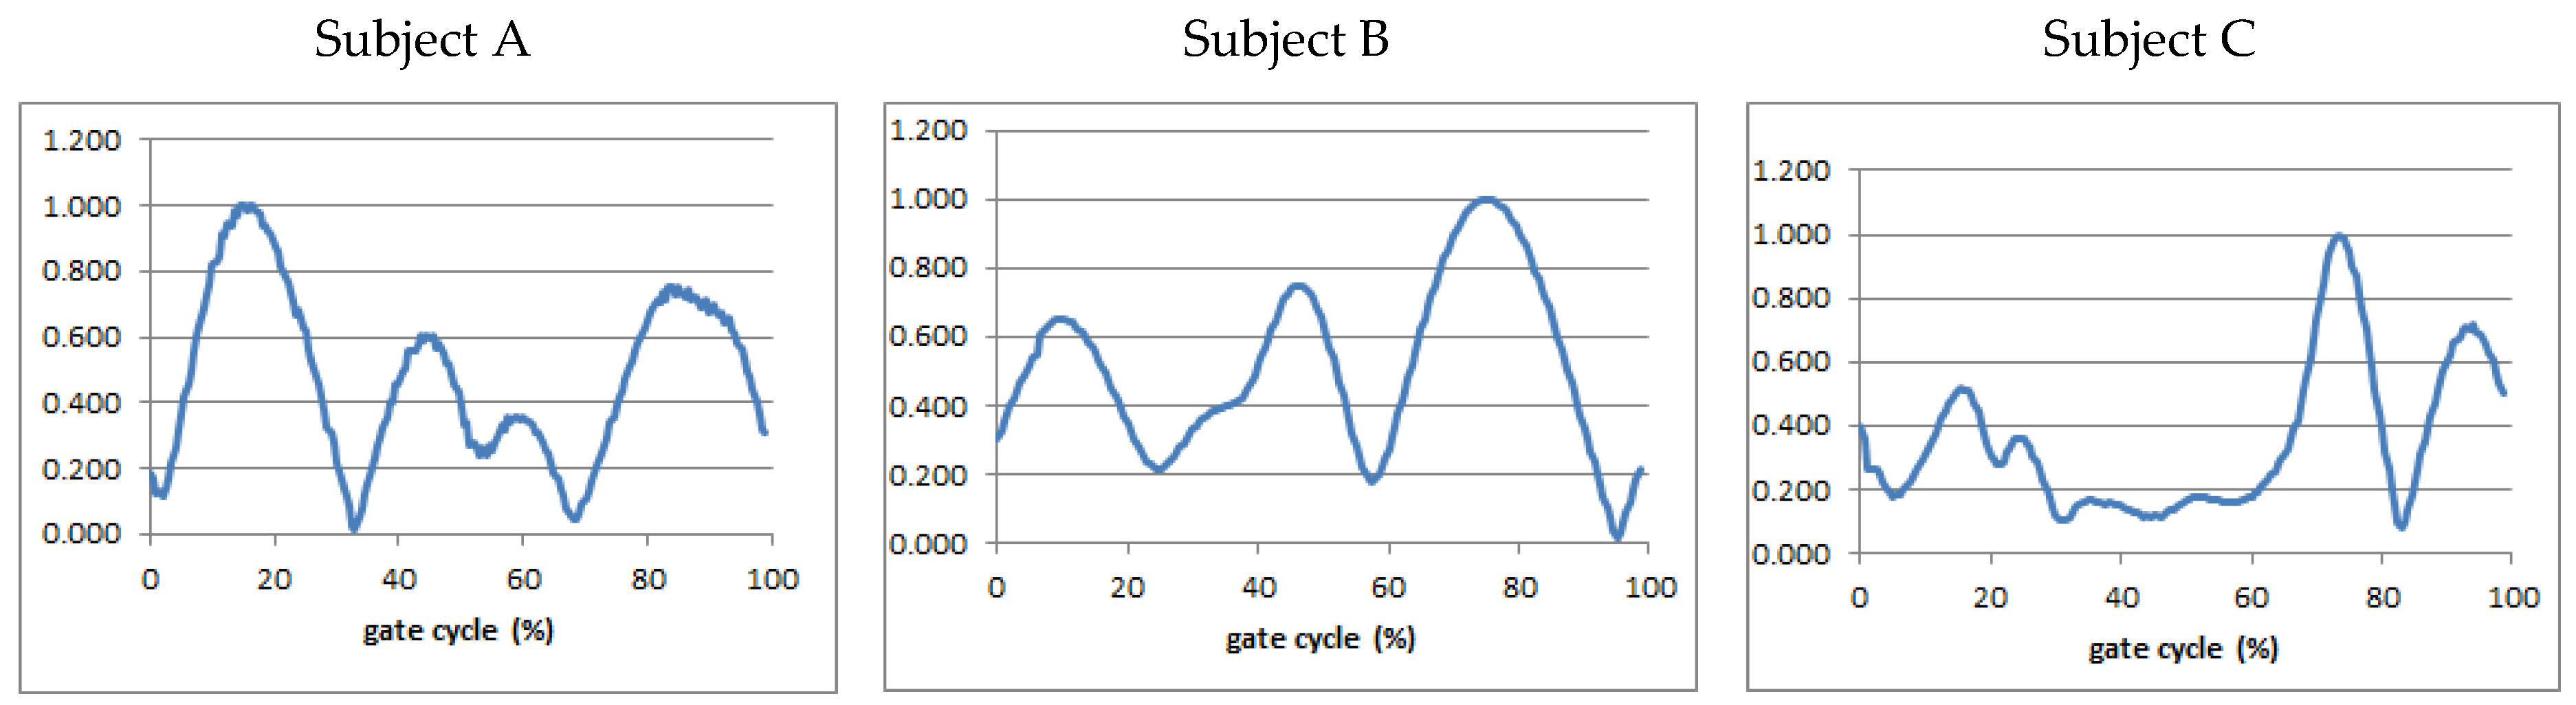
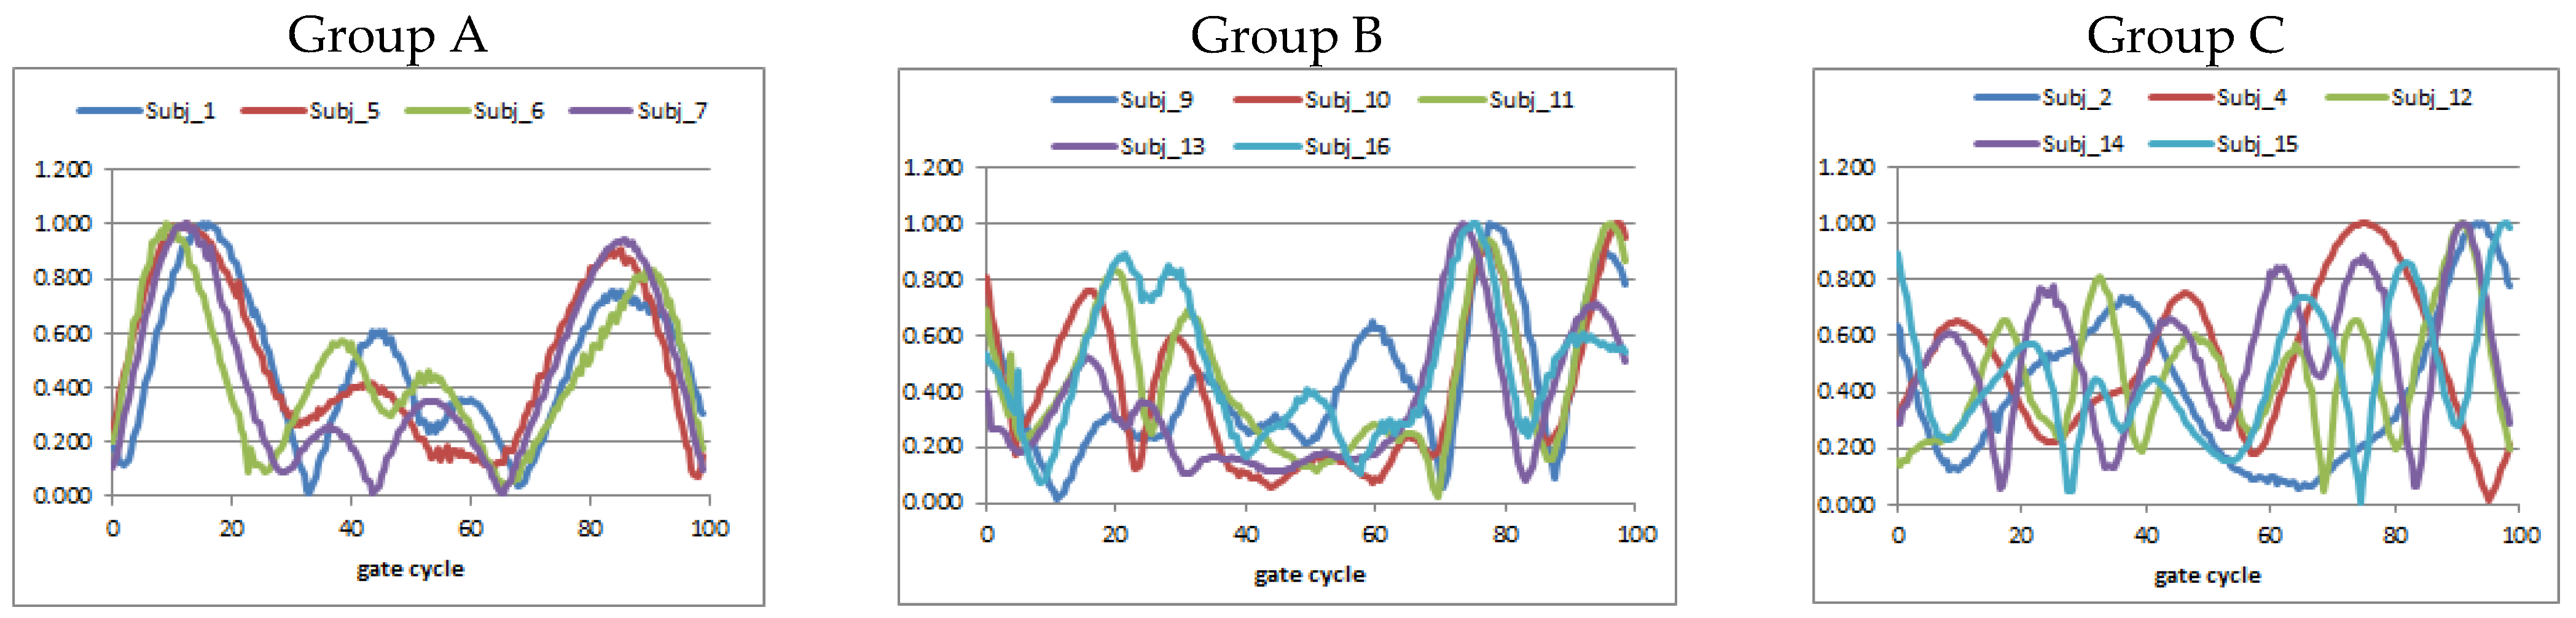
3.3. Ankle EP Velocity
To distinguish the characteristics of ankle EP control among the runners with different shoe preferences, we calculated ankle EP velocity during running. Representative runners (Subjects A, B, and C) showed different trends of ankle EP velocity (Figure 4).
Figure 4.
Ankle EP velocities of three runners with different shoe preference.
To examine the similarity of ankle EP velocities among 14 runners, we calculated a correlation coefficient for all runners. Some runners showed a high correlation between each other. Based on these results, we finally classified the 14 runners into three groups. Runners in Group A and Group B showed strong similarity, respectively (r = 0.55 to 0.89 for Group A, r = 0.51 to 0.86 for Group B), but there was weak similarity (r = 0.01 to 0.32) in Group C (Figure 5).
Figure 5.
Ankle EP velocities of three groups categorized by correlation coefficient.
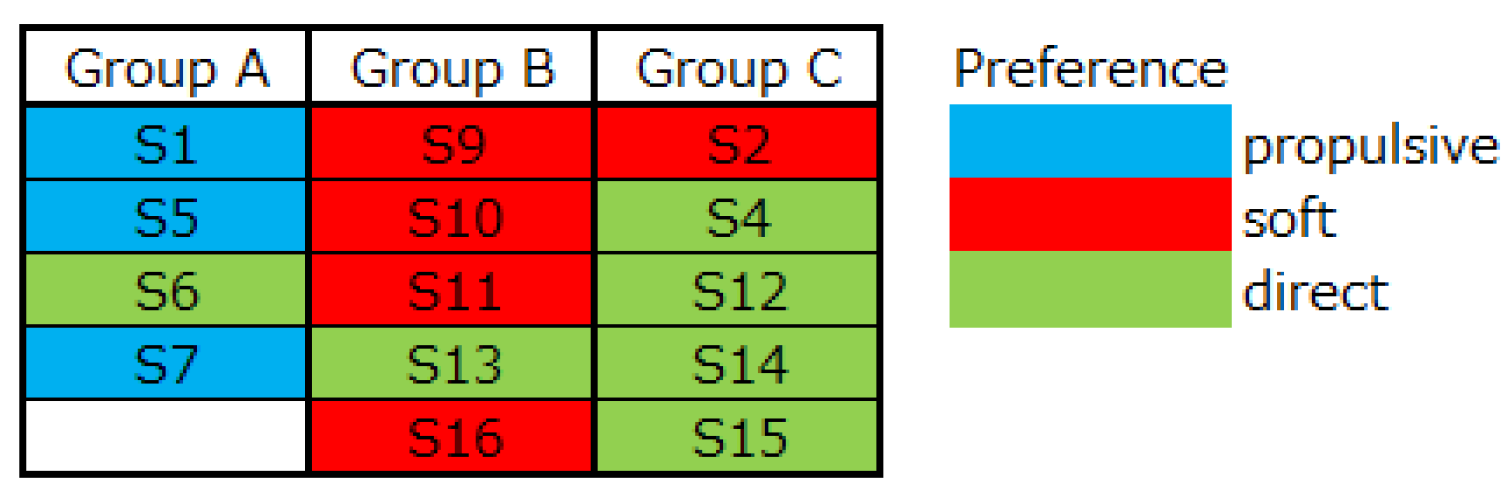
3.4. Relationships between Shoe Preference and Ankle EP Velocity
According to the previous study [6], we categorized runners into three clusters. Each cluster prefers specific feelings of running shoes (i.e., cluster A prefers propulsive feelings, cluster B prefers soft feelings, and cluster C prefers direct feelings from the ground). To know the relationships between runners’ preferences and ankle EP velocity, we examined those of Group A to Group C (Figure 6). These results indicate that the runners categorized by ankle EP velocity show similar preferences for running shoe feelings.
Figure 6.
Relationship between shoe preference group and the group categorized by ankle EP velocity.
4. Discussion
According to the previous study [1], runners select comfortable products using their own comfort filters. In this study, runners’ preferences for running shoes were related to the similarity of ankle EP velocity during running. This result indicates that EP-based muscle synergies and concomitant ankle EP trajectory seem to have something to do with the feelings of comfort of runners. Since EP-based muscle synergies account for kinematics and mechanical impedance during running, it is assumed that some force-related parameters calculated from posture and stiffness are related to feelings of comfort. On the other hand, the similarity of ankle EP velocity was very weak in Group C. A previous study [2] reported that runners preferred neutral cushioning shoes. However, close to one in five people preferred the stable model. In this study, Group C runners also preferred stable-feeling shoes. These results indicate that Group C runners are extremely different from those of Group A and Group B, and they may have some common elements, except for kinetics/kinematics parameters.
5. Conclusions
The findings of the current study suggest that shoe preferences of runners and muscle synergy characteristics categorized by similarity of ankle EP velocity have a strong relationship with each other. We believe that the runners in the same group must be trying to adopt the same strategy of running.
Funding
This research received no external funding.
Conflicts of Interest
This study was supported by Mizuno Corporation, Osaka, Japan. Authors Daisuke Kogawa and Hideya Okamoto are employees of Mizuno Corporation, Osaka, Japan.
References
- Nigg, B.M.; Baltich, J.; Hoerzer, S.; Enders, H. Running shoes and running injuries: Mythbusting and a proposal for two new paradigms: ‘preferred movement path’ and ‘comfort filter’. Br. J. Sports Med. 2015, 49, 1290–1294. [Google Scholar] [CrossRef]
- Kong, P.W.; Miranda, B. Shoe preference based on subjective comfort for walking and running. J. Am. Podiatr. Med Assoc. 2010, 100, 456–462. [Google Scholar]
- Hardin, E.C.; Van den bogert, A.J.; Hamill, J. Kinematic adaptations during running: Effects of footwear, surface, and duration. Med. Sci. Sports Exerc. 2004, 36, 838–844. [Google Scholar] [CrossRef]
- Miller, J.E.; Nigg, B.M.; Liu, W.; Stefanyshyn, D.J.; Nurse, M.A. Influence of foot, leg and shoe characteristics on subjective comfort. Foot Ankle Int. 2000, 21, 759–766. [Google Scholar] [CrossRef]
- Hislop, H.J. Daniels and Worthingham’s Muscle Testing; Saunders: Los Angeles, CA, USA, 2013. [Google Scholar]
- Okamoto, H.; Kogawa, D.; Kishimoto, S.; Ito, K. Diversity of shoe preference—preferred ride feel for each runner. Footwear Sci. 2019, 11, 102–103. [Google Scholar] [CrossRef]
- Watanabe, E.; Oku, T.; Hirai, H.; Yoshikawa, F.; Nagakawa, Y.; Kuroiwa, A.; Grabke, E.P.; Uemura, M.; Miyazaki, F.; Krebs, H.I. Exploiting invariant structure for controlling multiple muscles in anthropomorphic legs: II. experimental evidence for three equilibrium-point-based synergies during human pedaling. In Proceedings of the 2016 IEEE-RAS International Conference on Humanoid Robots (Humanoids 2016), Cancun, Mexico, 15–17 November 2016; pp. 1167–1172. [Google Scholar]
Publisher’s Note: MDPI stays neutral with regard to jurisdictional claims in published maps and institutional affiliations. |
© 2020 by the authors. Licensee MDPI, Basel, Switzerland. This article is an open access article distributed under the terms and conditions of the Creative Commons Attribution (CC BY) license (http://creativecommons.org/licenses/by/4.0/).