Abstract
Recently, manufactures who produce surfboards using computer aided design and robotic (CNC) shaping tools have gained a larger share of the surfing market, allowing board producers and shapers to produce lighter and more durable boards. The improvement in design and production process of surfboards has been directly linked with the adaption of technologies tested and validated in other industries. However, the surfing industry still lacks methodologies, standards and testing facilities to scientifically investigate and quantify the structural and hydrodynamic properties of surfboards. It is widely accepted that distributed rigidity, damping and stiffness in the three directions play a huge role in defining surfboard performance. These properties are rarely stated by producers and never measured. The present paper compares two boards with equal outline and geometric shape but built with two different technologies: one board built with a traditional high density polyurethane (PU) blank, polyester resin and a stringer to improve longitudinal stiffness and one board built with bio epoxy resin, expanded polystyrene (EPS) and two side inserts made of cork to improve longitudinal stiffness and damping. Different tests were carried out to compare the two boards and a testing methodology with the aim to evaluate board structural properties and identify key parameters that will influence the board performances. Accelerometers were used to characterize stiffness and damping while a custom-made flex machine was used to evaluate the torsional stiffness. Differences between the two boards are highlighted, leading to the fact that the two boards, even being identical in size, will behave differently in different wave conditions and for different surfers.
1. Introduction
The surfing industry is ca. 70 years old and well established. However, only recently thanks to Computer Numerical Control (CNC) machines, board production moved from hand-made to mass produced, allowing for designs to be reproduced. While some studies regarding the boards hydrodynamics and fins aerodynamics have been recently published [1,2,3] no studies surfboard board structural properties are currently available. In other fields, like for instance blade manufacturing for the wind energy industry, as part of the certification procedure, wind turbine blade prototypes are subjected to an experimental test procedure in order to ensure the fulfillment of the actual design requirements. Specifically, alongside tests of load carrying capacity under extreme loading and tests of the fatigue resistance, tests of the basic dynamic properties of the blades, such as natural frequencies and damping properties, are carried out [4]. These tests are essential in order to estimate the dynamic behavior of the blade. The tests aim to provide detailed knowledge about natural frequencies and structural damping characteristics but do not by itself guarantee/ensure an optimal dynamic behavior of the wind turbine when subjected to aerodynamic forces arising from the imposed wind field. A similar approach and test methodology, comprising of static loads test and modal analysis tests can be applied to surfboards in order to estimate the behavior of the board. The results can be either used to evaluate possible manufacturing problems or to estimate the performance of the board itself, so that riders can choose their board depending on the wave conditions, on their biomechanic properties or on their preference. On a general level, assuming identical geometries, a stiffer board would provide less drag than a softer board in clean wave conditions, but it would be more reactive and provide less shock absorption in choppy/rough wave conditions. Added damping would also help in rough conditions, limiting the vibrations of the board but diminishing the response of the board. A stiffer board would be harder to land on after an air maneuver while a softer board would provide a softer landing for the surfer.
This paper aims to provide guidelines for surfboard test methodologies and to compare two surfboards (identical in shape and geometry, but different in materials) in terms of torsional stiffness and dynamic behavior. Our aim is to offer the interested reader and the fast-growing industry tools for a more precise structural and quantify-able characterization of the surfboards.
2. Methods
2.1. Surfboards
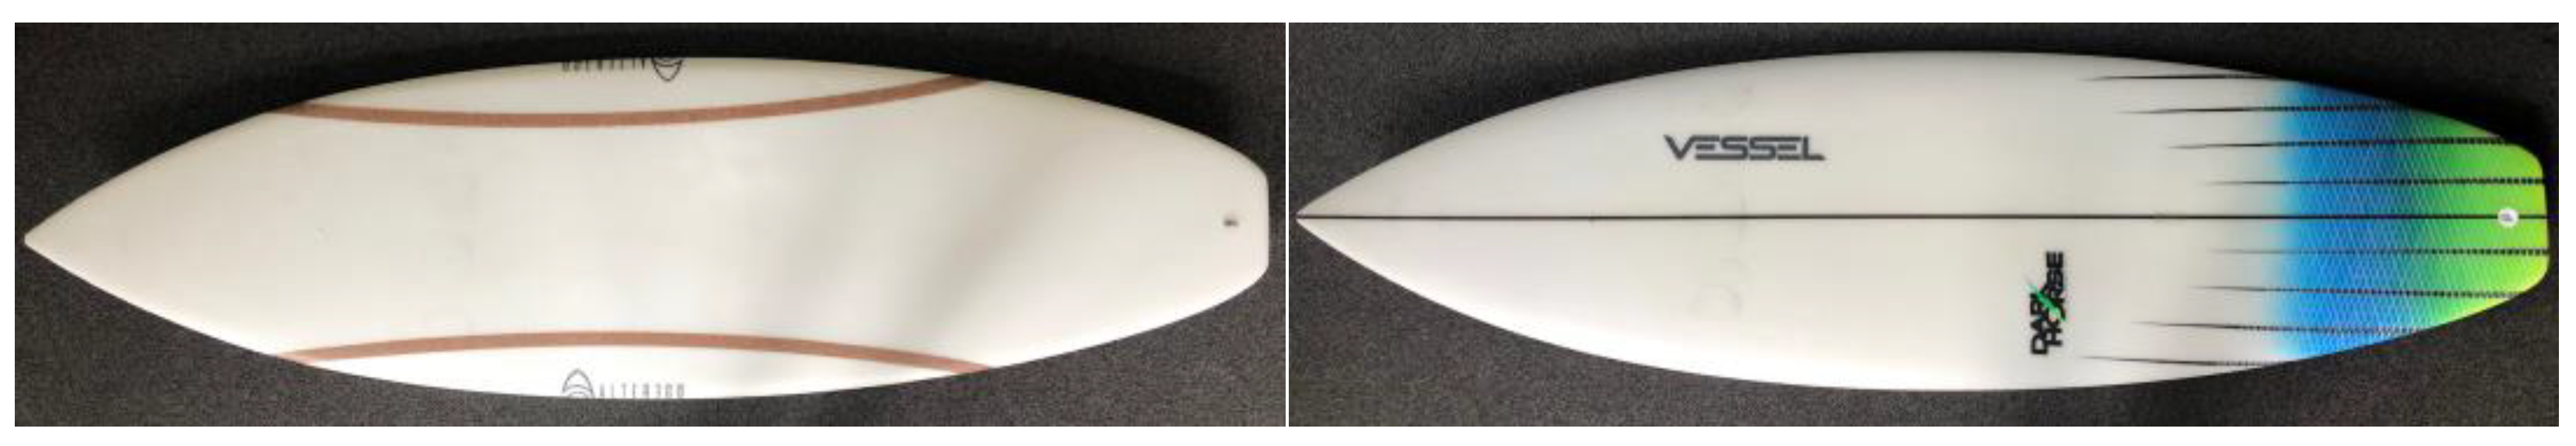
Two board identical in size were used for the test (Figure 1, Table 1). The boards measurements are 5′8″ in length, 19″ in width and 2.25″ in maximum thickness with the mass of the Alterego and Vessel surfboards 2.5 kg and 3.1 kg, respectively.
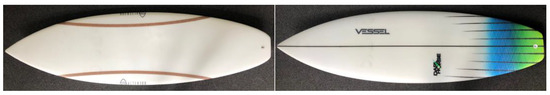
Figure 1.
Surfboards tested. Alterego (left) and Vessel Darkhorse (right).

Table 1.
Boards generic characteristics.
The Alterego board is built with two curvilinear cork stringers embedded in an expanded polystyrene (EPS) core and epoxy resin. In contrast, the Vessel board is built with a wooden stringer placed in the middle section of the board and it is made with the classic PU/PE (polyurethane blank, polyester resin) combination.
2.2. Tests
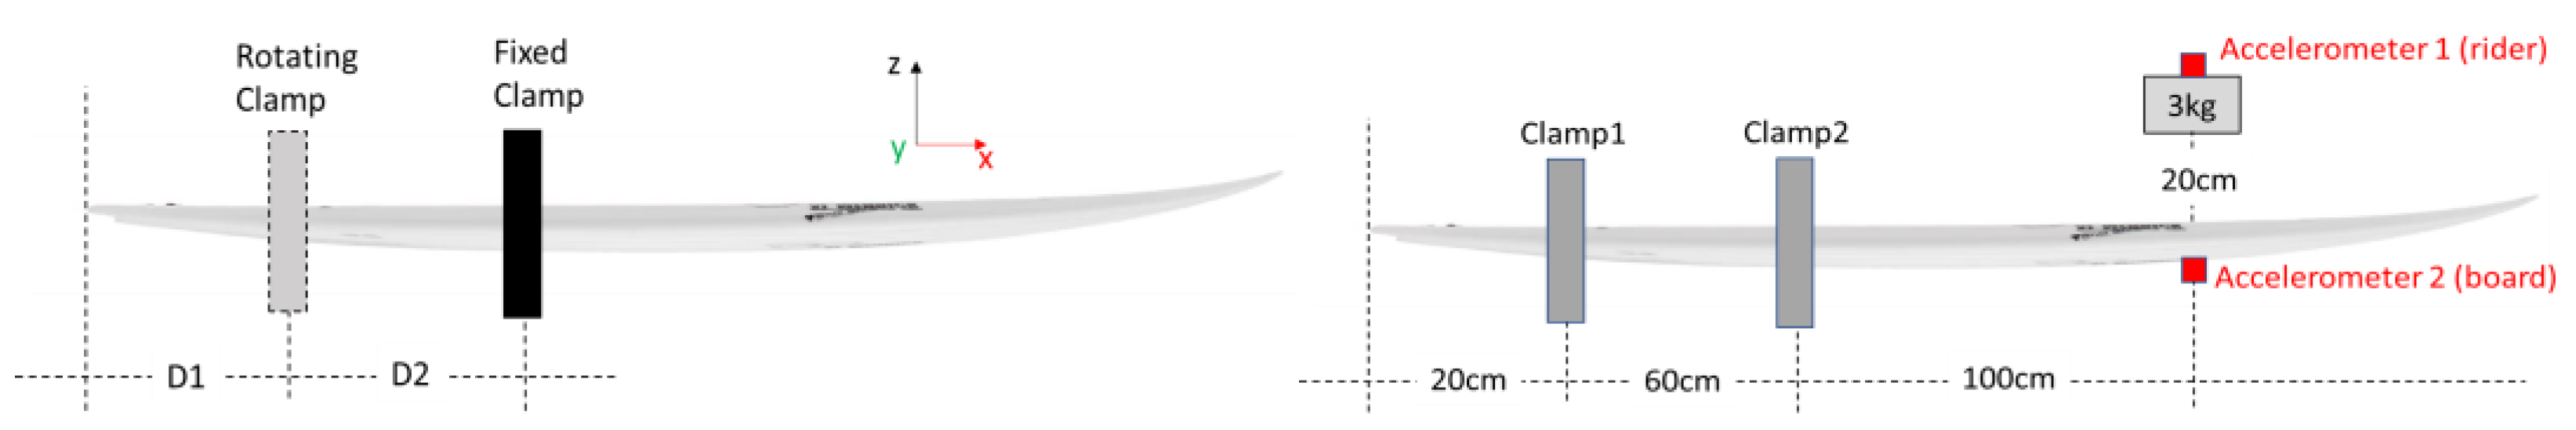
Torsional stiffness via flex machine: a custom-built flex machine (University of Wollongong, Australia) was used to estimate the torsional stiffness values by twisting a surfboard over 5 degrees through a rotating clamp and measuring the required applied torque (see Figure 2 left). Torsional stiffness values were determined for two different configurations: on-tail (where the rotating clamp is fixed on the surfboard’s tail using D1 = 0.125 m) and off-tail (where the rotating clamped is fixed off the tail using D1 = 0.4 m). Torsional stiffness (TS) is evaluated by twisting the surfboards over D2 distances of 0.45 m, 0.60 m, 0.75 m and 1.00 m for the on-tail configuration, and 0.45 m, 0.60 m, 0.75 m for the off-tail configuration. Torsional stiffness index (T) and stiffness coefficient (n) values are evaluated from by fitting on-tail and off-tail data using TS = T ∙ (D2)n−1.
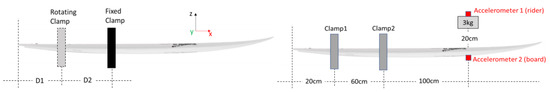
Figure 2.
Setup for drop weight test (left) and torsional stiffness test via flex machine (right). D1 and D2 indicate the distance from the tail of the board and the distance over which the surfboard is twisted, respectively.
Board response via weight drop test: A weight with the measured weight of 3 kg is let fall on the board nose from a height of 20 cm simulating the front foot of a surfer landing on the board after an air maneuver or moving abruptly the front foot (Figure 2 right). In this test the board is clamped with D1 = 0.125 m and D2 = 0.4 m. Accelerations on the board and on the weight were recorded with two accelerometers (sampling frequency 100 Hz, Mbientlab, USA), with the results indicating the impact acceleration on the board and the rebound acceleration felt by the weight which should resemble the impact felt on the rider’s foot.
Decay tests: Decay tests allow to understand the dynamic behavior of the board. Three different decay tests were carried out: a cantilever nose decay test, a cantilever tail decay test and a free decay test. In the cantilever nose decay test the board is clamped with D1 = 0.125 m and D2 = 0.4 m, excited with a hammer (0.45 kg, Bunnings Warehouse, Australia) on the nose and let free to vibrate. The vibrations are measured with one accelerometer (sampling frequency 100 Hz) placed 10 cm from the nose. Each test is repeated 5 times. In the cantilever tail decay test, the board is clamped 45 cm from the nose excited with the hammer and let free to vibrate. The vibrations are measured with three accelerometers (sampling frequency 100 Hz), placed respectively at 0.10 m, 0.20 m and 0.40 m from the tail. Each test is repeated 5 times. In the free decay test the board is freely suspended (from the ceiling, positioned with the nose down) and hit with a hammer. An accelerometer (sampling frequency 800 Hz, Mbientlab, San Francisco, CA), placed 10 cm from the nose is used to measure the natural frequencies.
3. Results and Discussion
3.1. Torsional Stiffness
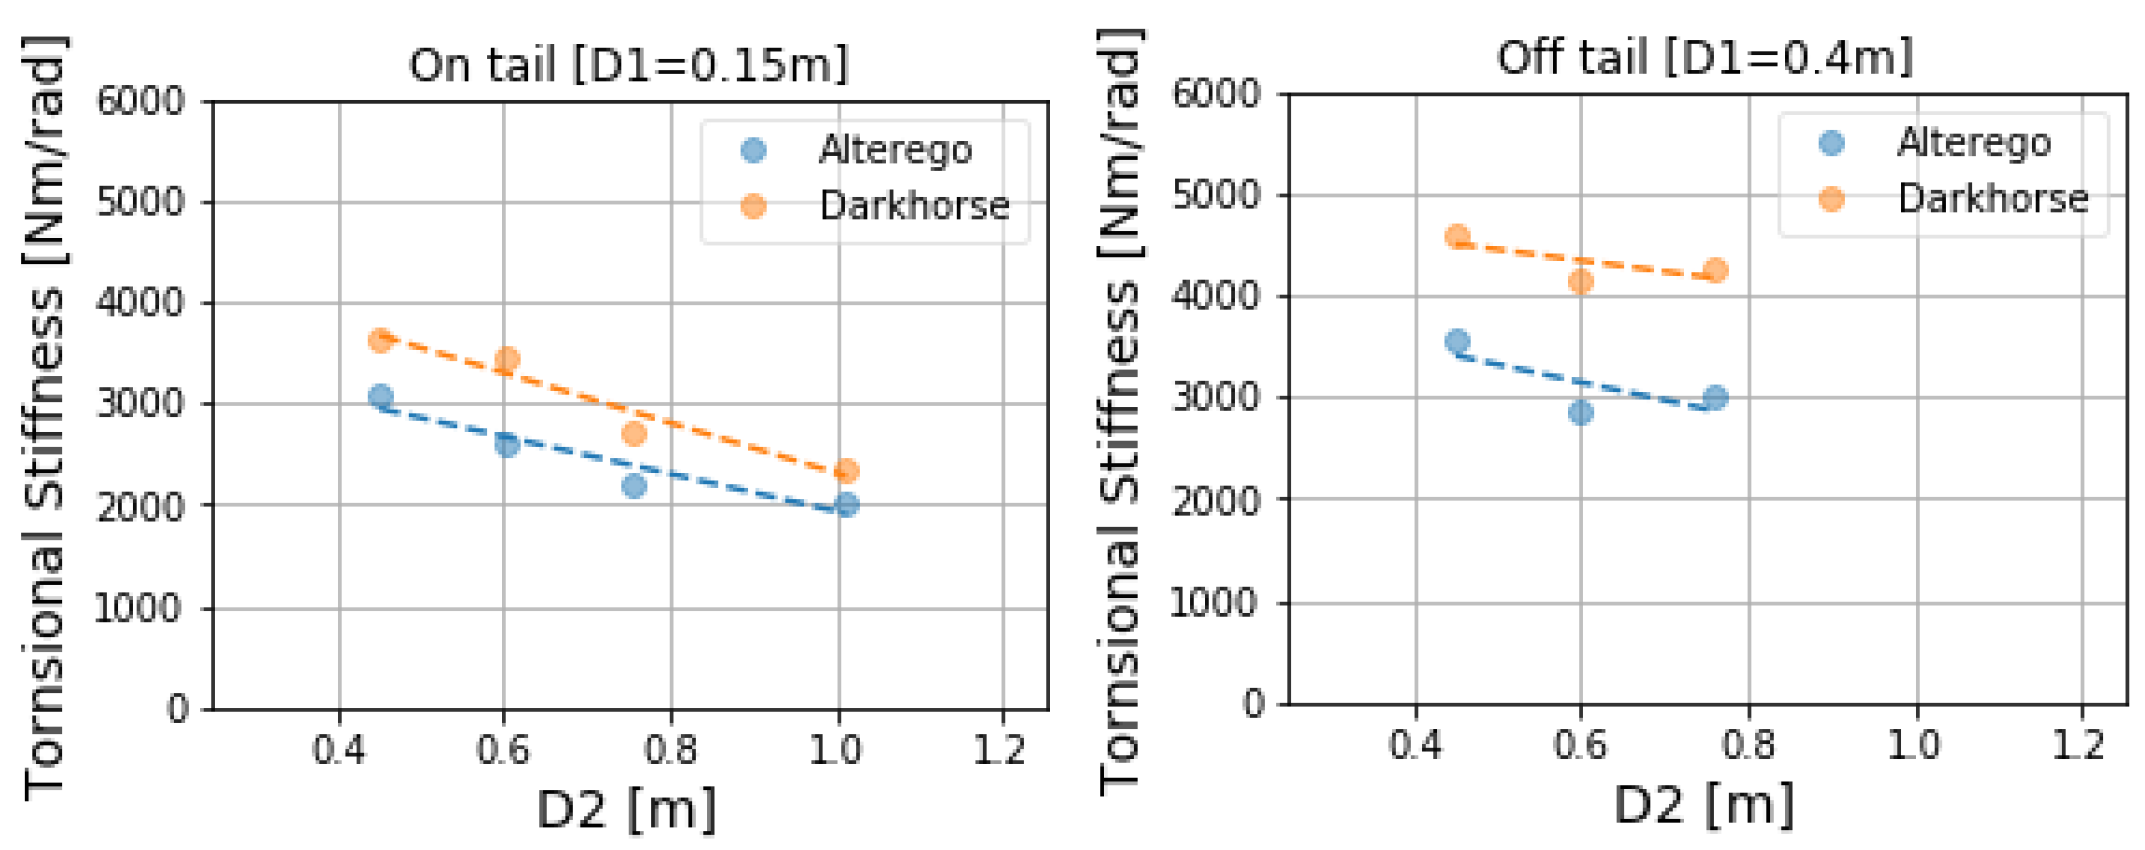
The torsional stiffness results (Table 2 and Figure 3) show that the Altergo board exhibits lower values (less stiff) than the Darkhorse in both on tail and off tail configurations. The average surfer stance (back foot on tail, front foot forward) is consistent with an on-tail configuration with D2 = 0.75 cm. In this arrangement, the Alterego board is 17% softer than the Darkhorse. This can be attributed to the difference in board construction technologies, i.e., EPS core vs. PU core, as well as the different type of longitudinal reinforcement used within the Alterego (two cork inserts) compared to the Darkhorse (traditional wooden stringer). A lower torsional stiffness would result in a board feeling softer and flexing more easily during turns. It is possible that this could result in higher drag when surfing in a straight line.
Table 2.
Results from the torsional stiffness test. T, n and ± indicate the torsional stiffness index, stiffness coefficient and standard deviation values, respectively.
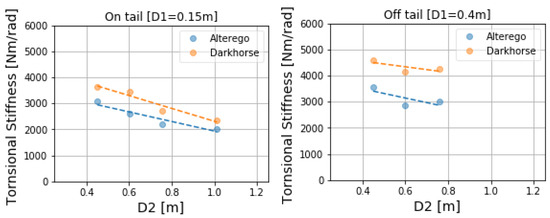
Figure 3.
Torsional stiffness of the board for varying D2. (Left) On-tail configuration. (Right) Off-tail configuration. Dashed lines are power-law fits to the data.
3.2. Weight Drop Test
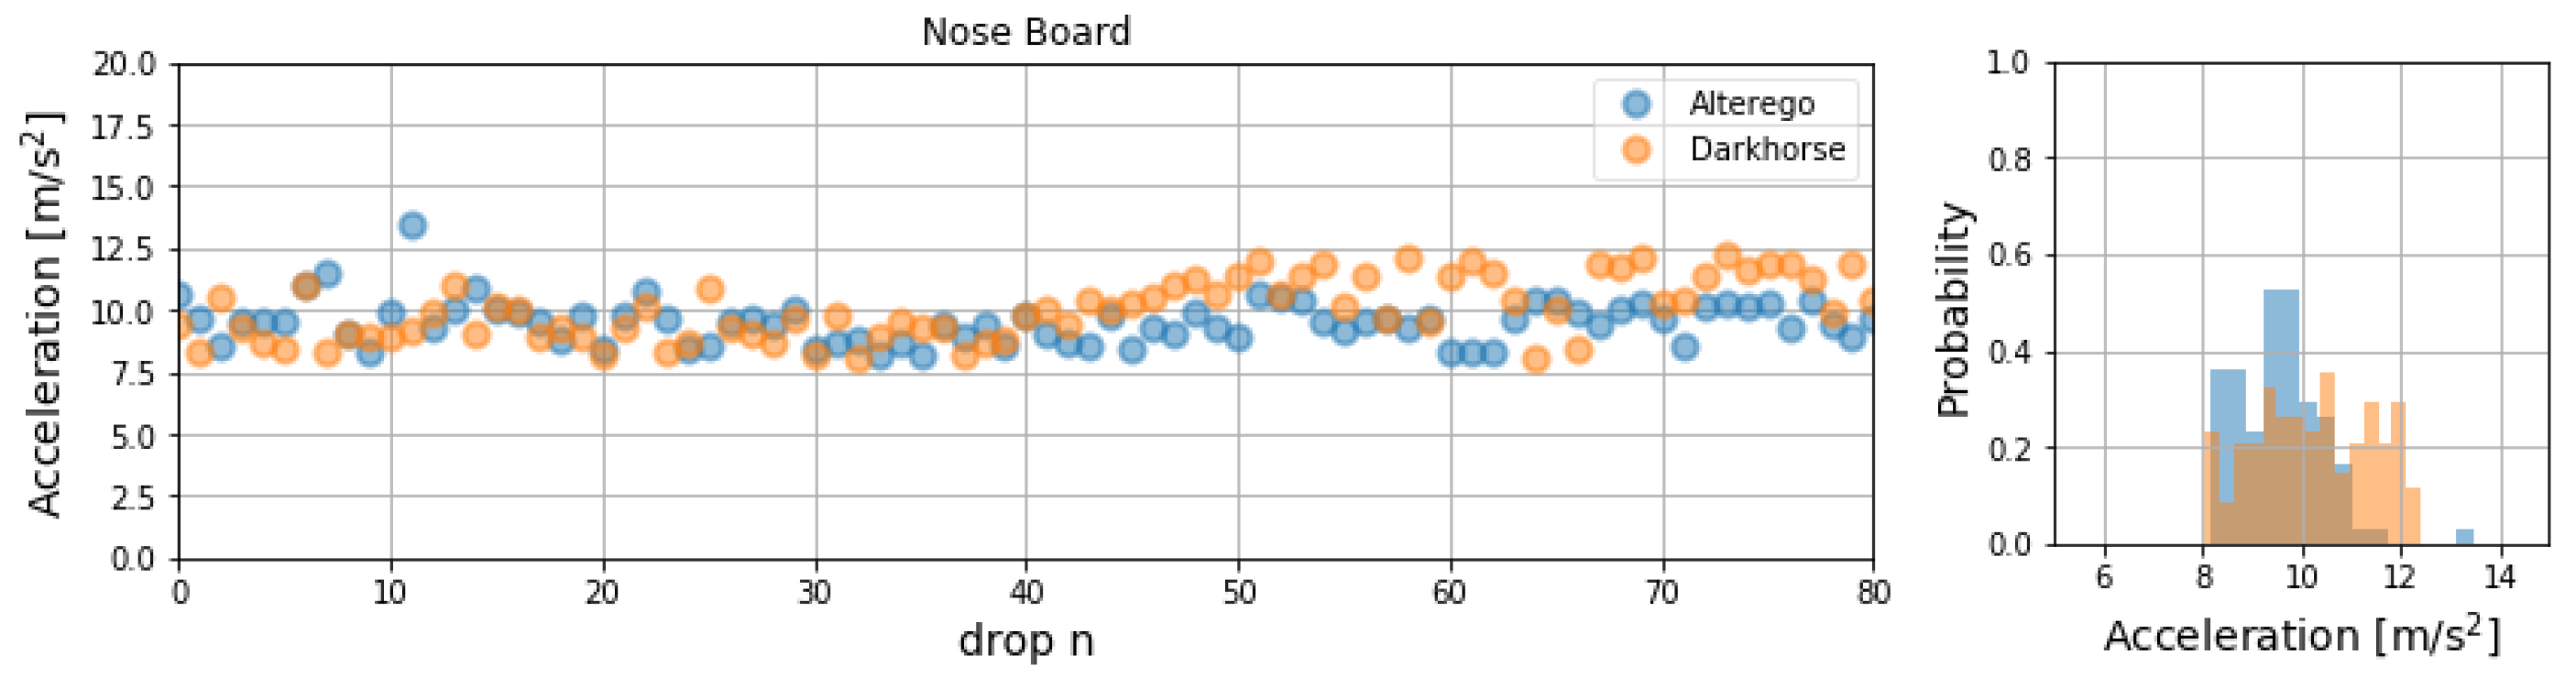
The weight drop test has the aim to evaluate how the board reacts when a weight is dropped on the board. 80 repetitions with a weight (3 kg) dropped from a height of 20 cm were performed for each board. The results from the accelerometers (Figure 4) indicate that the accelerations experienced by the Alterego are usually smaller and distributed over a narrower range (8–10 m/s2) compared to those experienced by the Darkhorse (range of 8–12 m/s2).
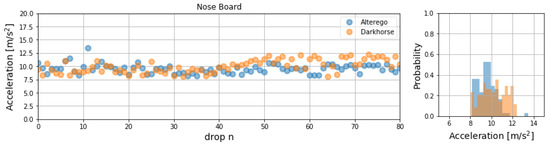
Figure 4.
Accelerations measured on the board from weight drop test. (Left) Peak values for each hit. (Right) histogram of the values.
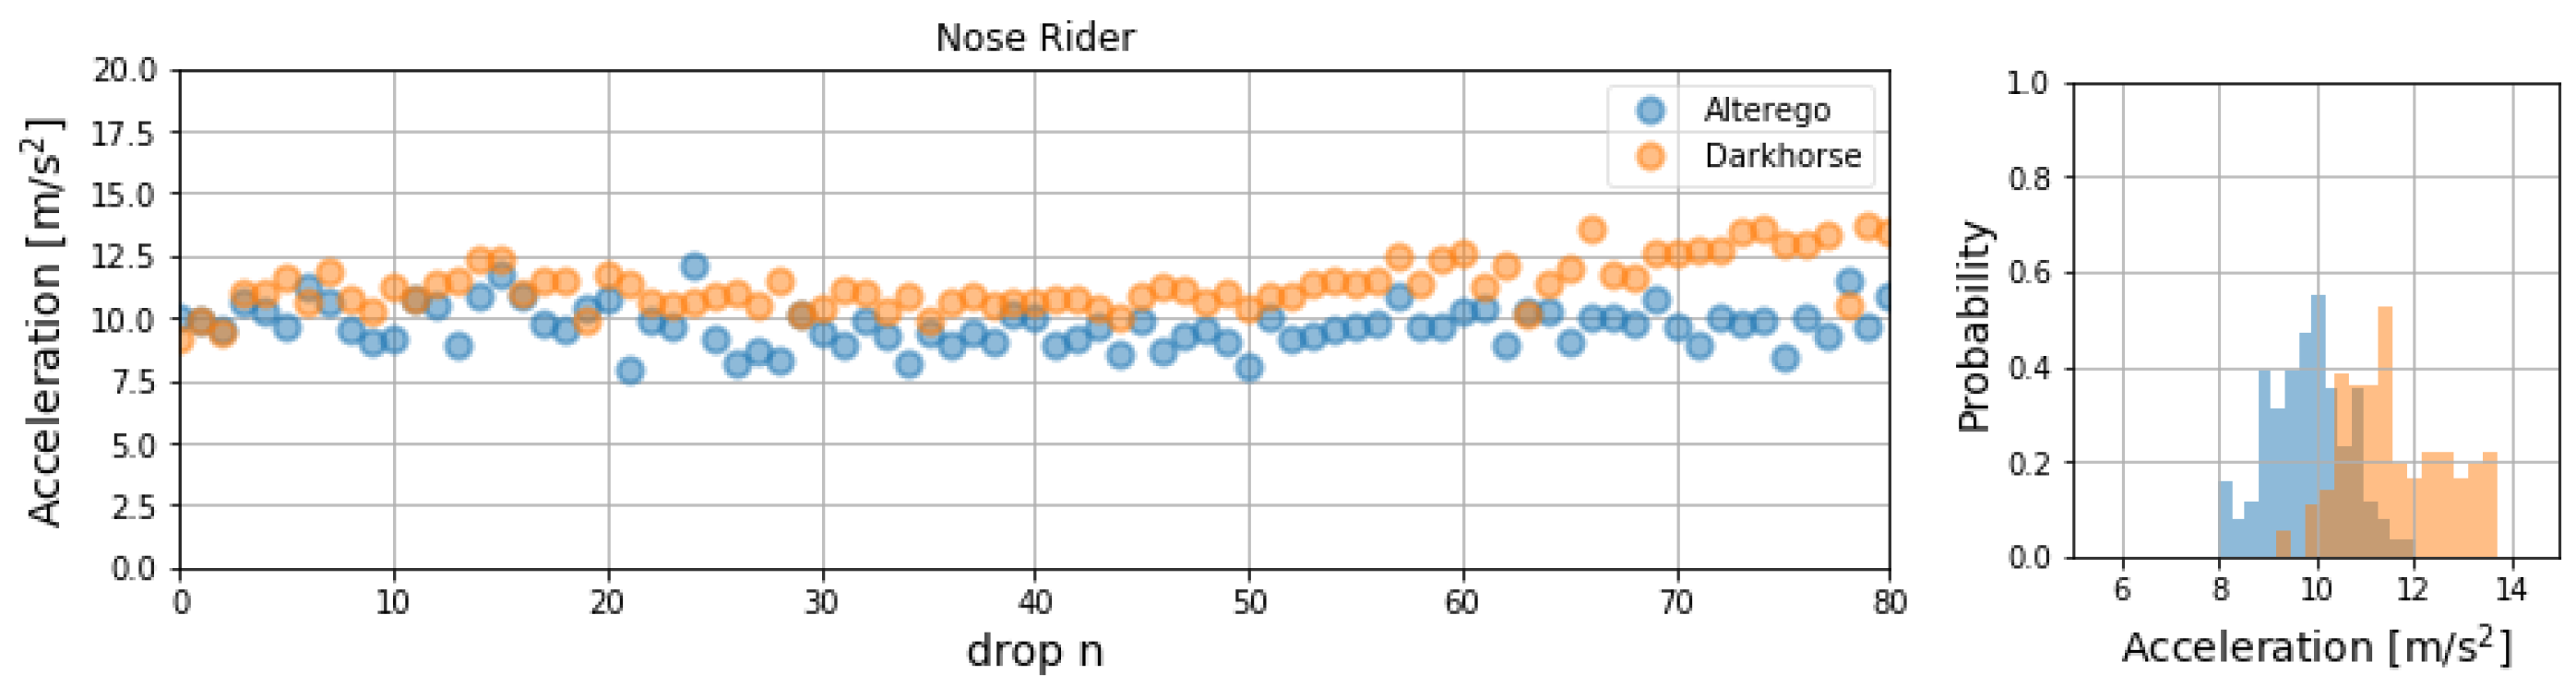
On the other hand, while the accelerations on board are higher for the Darkhorse but still comparable, the response felt by accelerometer placed on the weight, resembling the rider’s foot, is much lower on the Alterego than on the Darkhorse (Figure 5).
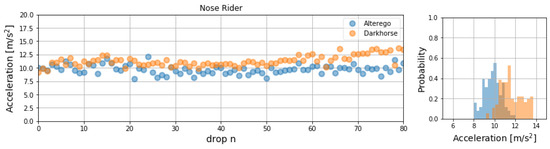
Figure 5.
Accelerations measured on the weight (mimicking the rider’s foot) from weight drop test. (Left) Peak values for each hit. (Right) histogram of the values.
This is probably due to the fact that the Altergo is clearly a softer board as shown in Figure 3. With the average acceleration being 9.6 m/s2 for the Alterego and 11.2 m/s2 this leads to the fact that the Alterego would dampen the impact felt by the rider on his foot by 15%.
3.3. Decay Tests
3.3.1. Nose Decay Test
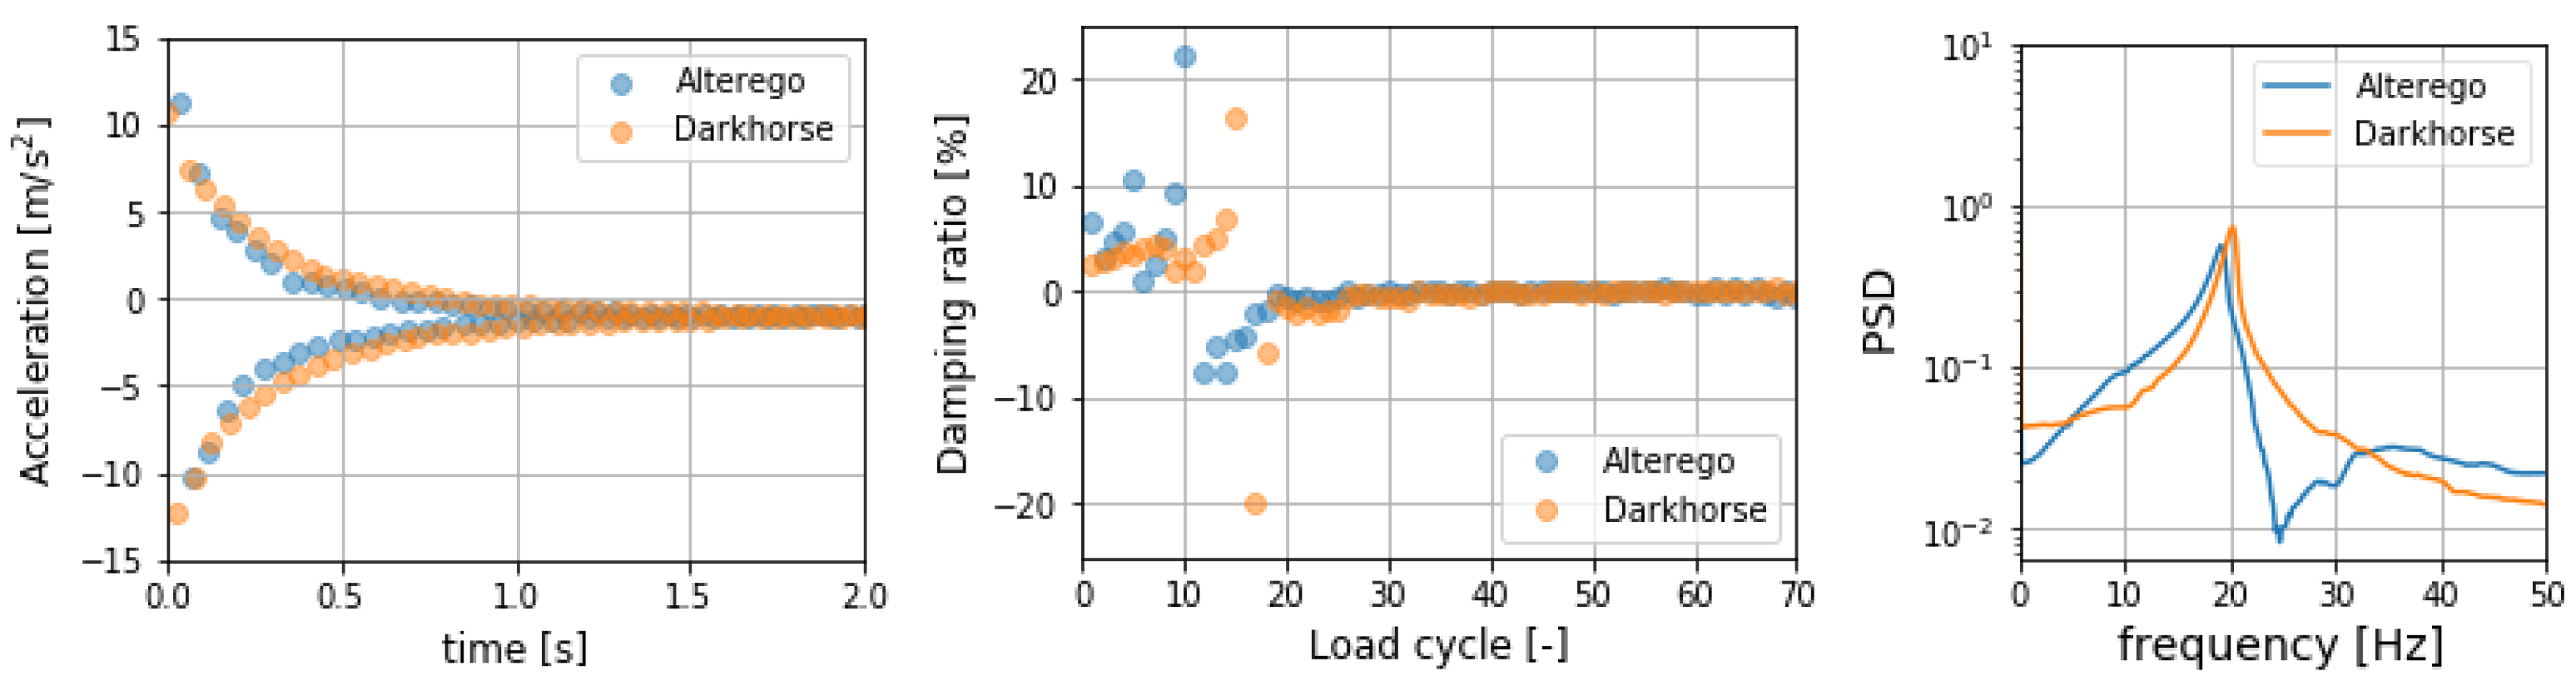
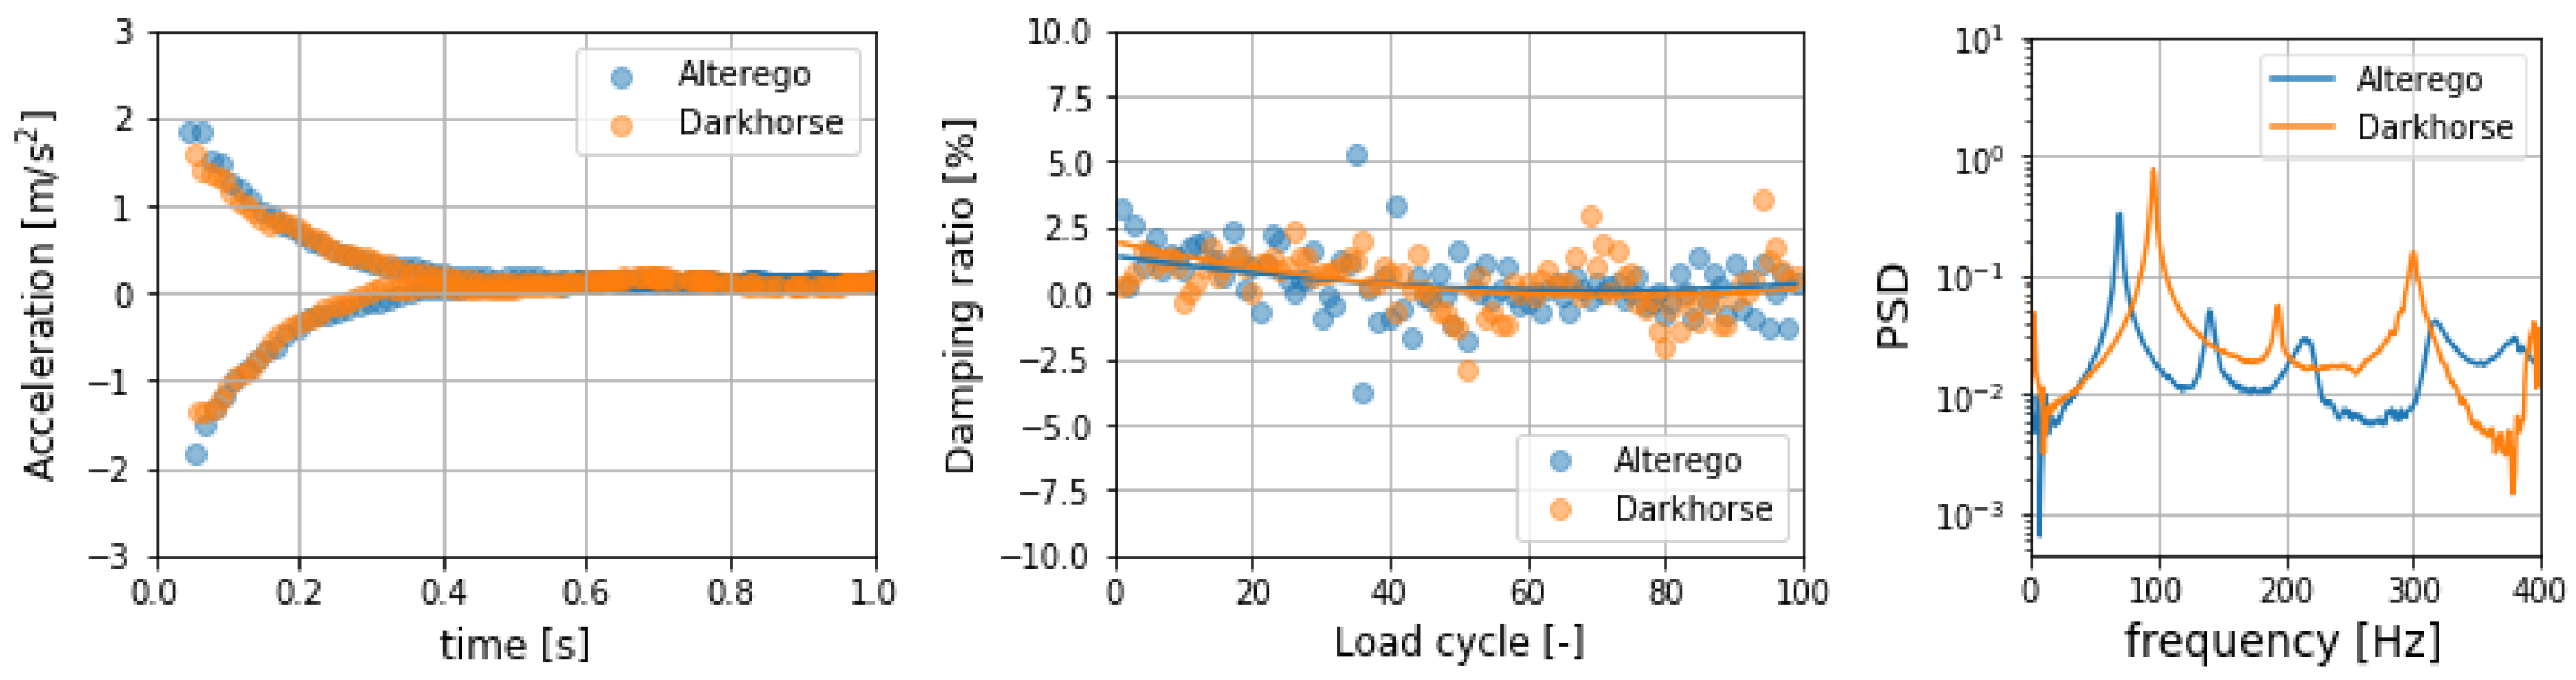
The nose decay test gives clear indication of the natural frequencies of the boards and of the damping values (Table 3 and Figure 6). Damping values on the nose are crucial in order to be able to dampen the vibrations in the front side of the board, allowing a smoother ride in choppy conditions. On the other hand, too soft a nose could result in a slower board and higher drag. The plots in Figure 6 show that the Alterego provides higher damping and has a lower flexural frequency, in line with the results shown in the previous paragraphs.
Table 3.
Overall values from decay tests.
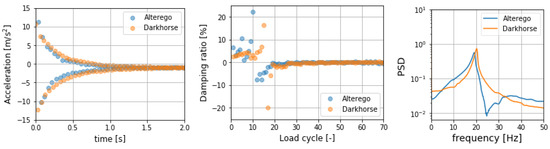
Figure 6.
Comparative results from nose decay test. (left) comparison of decay tests; (center) Damping ratio in each cycle; (right) Power Spectral Density and natural frequencies.
3.3.2. Tail Decay Test
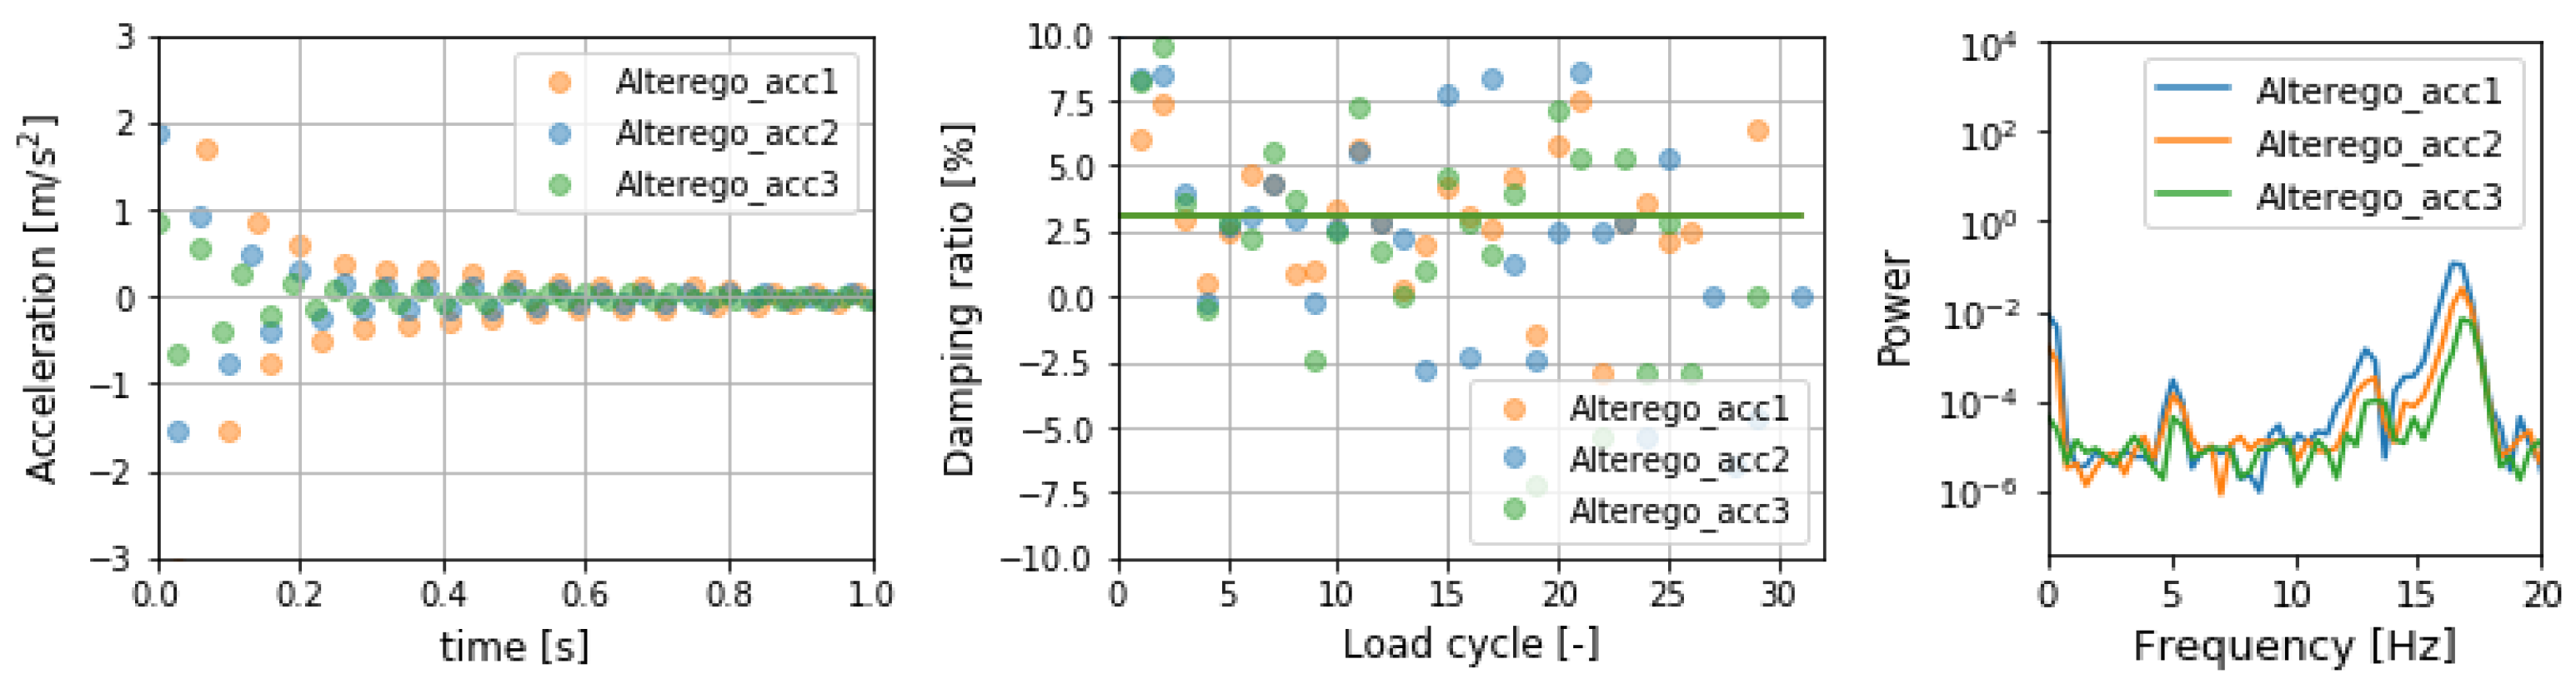
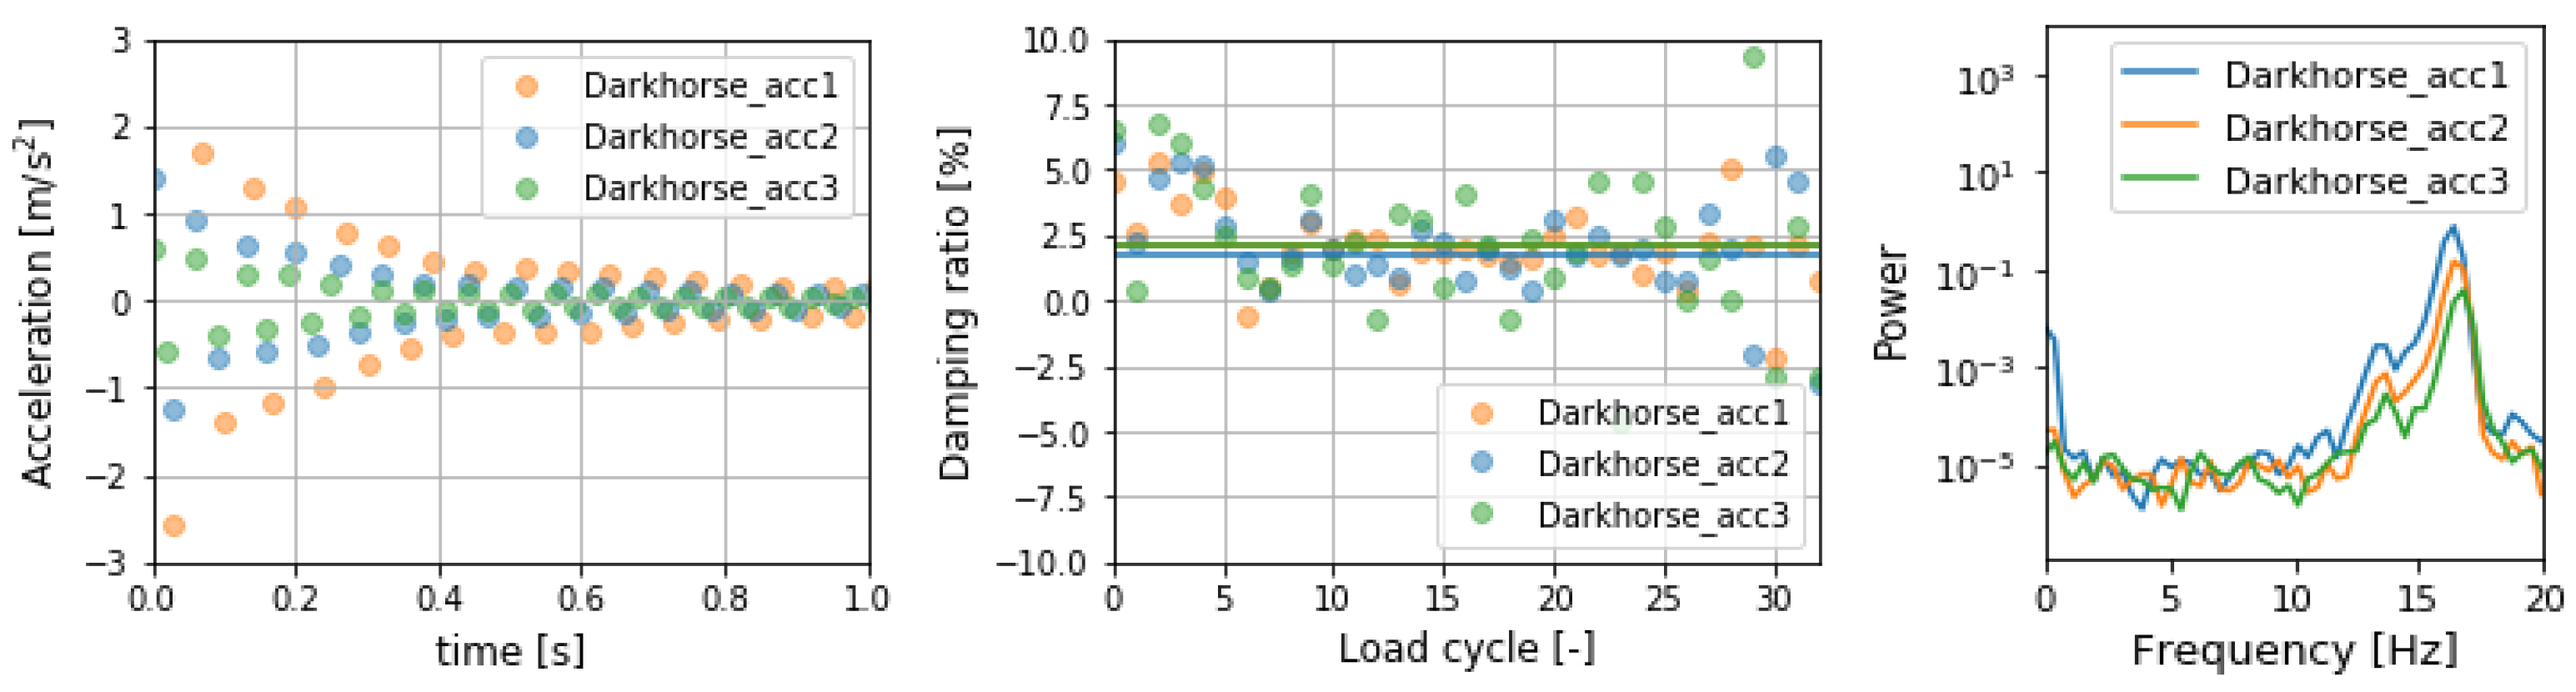
The results from the tail decay test (Table 3 and Figure 7) are in line with the other results presented in this paper. The Altergo board shows higher values of damping and generally lower frequencies compared to the Darkhorse (Figure 8). Three different peaks are visible from the power spectral density (PSD) plot shown in Figure 7 representing the three different flexural frequencies. The main natural frequency is located at 17 Hz. The average damping ratio is 3%.
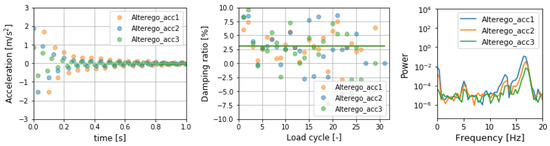
Figure 7.
Results relative to tail decay test for the Alterego Board. (left) comparison of decay tests; (center) Damping ratio in each cycle; (right) Power Spectral Density and natural frequencies.
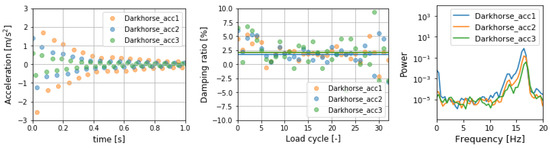
Figure 8.
Results relative to tail decay test for the Darkhorse Board. (left) comparison of decay tests; (center) Damping ratio in each cycle; (right) Power Spectral Density and natural frequencies.
The comparison between Alterego (Figure 7) and Darkhorse (Figure 8) shows that the Darkhorse has lower damping and slightly higher natural frequencies, confirming the findings from other decay tests. In addition, the frequency spreading shown in the damping ratio plot in Figure 8 (center) is less pronounced than for the Alterego board.
This might also be the cause of a more consistent decay test, with more constant damping ratio values. The average damping ratio of the Darkhorse is 2.2%, which is considerable lower compared to the Alterego value of 3.0%. Again, this might be due to the additional damping provided by the cork inserts.
3.3.3. Free Decay Test
The free decay test (Figure 9) shows minimal or no differences when it comes to damping between the two boards. However, some differences are visible in the PSD plot, i.e., the Alterego board exhibits lower natural frequencies than the Darkhorse board. This, we feel, is further indication that the Alterego is a softer (and more mechanically flexible) board compared to the Darkhorse. These observations are consistent with our findings described above.
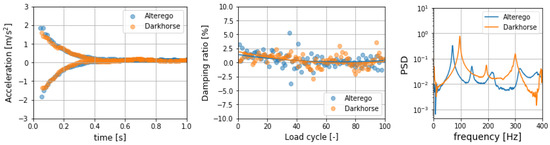
Figure 9.
Comparative results from free decay test. (left) comparison of decay tests; (center) Damping ratio in each cycle; (right) PSD Power Spectral Density and natural frequencies.
4. Conclusions
Two different boards were tested and compared using testing methodologies to evaluate their structural characterization. Key differences between the two boards were highlighted with the Alterego board (with EPS core and cork stringers) having lower torsional stiffness and providing more damping than the Darkhorse board (with PU core and wooden stringer). In general, our testing methodology can be used either to ensure quality in production or to allow riders to choose a board based not only on the geometrical shape and outline, but also based on its structural properties.
Funding
MihP is grateful for financial support from University of Wollongong Global Challenges Program and Faculty of Science, Medicine and Health.
Acknowledgments
The authors would like to thank Andrew Mehager from The Surfboard Warehouse and Alessanro Danese and Michele Piga from Alterego for providing the surfboards for the tests.
Conflicts of Interest
The authors declare no conflict of interest.
References
- Oggiano, L.; Pierella, F. CFD for Surfboards: Comparison between Three Different Designs in Static and Maneuvering Conditions. Multidiscip. Digit. Publ. Inst. Proc. 2018, 2, 309. [Google Scholar]
- Oggiano, L. Numerical Comparison between a Modern Surfboard and an Alaia Board using Computational Fluid Dynamics (CFD). icSPORTS 2017, 1, 75–82. [Google Scholar]
- Lavery, N.; Foster, G.; Carswell, N.; Brown, S. CFD modelling of the effect of fillets on fin drag. Reef J. 2009, 1, 93–111. [Google Scholar]
- Larsen, G.C.; Hansen, M.H.; Baumgart, A.; Carlén, I. Modal Analysis of Wind Turbine Blades; No. 1181(EN); Forskningscenter: Roskilde, Denmark, 2002. [Google Scholar]
Publisher’s Note: MDPI stays neutral with regard to jurisdictional claims in published maps and institutional affiliations. |
© 2020 by the authors. Licensee MDPI, Basel, Switzerland. This article is an open access article distributed under the terms and conditions of the Creative Commons Attribution (CC BY) license (https://creativecommons.org/licenses/by/4.0/).