1. Introduction
Already since the mid-1900s the measurement of pressure under the foot has been of interest, especially in medical research. In 1963, Baumann and Brand [
1] were the first to present a system of plantar pressure measurement based on thin transducers that could be directly applied to the foot of a patient. Through the application on the foot, the system could measure both pressure between foot and ground during barefoot walking and between the foot and the insole of a shoe during shod walking. The main advantage the authors attributed their system was the interchangeability of shoes when measuring in-shoe plantar pressure.
Of course, tremendous progress has been made since then in the development of modern plantar pressure measurement systems and a variety of both platform and insole systems are available to researchers. The area of application of insole systems has been widened from focusing on medical research to the implementation of plantar pressure measurement in the development of footwear and the research of performance in different activities, whereas running and walking are probably the areas with the biggest research interest [
2,
3].
In running, for example, multiple studies have already been published using insole plantar pressure measurement systems to investigate the effect of running speed [
4,
5], of insoles and orthotics [
6], of shoe and foot type [
7,
8,
9], or of different grounds [
10], respectively. In-shoe plantar pressure was even used with the aim to assess footwear comfort [
11,
12].
In only one of the nine mentioned studies did the authors explicitly describe the placement of the used sensor insoles within the shoe, whereas a placement on top of or below the standard insoles of the respective shoes would be possible. Even though it is highly expected that the conventional placement is placing the sensor insoles on top of the standard insoles, this study aimed to investigate the effect of a different placement on selected parameters of the plantar pressure measurement. If an influence were found, this would enhance the necessity to include that part of the procedure in the description of the methods in future publications. If no influence were found, it would open the possibility for researchers to choose freely, since a placement below the standard insoles could possibly improve the perception of participants while running with an in-shoe plantar pressure measurement system.
2. Materials and Methods
All measurements for this study took place in the Sports Technology Laboratory at the University of Applied Sciences, Technikum Wien (Vienna, Austria).
2.1. Participants
A total of five physically active participants (4 male/1 female; age: 35.8 ± 6.9 years; height: 178.6 ± 8.0 cm; weight: 76.2 ± 8.6 kg;
Table 1) voluntarily took part in this study based on given oral consent and no further ethical approval was requested. None of them had any current injuries of the lower extremities at the time of measurements. However, one subject had suffered a rupture of the anterior crucial ligament two years earlier and another subject suffered a rupture of the Achilles tendon three years prior to the measurements. Possibly relevant injuries of all other participants dated back to more than seven years prior to the measurements. At the time of data collection, only one participant claimed to have running as the main form of physical activity, and when running, all participants exerted heel-to-toe running.
2.2. Experimental Protocol
The participants had to perform several runs on a treadmill (h/p/cosmos quasar 4.0, h/p/cosmos sports and medical gmbh, Nussdorf-Traunstein, Germany) at a running velocity 10 km/h with three different running shoes. The running shoes that were used in this study were the Asics GEL-NIMBUS 18 (ASICS Corporation, Kobe, Japan), the Brooks GLYCERIN 14 (Brooks Sports Inc., Seattle, WA, USA), and the On Cloudflyer (On AG, Zurich, CH, USA). While the midsole geometry of the Asics and Brooks running shoes can be considered conventional, the geometry of the On running shoe has an open cell technology that is built-up from twelve so-called ‘clouds’ (
Figure 1).
The order in which the shoes were chosen was randomized. The participants were instructed to jump onto the already moving treadmill belt and run for about 45 s per run.
The study design did not follow a blinded study, hence the participants could see the shoe model they were wearing at the time. However, they were not specifically instructed about the detailed mechanical differences between the shoes.
Before each run, medilogic pressure-sensing insoles (T&T medilogic Medizintechnik GmbH, Schönefeld, Germany) were placed in both shoes. With each shoe, the participants had to run two times with a different placement of the pressure-sensing insoles. The first placement was considered as the supposed conventional placement (CP), where the pressure-sensing insoles were placed on top of the shoes’ standard insoles. Thereafter, the pressure-sensing insoles were placed below the standard insole of the shoes (nonconventional placement, NP).
While the participants were running once with CP and once with NP, plantar pressure data were collected from both feet at a recording frequency of 300 Hz, whereas only data of the right foot were considered for further data treatment. Soles and cables of the medilogic system were fixed to the participants’ legs using elastic Velcro straps so they would not obstruct them while running and the participants had to wear a portable patient modem around their waist, from which data were wirelessly transmitted to a PC. Raw data were stored as *.csv-files, including pressure data of every sensor of both insoles and the gait line (center of pressure, COP) of both feet.
After running with each shoe (both with CP and NP), participants were informally asked which condition they would subjectively consider as more comfortable (i.e., feeling more natural).
2.3. Data Analysis
Data treatment was done in MATLAB R2019a (The Mathworks Inc., Nattick, MA, USA) and prepared separately for each participant.
At first, data were imported and pressure values of each sensor were converted from 8 bit raw values to N/cm2. Total pressure was then calculated as the sum of the pressure of all individual sensors. Next, the coordinates of the COP were converted from DirX to mm based on the sensor size and intersensor distance according to the manufacturer. The start and end of 15 consecutive stance phases (StP) per run and per velocity were detected from the anterior–posterior COP (COP_AP) data, whereas the first five cycles of each run and velocity were neglected.
For every single cycle the maximum total pressure (MAX), mean total pressure (MEAN), and the range of the medial–lateral COP (COP_ML) and the COP_AP were detected. The difference in the values between CP and NP runs was then calculated in percentage of CP.
For each participant, an average was calculated per running shoe. Those values were then put into grouped boxplots. Furthermore, the mean result of all participants and the standard deviation were calculated per shoe and overall and plotted in bar graphs using MS Excel 2016 (Microsoft Corp., Redmond, WA, USA).
3. Results
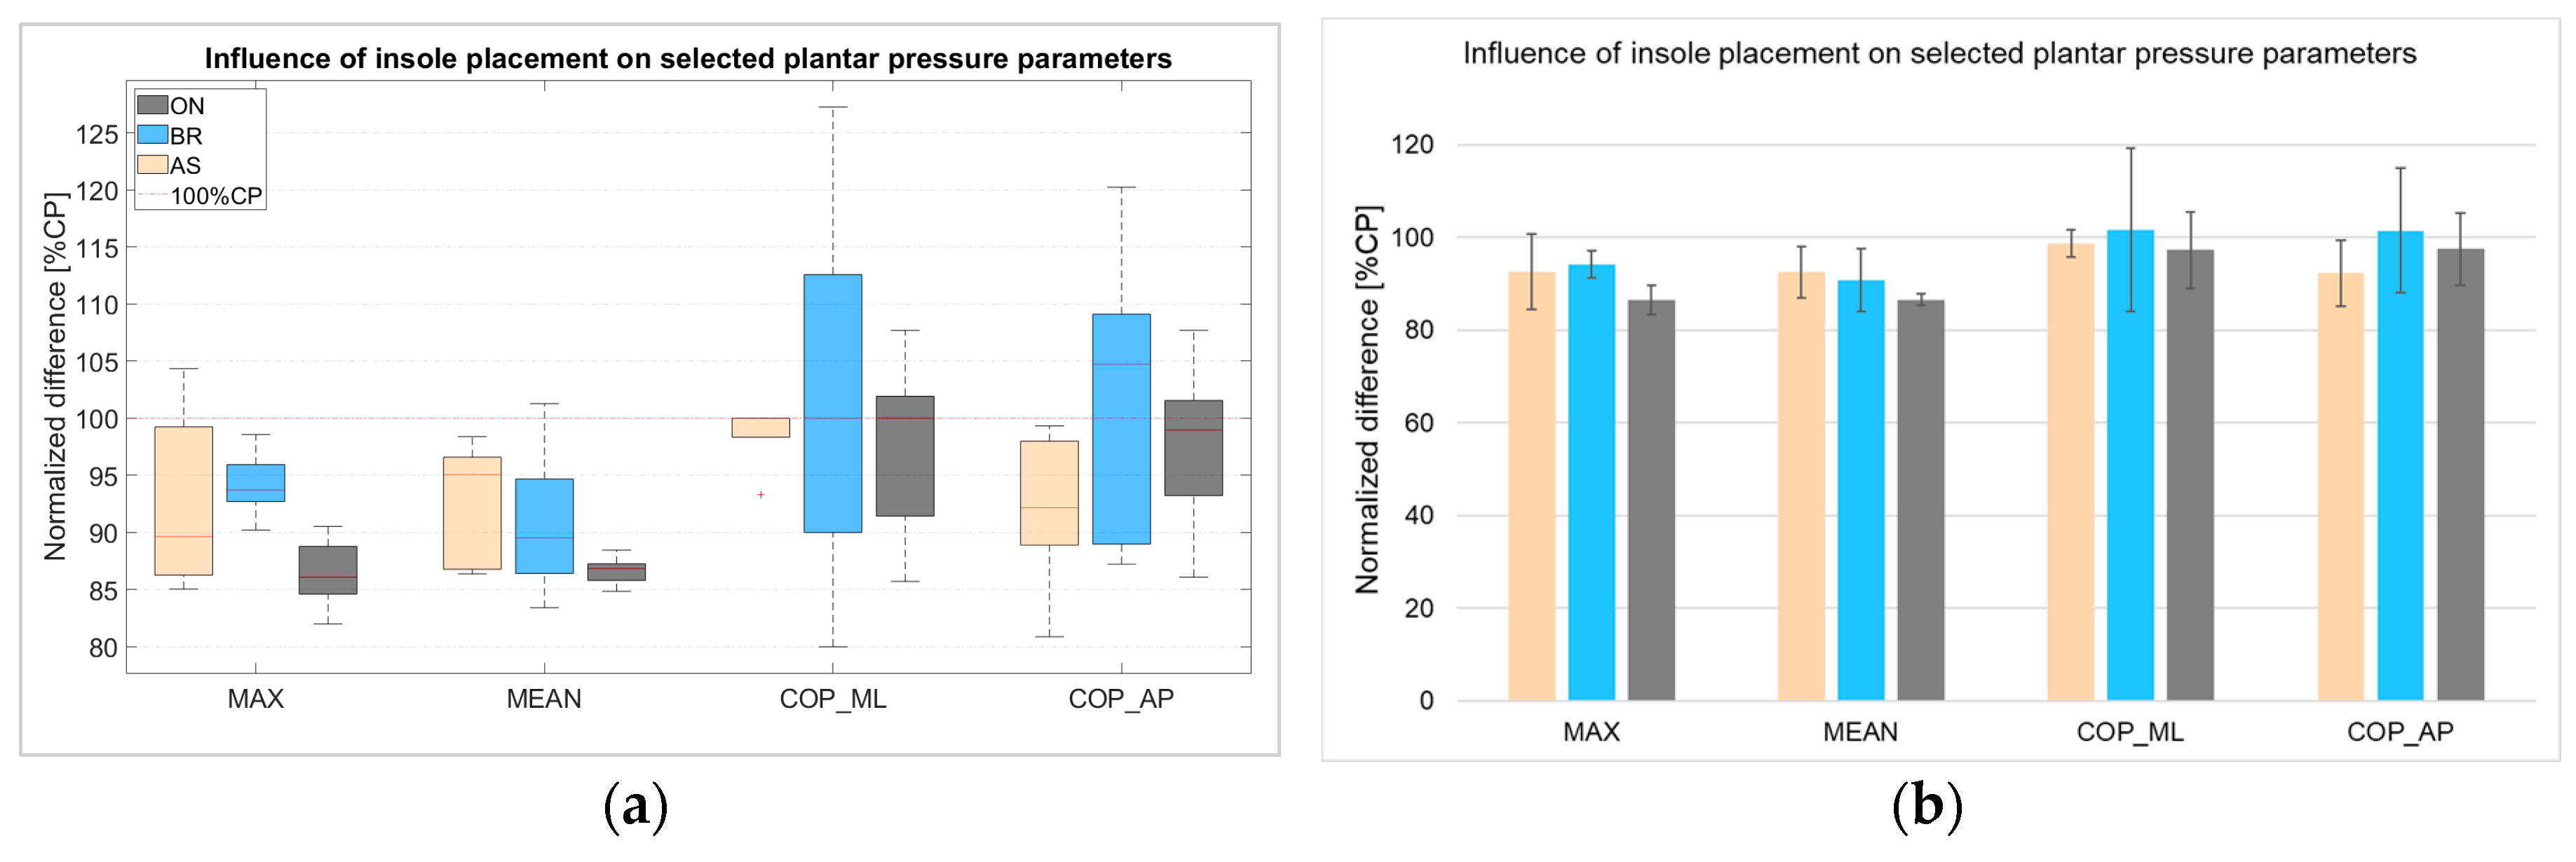
The results in the following figures show the influence of the insole placement on all selected parameters for all of the three tested running shoes. In
Figure 2a, each parameter shows a group of three boxplots, whereas each group contains the results of all three shoes. Each box was created from the mean MAX, MEAN, COP_ML, and COP_AP of all five participants. The red line within each box indicates the median value, whereas the box itself indicates the 25th to 75th percentile. Whiskers indicate the most extreme data points, in which outliers were not included. Where applicable, outliers were plotted as red ‘+2019.
Figure 2b contains the same data as the boxplots, whereas the bars show the mean values and the standard deviation of the results of all five participants for each running shoe.
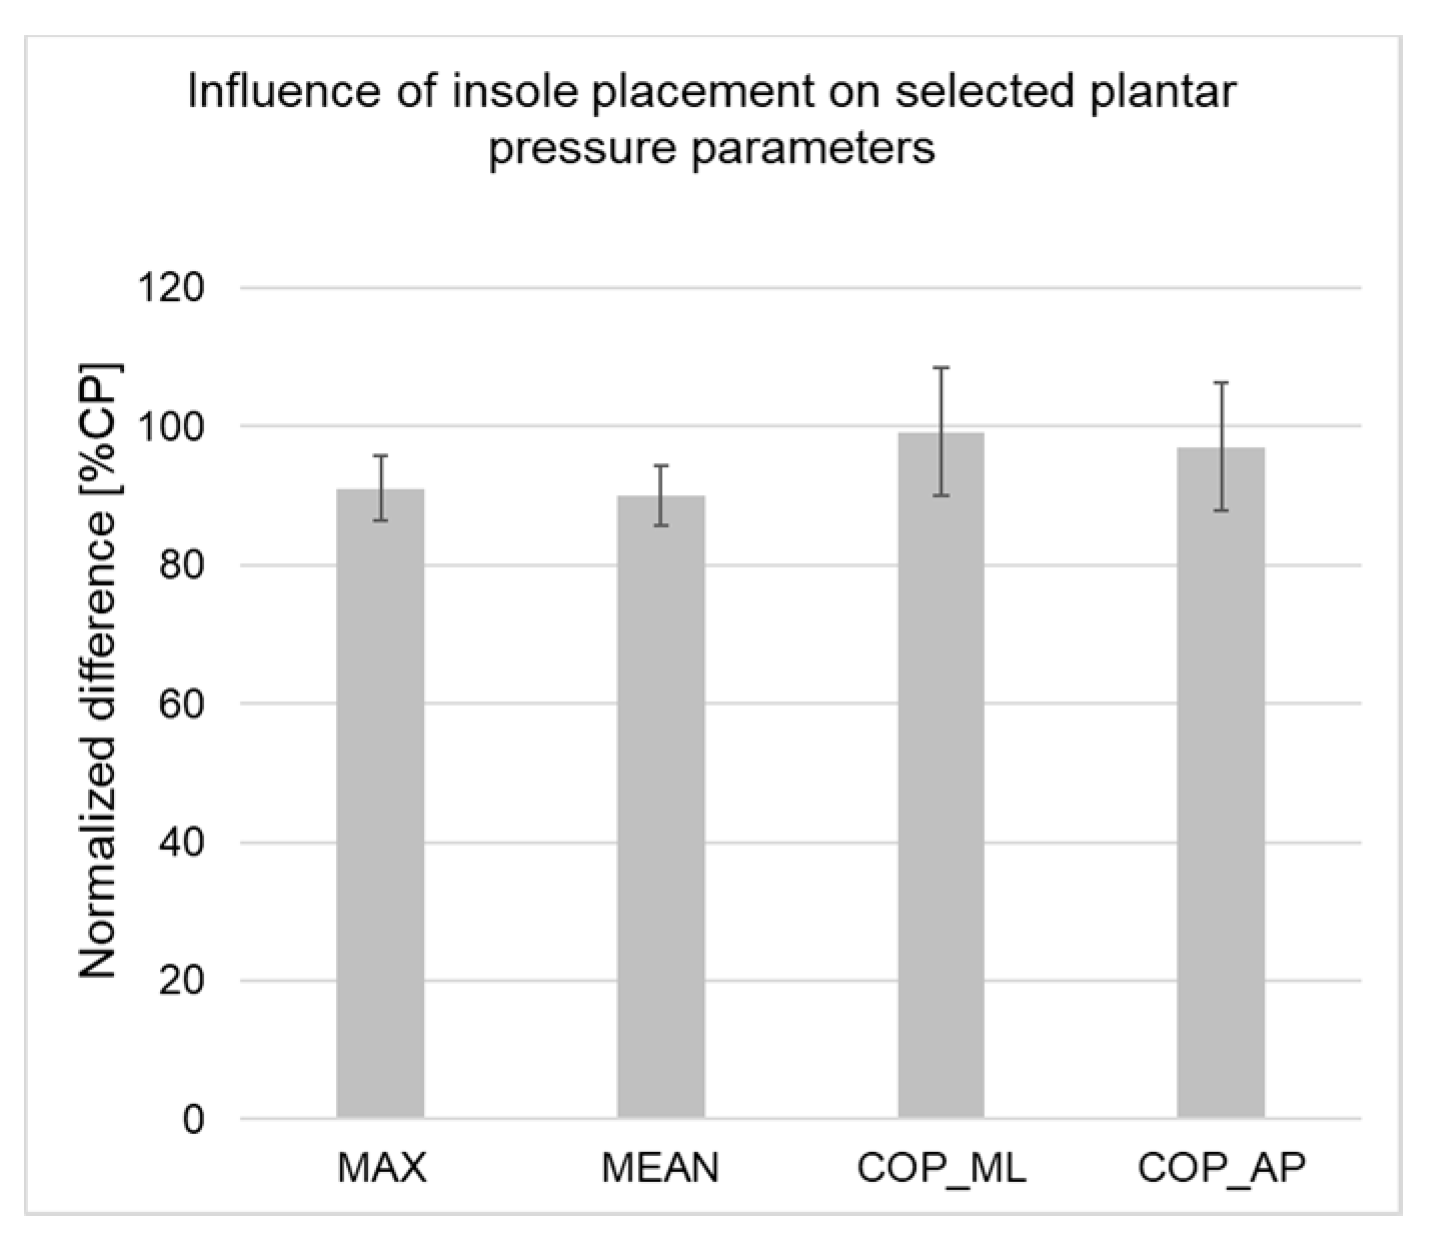
To show the overall influence of insole placement on the selected parameters independent from the shoe type,
Figure 3 shows the overall mean result of all participants and shoes per parameter and the respective standard deviation.
In all figures, a value of 100%CP would indicate no influence of the insole placement on the respective parameter, whereas a value above 100%CP indicates an increase of the parameter and a value below 100%CP indicates a decrease of the parameter when running with NP. Hence, in
Figure 2a the 100%CP mark was additionally highlighted by a red dotted line.
The highest difference can be seen for the MAX and MEAN for all tested running shoes and over all running shoes. The values of both MAX and MEAN decreased when the shoes’ standard insoles were placed on top of the pressure-sensing insoles. The results of the range of the COP seemed less affected by that change. The median values of all shoes of COP_ML even lay at 100%CP for all shoes. In terms of the mean results, the COP_AP with the Brooks and the On shoes were also very close to 100%CP.
Similar results can also be seen when the shoe type was not taken into consideration (
Figure 3), where again the COP_ML appeared to be least affected, followed by the COP_AP. MAX and MEAN were clearly reduced by the different insole placement.
4. Discussion
The results indicate that a placement of the pressure-sensing insole below the shoes’ standard insoles led to a sort of dampening effect, which had the biggest influence on the parameters MAX and MEAN and clearly reduced both of those parameters. However, parameters such as the ranges of the COP in ML and AP direction did not seem to be highly influenced by this adaption of methodology.
Moreover, even though the thickness of the medilogic insoles was only about 1 mm, four out of five subjects claimed that running with NP felt clearly more natural and more comfortable than CP, where they could at least slightly feel the pressure-sensing insole below the soles of their feet. However, comfort was not explicitly assessed during this study and, as already mentioned, subjects were only asked about their subjective comparison between the two conditions.
5. Conclusions
The findings of this study indicate that, depending on the research question and the parameters of interest, a placement of the pressure-sensing insoles like the NP can be permissible. Especially, when the interest is only on the COP traces, results could still be compared to previously presented studies. The reported positive influence on the subjective perception of the participants during running with NP could even lead to an advantage, since participants could run more naturally with possibly less adaption of their individual style of running.
A follow-up study with a higher number of participants and the inclusion of further parameters is planned to be conducted. In addition, in the future it would be an important asset to evaluate the mechanical properties of the shoes’ standard insoles, the pressure-sensing insoles, and the whole midsole, including the different conditions CP and NP.


