Abstract
A thorough understanding of how the delivered face angle and club path of a golf club influences the initial launch direction of a golf ball can play a significant role in the design of various club types as well as help players and coaches better understand performance in the field. A theoretical model based on a Hertzian impact formulation with the inclusion of tangential compliance via Coulomb friction is compared to empirical results. This comparison demonstrates that the initial launch direction of a golf ball for a given club path and face angle can be sufficiently predicted by the theoretical model, providing insights into the mechanisms leading to different launch direction percentages relative to face angle for various club types. Additionally, the relationship between launch direction and the coefficient of friction is explored for various angles of incidence.
1. Introduction
Golf is one of the most popular recreational sports throughout the world, yet the physics governing both the motion of the golf swing and the impact of a golf club with the ball are quite complex. Many research efforts and publications have examined how both the equipment and biomechanical behaviors can influence performance in order to better equip instructors to improve a player’s ability and guide improved club designs [1,2,3,4]. A key element to the game of golf is the ability to control both the direction and distance, the importance of which has been statistically analyzed by Broadie [5]. The speed, orientation, and direction of travel of the club head at impact are the primary elements that determine a ball’s speed, spin, and start direction. For an oblique impact where the club normal direction and club velocity (also referred to as the path) are not collinear, the launch direction of the golf ball will generally lie somewhere between the face normal and club path directions [2]. As a result, players and golf coaches would greatly benefit from understanding the quantified relationship between a club’s delivery and the resulting direction of ball flight. Both Cochran and Stobbs [1] as well as Trackman (published by Dewhurst [4]) have published values quantifying the relationship between the launch angle of a golf ball struck by different clubs and the resulting launch angle. More recently, the current authors also published the results of an experimental study that explored these relationships [6]. Comparing the values published by Trackman and by the current authors differed slightly from each other, so an effort to understand the possible discrepancies along with the underlying physics was initiated.
The collision between a golf ball and club, which determines the initial launch conditions of a golf ball, involves some very high forces occurring over short period of time. Normal forces can reach up to 10 kN during an impact interval of less than 500 μs. Both the normal and tangential forces occurring between and club and ball have been studied empirically by a number of researchers [4,7,8,9]. In order to gain a full understanding of the phenomena governing an oblique impact, it is desirable to interpret experimental observation through the lens of a theoretical model. One approach to modeling the physics and behavior of such impacts is to define empirically derived coefficients such as normal and tangential coefficients of restitution [4,9]. This approach can help establish some predictive power but is limited to the experimental conditions driving the coefficients and does not fully characterize the transient forces occurring during impact. As a result, insights into the governing physics determining behavior may not be fully captured and subsequently utilized to completely understand the phenomena that determine the resulting launch angles and spin rates. For example, it has been proposed that the observed launch angle for a driver occurring closer to the face direction than for a higher lofted club is a result of the relatively smooth face of a titanium driver producing less friction between the face and the ball [4]. The results of the current work will suggest that this behavior is governed by the compliant behavior of the reaction forces at impact and would be present even if the faces of a driver and high lofted iron were equally as “smooth”. Alternatively, finite element models or lumped parameter approaches [10,11,12] have been used to explore the behavior of oblique impacts occurring in a variety of sports, but the utility and flexibility of an elastic continuum-based model was chosen for the current work due to the versatility and effectiveness in order to extract insights from experimental data.
There is a gap in the current literature describing the empirical behavior observed during a golf ball and club impact, as there has yet to be a publication directly connecting the fully transient impact force between club and ball to the empirical observations of resulting launch angle. The current work utilizes a modified Hertzian contact model to explore the mechanisms that govern the initial launch direction of a golf ball relative to the face normal and velocity of a club head. This will be reported primarily through a value referred to as the launch ratio. This is defined as the ratio of two angles: the launch direction relative to path (θ) and the face normal relative to path (α). This ratio is depicted in Figure 1. By validating the model against empirical results and subsequently leveraging it to evaluate a range of conditions, the underlying physics behind the launch direction percentages are better understood. The presented results provide great benefit to both players and coaches, as well as golf club designers.
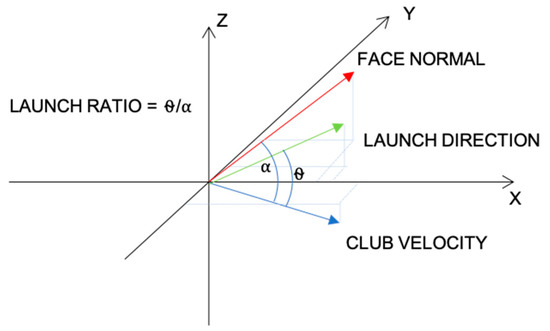
Figure 1.
Depiction of the launch ratio definition.
2. Theoretical Model
2.1. Overview
When a spherical object collides with another spherical object or half-space (planar surface), there is a radial distribution of pressure that sees a maximum at the center of the circular contact area. This behavior can be characterized by a Hertzian contact model [13] and can be expanded to account for tangential compliance under the action of Coulomb friction. This is done by separating the impact problem into two almost independent tangential and normal impact problems and discretizing the contact area into annular strips in order to numerically iterate to determine which of those strips are slipping and which are sticking to the surface during impact [14,15]. The mixed boundary value problem for the tangential tractions and displacements is reduced to a system of equations that are solved simultaneously for each time step during the impact interval. The simulation steps incrementally forward in time until the normal component of displacement reaches zero. This model has been used previously to study the generation of spin by the United State Golf Association [16]. The model by Maw et al. characterizes the properties of a sphere impacting an elastic half-space by the sphere’s moment of inertia, I; modulus of rigidity, G; and its Poisson’s ratio, ν. Two notable assumptions of the model are that the coefficient of friction, μ, is constant between the two surfaces (and the same for static and dynamic conditions) and that the only source of energy loss during impact is friction. The latter assumption implies that the normal component of impact is purely elastic. This was addressed in this work by adjusting the initial velocity in order to account for inelasticity. With the annular formulation of the contact area, the model allows for situations where the central region of contact is stuck, while the periphery points of contact can experience slip (or microslip) in addition to conditions of gross stick or slip. In an effort to validate the use of this model to characterize the behavior of impact between a club and ball, experiments were conducted to estimate reasonable coefficients of friction for different ball/surface combinations. These values were then used to compare the model-predicted launch angles to those observed in an air cannon.
2.2. Validation
During the ball/surface impact under the sliding condition, the force of friction can be assumed to fair degree to be directly proportional to the normal applied load (Amonton’s Law). Thus, this behavior can be utilized to estimate the coefficient of friction between ball and surface. In order to get a better understanding of what reasonable values of the coefficient of friction might be between a golf ball and the surface of a golf club, an experiment was conducted where a sled of three golf balls was pulled across a plate with grooves and a blasted surface, characteristic of an iron-type golf club. A weight was placed on top of the sled while it was pulled across the plate at a constant speed. The force required one to pull the plate at a constant velocity was measured by a load cell (Transducer Techniques, MLP10, Temecula, CA, USA) placed in line with the pull motor and sled. This experiment was conducted for both a urethane-covered golf ball and a surlyn covered ball, and is depicted in Figure 2. The ratio of tangential and normal loads led to values of 0.4 and 0.35 for the urethane and surlyn covered balls, respectively. Although the loads in this experiment are much lower than those characteristic of a club-ball impact, the experiment provided insight into the rough magnitude of μ between a ball and club face.
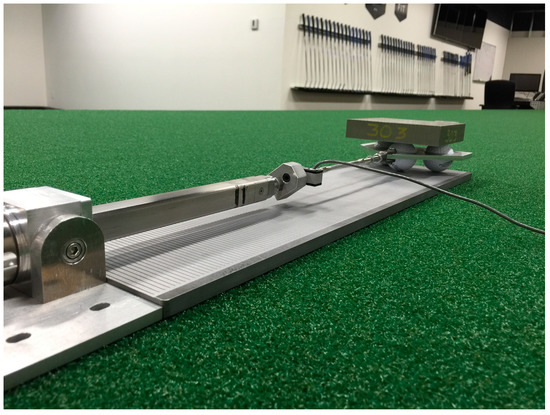
Figure 2.
Experimental setup used to measure coefficient of friction between golf ball and surface.
In order to validate the theoretical model, a controlled experiment was conducted where a urethane covered ball was fired at a steel plate with a comparable surface to the one pictured in Figure 2 at 106 mph. The plate angle was varied between 3 degrees and 33 degrees, and the impact was recorded with a Phantom camera at 9500 fps (Vision Research, Wayne, NJ, USA). The incident and outgoing angles of each impact were measured using the Tracker Video Analysis software (https://physlets.org/tracker/) for multiple impacts at each plate angle. The theoretical model was then used to simulate impacts under the same conditions in order to validate the results produced by the model. A μ value of 0.4 was used to generate the model results. Figure 3 shows good agreement between the model and the experimental results for the angles examined (mean absolute error of > 1°).
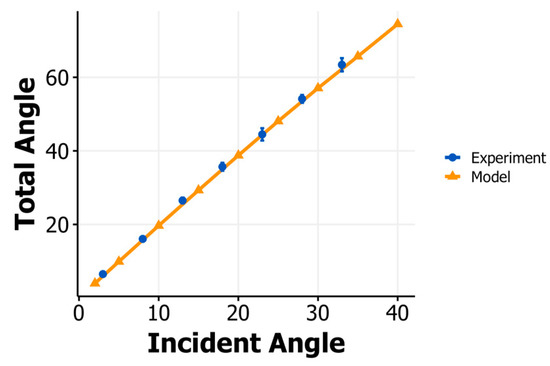
Figure 3.
Total angle (incident angle plus outbound angle) vs. incident angle for experiment and model.
3. Experimental Methods
3.1. Motion Capture Testing
One-hundred and fifty-seven right-handed golfers (handicap: 10.1 +/− 10.0) volunteered to hit five shots with a driver and five with a 7-iron. Additionally, a subset of these players (10 players, handicap: 1.2 +/− 1.7) were asked to hit 10 shots each with a 58° wedge. Golf club kinematics were collected using an 8-camera optical system (T40S, Vicon Motion Systems Ltd., Oxford, UK) operating at 720 frames per second. Reported ball initial conditions were recorded with a Foresight GC2 launch monitor (Foresight Sports, San Diego, CA, USA) [17]. The results of the motion capture experiment include 731 shots with the driver, 745 shots with the 7-iron, and 99 shots with the wedge. Table 1 reports the launch direction in the vertical plane as a percentage of the start direction relative to the face normal direction in the same vertical plane [6], also referred to as the delivered loft. Therefore, a value of 100% would describe a launch angle that is aligned with the face normal and a value of 0% would describe a launch angle aligned with the path (or velocity vector) of the club head. A comparison is made to the same values reported by Trackman and published by Dewhurst [4]. Overall, there is reasonable agreement between the values in Table 1, with the biggest discrepancies coming from the driver and 7-iron. For further detail on the experimental setup or dataset described in this section, please refer to Wood, et al. [6].

Table 1.
Comparison of launch ratios in the vertical plane.
4. Results
In order to understand the elements leading to the empirical behavior described in Section 3.1, the aforementioned theoretical model was used to predict the resulting launch angle for each empirical data point. The club head velocity at face center and the face normal were used to determine the incident angle and speed for the model, and a coefficient of friction, μ, was initially assumed to be 0.4 based on the results presented in Section 2.2. A launch angle in the reference frame corresponding to the experiment described in Section 3.1 was determined by the normal and tangential impulse values calculated by the model. Figure 4 and Figure 5 show the results of this comparison. From these results, it is clear that the model does a great job of capturing the overall trend of launch angle relative to path when compared to the face normal relative to path for a μ value of 0.4. This provides a high degree of confidence in the model’s ability to capture the underlying physics that dictate the ball’s initial launch direction, even though the impact surface in the model is assuming to be rigid while it is acting in large part as a free body in the experiment. Error between the experiment and model can be attributed to this assumption, as there will inevitably be a component of the launch direction that falls out of the plane defined by the face normal and club velocity, and slight changes in the face normal direction may occur during the impact interval since the club head is not fixed in inertial space. Continuing to examine Figure 4, it is shown that as the angle between the face normal and path increases, the launch angle with respect to the path increases at a decreasing rate. This change in rate leads to the lower launch ratios seen for higher lofted clubs. Additionally, Figure 5 shows the empirically observed ratio for the three different club types and again shows good agreement but also highlights slight discrepancies between the model and experiment with a μ value of 0.4 for the lower angles of incidence. Given the results of the model, the effect of various coefficients of friction can be explored in order to determine the effect they may have on the initial launch direction of the ball. More importantly, the transient behavior of the forces can be examined to gain insight into the ”why” behind different launch angle ratios for the various impact angles and how the coefficient of friction plays a role in this behavior.
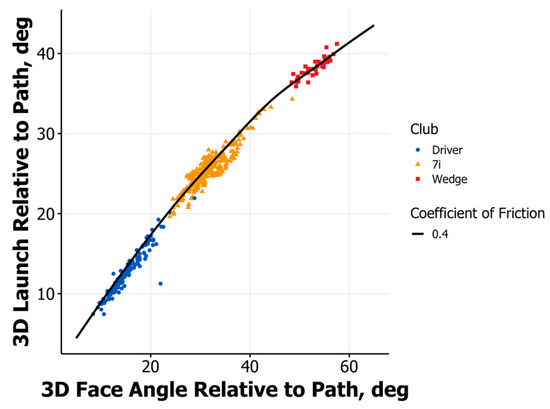
Figure 4.
Launch angle relative to club path vs. face normal relative to club path.
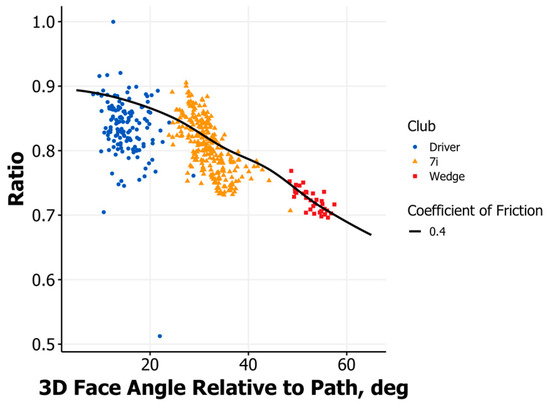
Figure 5.
Launch direction ratio vs. face normal relative to club path.
5. Discussion
A major benefit of a model that captures the underlying physics and behavior at impact is that one can then evaluate different scenarios and gain insights into what is causing the results seen in experiments. Of particular interest is an explanation behind why the ratios change with loft. As mentioned earlier, it has been suggested that metal woods have a smoother face than irons, and therefore have different characteristic frictions between the face and the ball. This hypothesis can be explored by the model by evaluating the launch angle ratio over a range of incident angles and varying the value of μ. Figure 6 shows the results of such an analysis. Looking at the curves that are characteristic of dry clubhead surfaces (>0.3), it is clear from the model that the launch ratio monotonically decreases for increasing loft, even if the value of μ remains constant across the lofts. All ratios captured in Figure 6 are above 0.5, which means that the launch direction is closer to the direction of the face rather than the path. If any of these values were to fall below 0.5, that would mean the launch direction would be closer to the path. Furthermore, for angles that are characteristic of metal woods (i.e., less than 20°) the lowest coefficient of friction actually corresponds to a launch angle that is more closely aligned toward the path (i.e., lower launch ratio) than the higher coefficients of friction. This is at a glance counterintuitive and the opposite of some proposed hypotheses [4]. Why would a surface with a lower coefficient of friction lead to a lower launch ratio instead of a higher one? The theoretical model provides the ability to examine both the tangential force behavior occurring during impact and whether the areas of contact are slipping or are in stick at different points during the impact interval. The tangential forces for μ values of 0.15, 0.25, and 0.35 are presented in Figure 7. This figure not only displays the compliant nature of impact but shows how the higher coefficient values lead to a much higher “negative” tangential impulse. It is this negative impulse that brings the launch angle of the ball closer to the normal direction of the face. For the lower coefficient, the area of contact is actually in gross slip (i.e., entire contact area is slipping) for a short period of time before sticking, while for the two higher coefficients the contact area is in gross stick almost immediately at the instant of contact. This behavior also offers a possible explanation why the predicted launch ratio compared to the experimental for the driver in Figure 5 was over predicted by the model. It is possible that coefficient of friction may be less than 0.4 for the driver in the experiment leading to the lower launch ratio value. Looking at the higher lofts, or angles of incidence, there are some larger differences in launch ratio for the different values of μ. For the higher lofts, the initial part of the impact interval is characterized by gross slip, and for higher values of μ the contact area (in part or whole) transitions to stick. This behavior for the high values of μ leads to lower launch angles, while for lower values of μ the launch ratio is high (i.e., launch is closer to the face) since the contact surface is in gross slip during the entirety of contact. Lastly, when comparing the two sets of published values for launch ratio in Table 1, possible differences in contact friction can potentially explain the difference in empirically measured values.
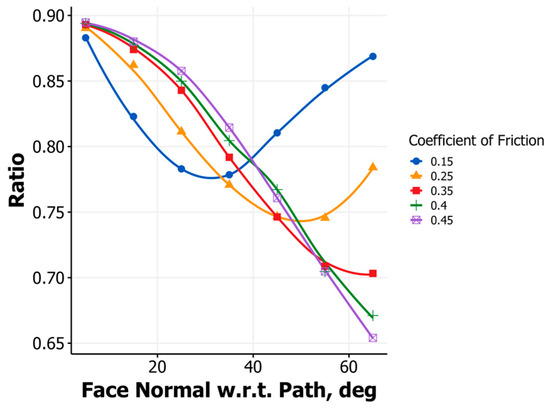
Figure 6.
Launch direction ratio vs. face normal relative to club path for various coefficients of friction for an incident velocity of 80 mph.
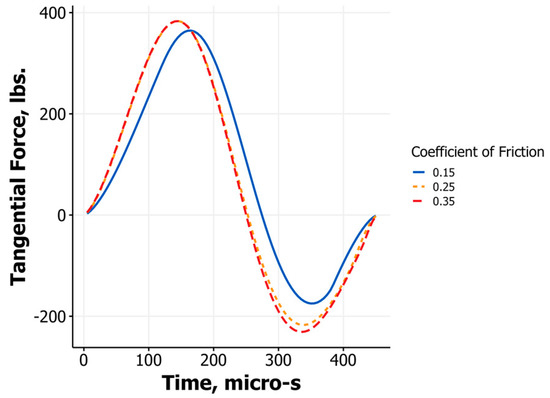
Figure 7.
Tangential forces during impact as a function of time for an incident velocity of 80 mph and angle of 15°.
6. Conclusions
The experimentally measured launch ratios of a golf ball relative to the club face normal and club velocity for various club types have been successfully explained through the implementation of a modified Hertzian contact model. It has been shown that the dominant phenomenon that leads to the variation in launch ratio for different lofts is the compliant nature of the club–ball interaction. Even if the surface characteristics remain constant, the launch ratio will gradually decrease for increasing lofts for ranges of μ representative of dry contact. It is also shown how the behavior of the launch ratio for different club types and angles of incidence can be greatly influenced be the frictional characteristics of the surface.
Author Contributions
E.H. developed the theoretical formalism, performed the analytic calculations and numerical simulations. Both P.W. and C.B. contributed to the final version of the manuscript. T.N. carried out the physical experiment.
Funding
This research received no external funding.
Conflicts of Interest
The authors declare no conflict of interest.
References
- Cochran, A.; Stobbs, J. Search for the Perfect Swing; Lippincott: Philadelphia, PA, USA, 1968. [Google Scholar]
- Jorgensen, T. The Physics of Golf; Springer Science: Philadelphia, PA, USA, 1999. [Google Scholar]
- Penner, A. The physics of golf. Rep. Prog. Phys. 2002, 66, 121. [Google Scholar] [CrossRef]
- Dewhurst, P. The Science of the Perfect Swing, 1st ed.; Oxford University Press: New York, NY, USA, 2015. [Google Scholar]
- Broadie, M. Every Shot Counts; Penguin Books: New York, NY, USA, 2014. [Google Scholar]
- Wood, P.; Henrikson, E.; Broadie, C. The influence of face angle and club path on the resultant launch angle of a golf ball. In Proceedings of the 12th Conference of the International Sports Engineering Association, Brisbane, Australia, 26–29 March 2018; Volume 2. [Google Scholar]
- Cornish, J.; Otto, S.; Strangwood, M. Modelling the Oblique Impact of Golf Balls (P128). Eng. Sport 2008, 7, 669–675. [Google Scholar]
- Arakawa, K.; Mada, T.; Komatsu, H.; Shimizu, T.; Satou, M.; Takehara, K.; Etoh, G. Dynamic deformation behavior of a golf ball during normal impact. Exp. Mech. 2009, 49, 471–477. [Google Scholar] [CrossRef]
- Cross, R.; Dewhurst, P. Launch speed, angle and spin in golf. Eur. J. Phys. 2018, 39, 065003. [Google Scholar] [CrossRef]
- Kensrud, J.R.; Nathan, A.M.; Smith, L.V. Oblique collisions of baseballs and softballs with a bat. Am. J. Phys. 2017, 85, 503–509. [Google Scholar] [CrossRef]
- Rokach, I.; Shimizu, T.; Takahashi, K.; Komatsu, H.; Satoh, M. Science and Golf IV; Routledge: Abingdon, UK, 2002; pp. 515–523. [Google Scholar]
- Roh, W.; Lee, C. Correlation Between the Linear Impulse and Golf Ball Spin Rate (P35). Eng. Sport 2008, 7, 199–206. [Google Scholar]
- Johnson, K. Contact Mechanics; Cambridge University Press: Cambridge, UK, 1985. [Google Scholar]
- Maw, N.; Barber, J.R.; Fawcett, J.N. The oblique impact of elastic spheres. Wear 1976, 38, 101–114. [Google Scholar] [CrossRef]
- Maw, N.; Barber, J.R.; Fawcett, J.N. The role of elastic tangential compliance in oblique impact. J. Lubr. Technol. 1981, 103, 74. [Google Scholar] [CrossRef]
- United States Golf Association. Interim Report on Study of Spin Generation; Tech. Rep.; United States Golf Association: Far Hills, NJ, USA, 2006. [Google Scholar]
- Leach, R.; Forrester, S.; Smith, A.; Roberts, J. How valid and accurate are measurements of golf impact parameters obtained using commercially available radar and stereoscopic optical launch monitors? Measurement 2017, 112, 125. [Google Scholar] [CrossRef]
Publisher’s Note: MDPI stays neutral with regard to jurisdictional claims in published maps and institutional affiliations. |
© 2020 by the authors. Licensee MDPI, Basel, Switzerland. This article is an open access article distributed under the terms and conditions of the Creative Commons Attribution (CC BY) license (https://creativecommons.org/licenses/by/4.0/).