Proceeding Paper

Measurement and Visualization of Airflow through Sports Textiles †

1
Brownlie Management Ltd., West Vancouver, BC V7W1R7, Canada
2
Nike Inc., Beaverton, OR 97005, USA
3
Department of Mechanical Engineering, University of British Columbia, Vancouver, BC V6T 1Z4, Canada
4
Jeff Allison Design, Lake Oswego, OR 97035, USA
5
Department of Mechanical and Materials Engineering, Queen’s University, Kingston, ON K7L 3N6, Canada
*
Author to whom correspondence should be addressed.
Presented at the 13th Conference of the International Sports Engineering Association, Online, 22–26 June 2020.
Proceedings 2020, 49(1), 21; https://doi.org/10.3390/proceedings2020049021
Published: 15 June 2020

Abstract

:
In marathon running, maintenance of body temperature is critical for peak performance. Race apparel should maximize ventilation yet current fabric permeability standards are based on airflow rates that are not generated during running. A novel flow measurement device was used to measure airflow through textiles and the effects of fabric hole size, coverage area and standoff distance between a simulated torso and fabric at velocities of 3.3, 5.3 and 10 m·s−1. Fluorescent dye injection in a tow tank or flume permitted visualization of flow through fabrics. Ventilation is constrained by the low flow velocity in the stagnation area over the chest of an athlete, with freestream airflows of 3.3 and 10 m·s−1 reduced to 1.31 +/− 0.10 m/s (39.6%) and 3.51 +/− 0.27 m·s−1 (35.0%), respectively at a yaw angle of 20°. The initial low flow velocity precludes improvements in airflow despite changes in the standoff distance, fabric hole size or coverage area.

1. Introduction

Maintenance of thermoregulation is of paramount importance in optimizing human performance in high level athletic competitions. The results of several studies that measured thermoregulatory responses to extended (25 to 120 min at 43 to 62% VO2max) cycling and running exercise have revealed that a 1 m/s increase in airflow over the body will extend average aerobic exercise time to exhaustion by up to 8%, reduce body heat storage by 16% and end-exercise heart rate by 2 bpm [1,2,3,4,5]. The requirement to maintain body temperature is often at odds with rules based requirements to wear uniforms and clothing for protection, team affiliation and modesty. Athletic apparel design should incorporate adequate ventilation to allow the body to cool through evaporation of sweat, convective and conductive processes. Unfortunately, there is little published information about the actual magnitude of air flow through modern athletic garments and how to improve this flow. Previous pressure tap measurements of differential air pressures around a mannequin torso in a wind tunnel indicated that the only areas of the torso that encounter measurable airflow at wind velocities up to 10 m/s are the flanks, a phenomenon also observed during dye-injection flow visualization studies conducted on a torso model in a water flume [6]. Covering portions of the torso that receive limited airflow with a fabric further subdued the incoming airflow and this reduction in airflow was not consistently correlated with the fabric manufacturer’s air permeability rating. The results of this study suggested that fabric air permeability ratings are of limited utility in the selection of permeable materials for running apparel because of the low air pressures encountered by the torso at running velocities.
To directly measure the effect of wind speed, fabric—torso separation (standoff) and fabric porosity (hole size and hole density) on air flow through a garment system, the authors developed a precision airflow measurement device for use in a wind tunnel. In addition, flow visualization studies were conducted in a tow tank and water flume with fluorescent dye and UV lighting to trace the flow of water through fabrics used for soccer jerseys, running singlets and jackets at equivalent running velocities. Results of these measurements will ultimately assist in the design and construction of athletic apparel that optimizes thermal comfort and performance.

2. Materials and Methods

2.1. Wind Tunnel

All air flow measurements were conducted at the University of British Columbia Department of Mechanical Engineering Boundary Layer Wind Tunnel. The Boundary Layer Wind Tunnel is an open circuit wind tunnel with test section dimensions of 244 cm wide × 152 cm high. All experiments were conducted at free stream wind speeds of 3.3, 5 or 10 m/s, as measured by an Omega Model HHF141 portable vane anemometer that was mounted parallel to the top of the airflow measurement device in the wind tunnel.

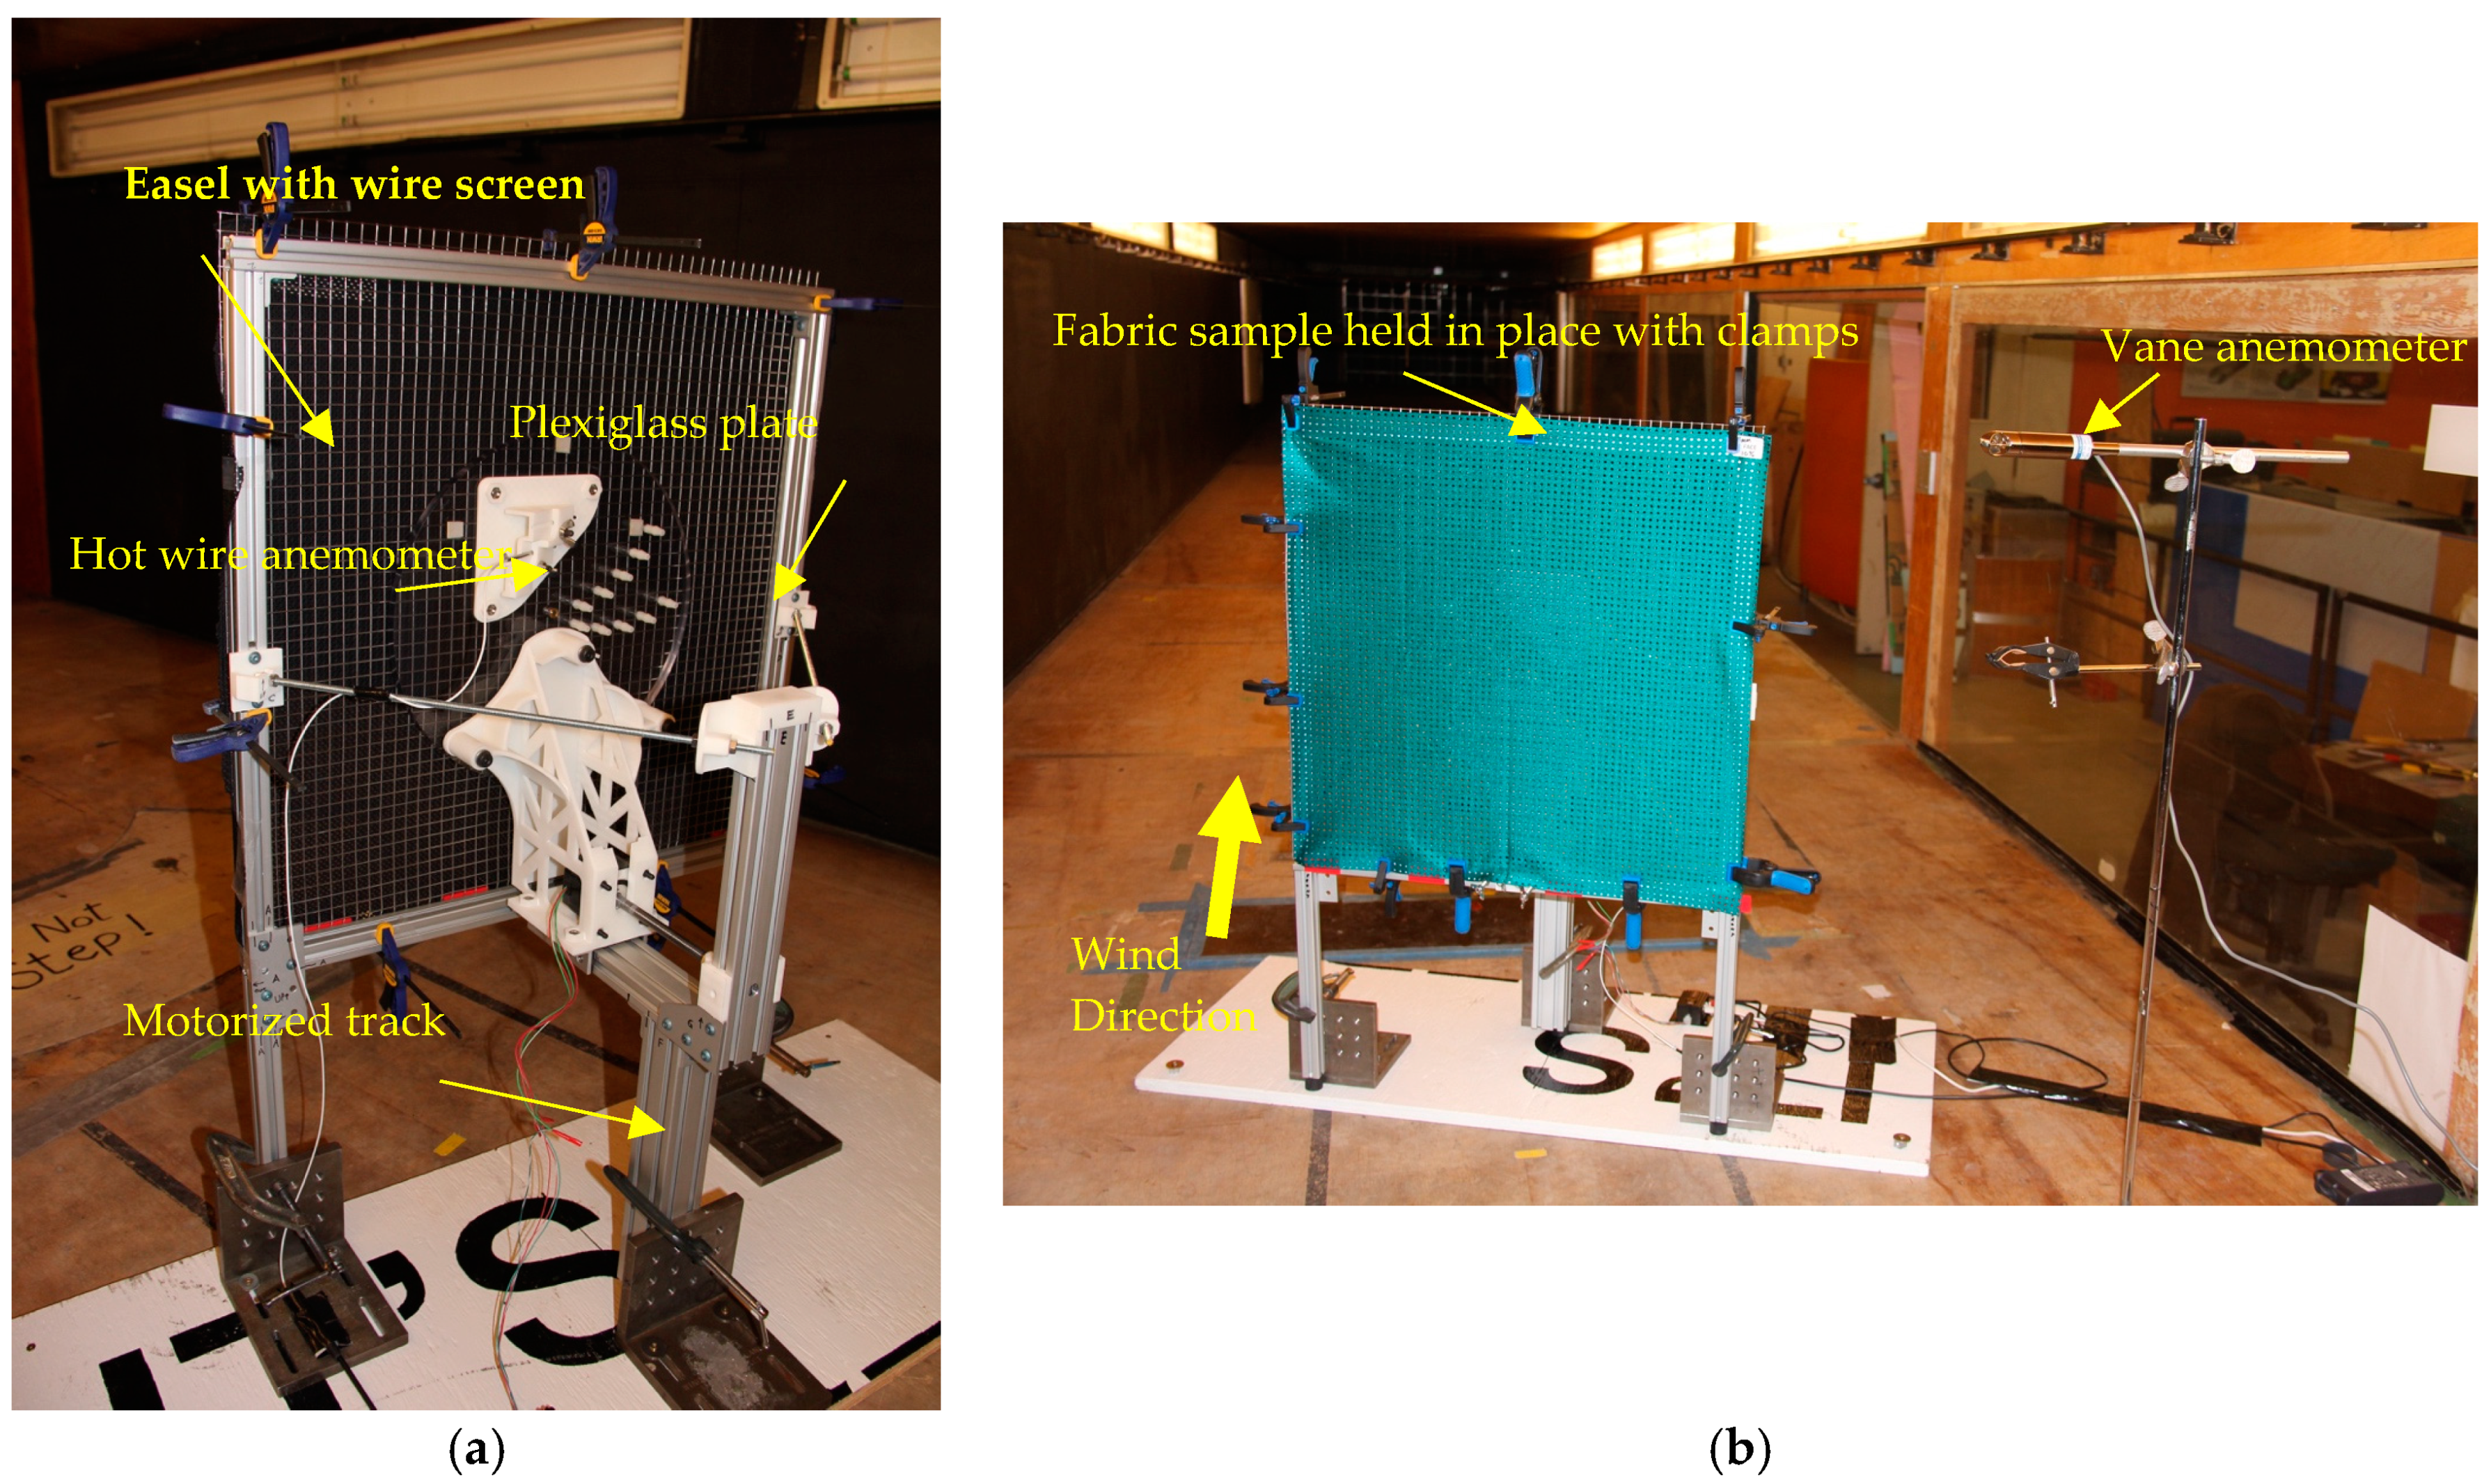
2.2. Airflow Measurement Device
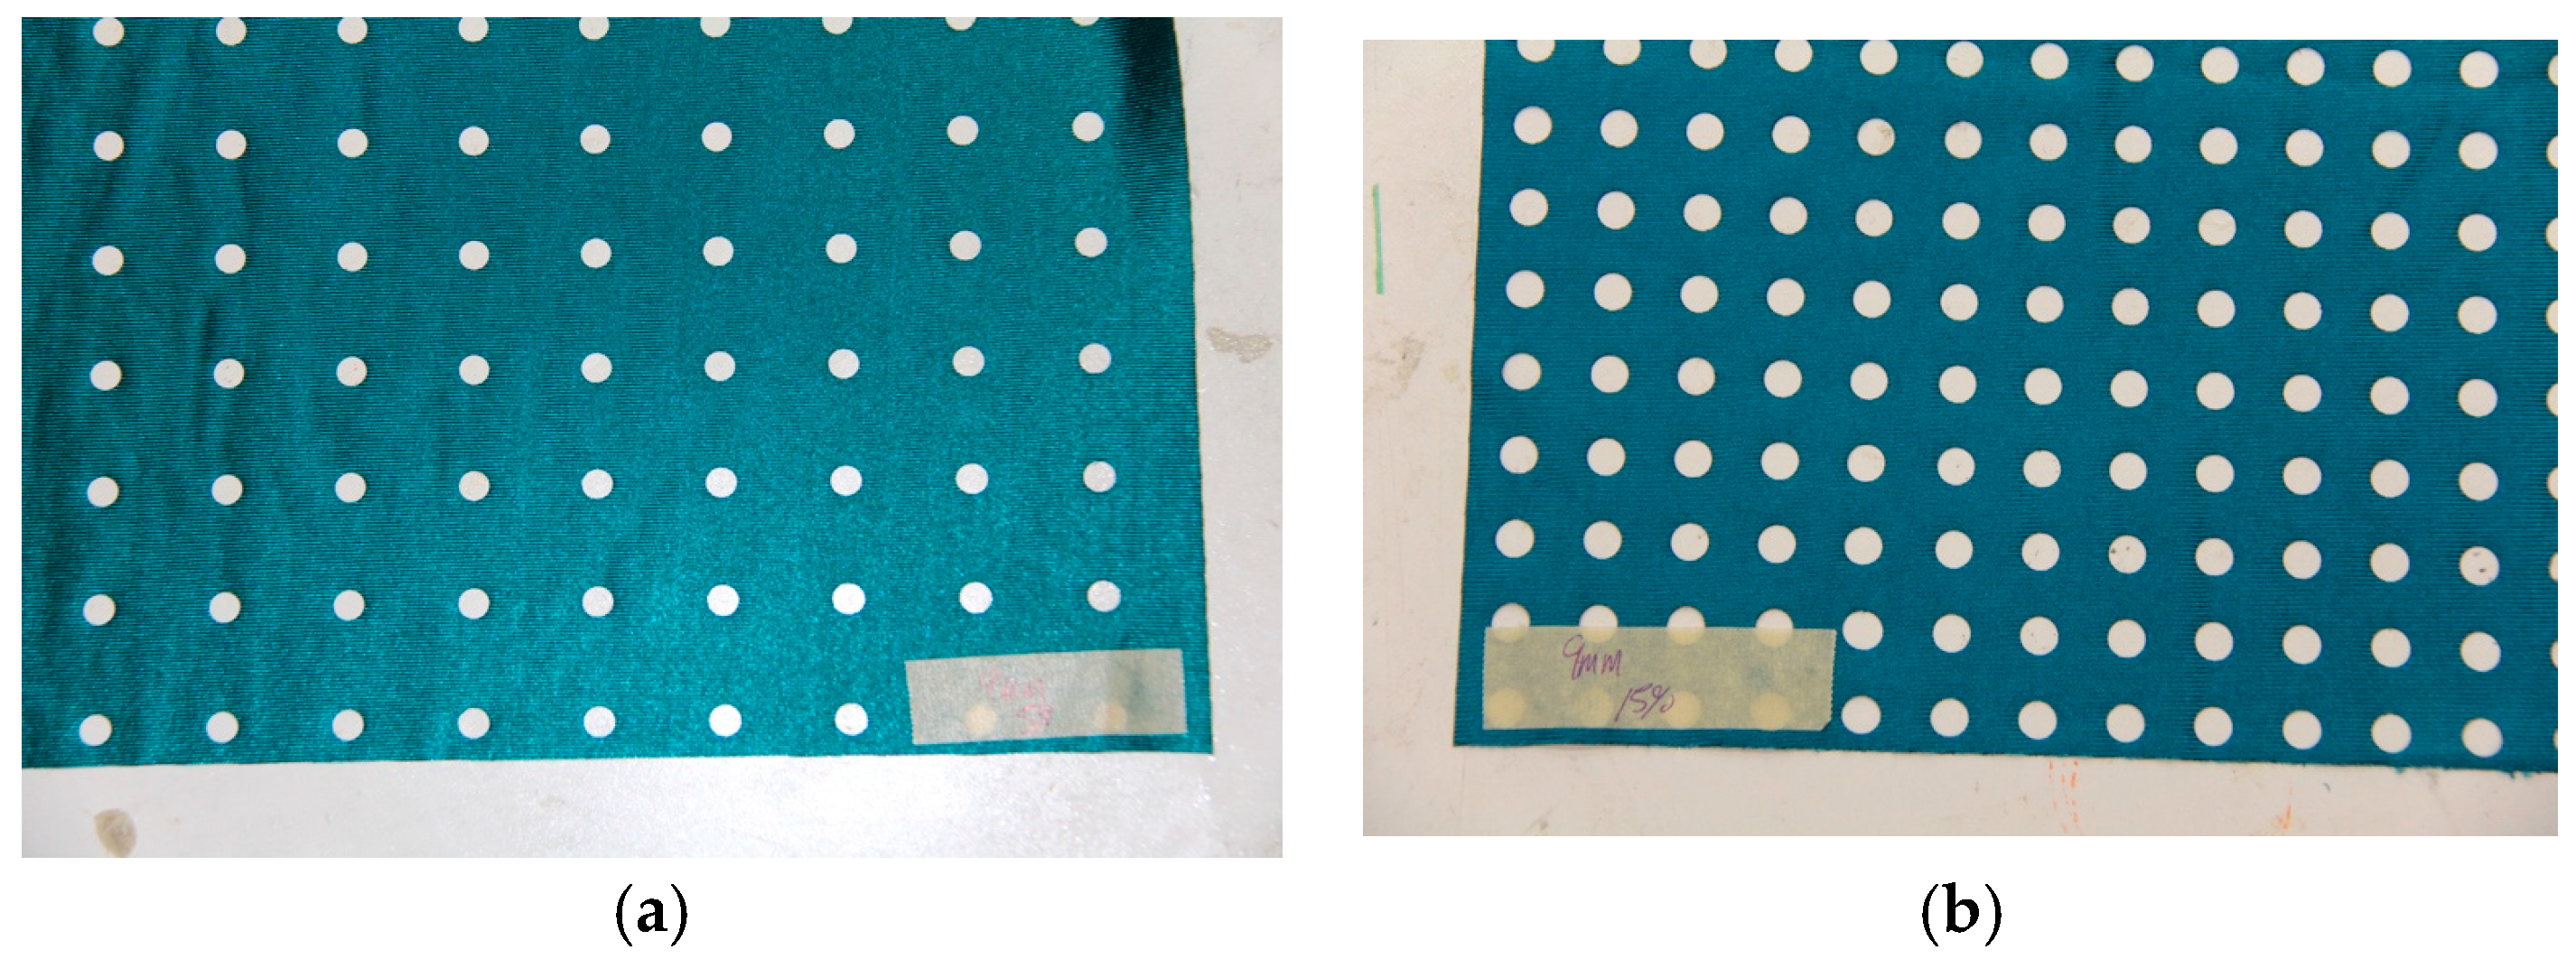
Airflow measurements through metal screens and fabric samples were measured with a Dantec Dynamics model 55P11 miniature hotwire anemometer. The 1.25 mm wide wire sensor of the probe was fixed in the back of a 25 cm diameter round plexiglass plate at an angle of 60° such that 1.4 mm of the sensor extended beyond the front of the plate. The plate was attached to a remotely controlled motorized track that permitted precise forward and backward movements of the plate from 3 to 13 mm behind a 61 × 61 cm vertically orientated frame perpendicular to the wind tunnel airflow. The frame contained a wire mesh screen with 1.2 mm diameter wires separated by perpendicular spacings of 1.27 cm, providing 92% openness. Wrinkle free fabric samples were held on the front of the easel with carpenter’s clamps. The miniature probe was located near the center of the tunnel airflow, at a distance of 71 cm above the tunnel floor and 127 cm from the side wall of the tunnel where boundary layer effects would be minimized (Figure 1). The hotwire anemometer was calibrated in freestream by comparison with wind speed values provided by the vane anemometer. The plexiglass plate and miniature probe arrangement was designed to represent a human torso, with the distance between the fabric sample and plate providing a simulation of the normal drape or spacing between a jersey and the skin.

2.3. Test Samples

Square (61 × 61 cm) swatches of a common polyester blend knit fabric used in athletic apparel were laser cut to provide samples with hole sizes of from 3 to 9 mm and degrees of openness from 5 to 15% (Figure 2).
In each test the tunnel wind speed was brought to a steady velocity of 3.3, 5.3 or 10 m/s and the readings from the hotwire anemometer were recorded for 2 s at a sampling frequency of 1 KHz, then averaged and stored in an Excel file on a laptop computer. The plate and anemometer were moved to a new standoff distance and the procedure was then repeated.

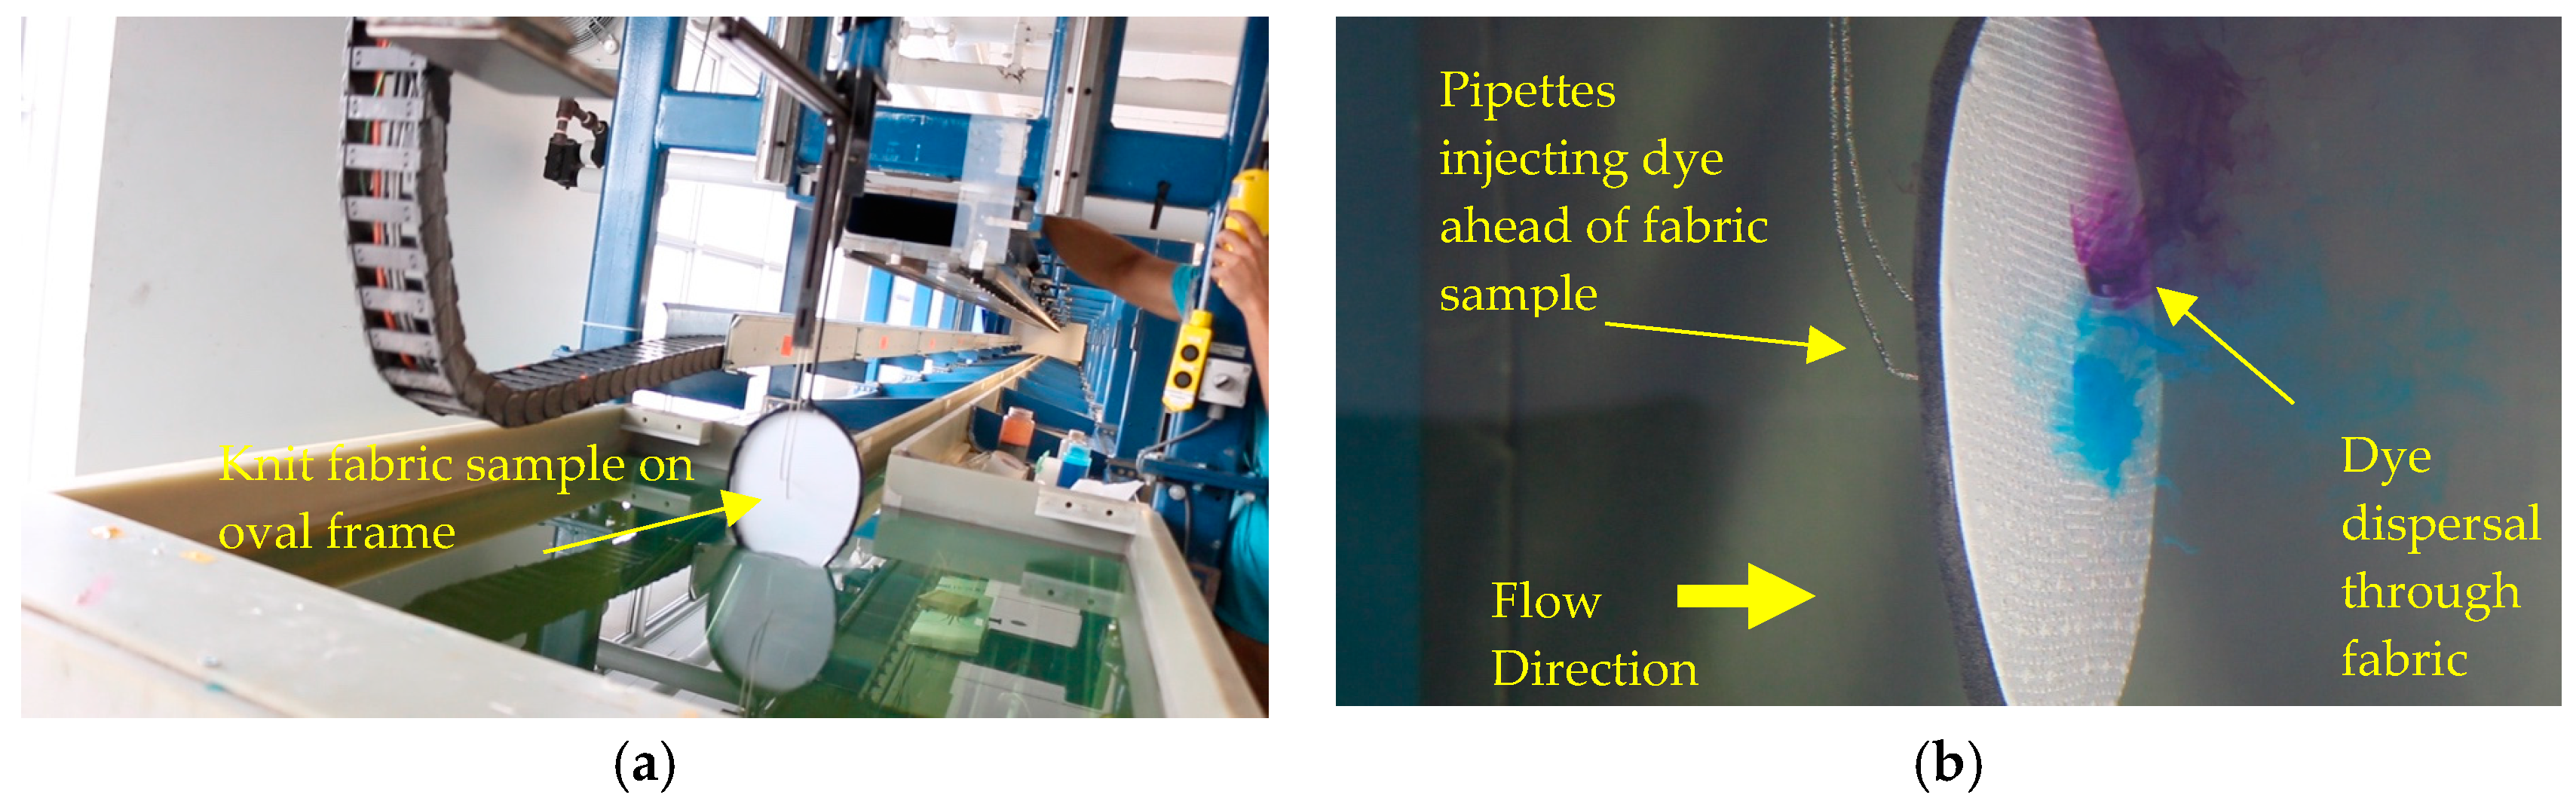
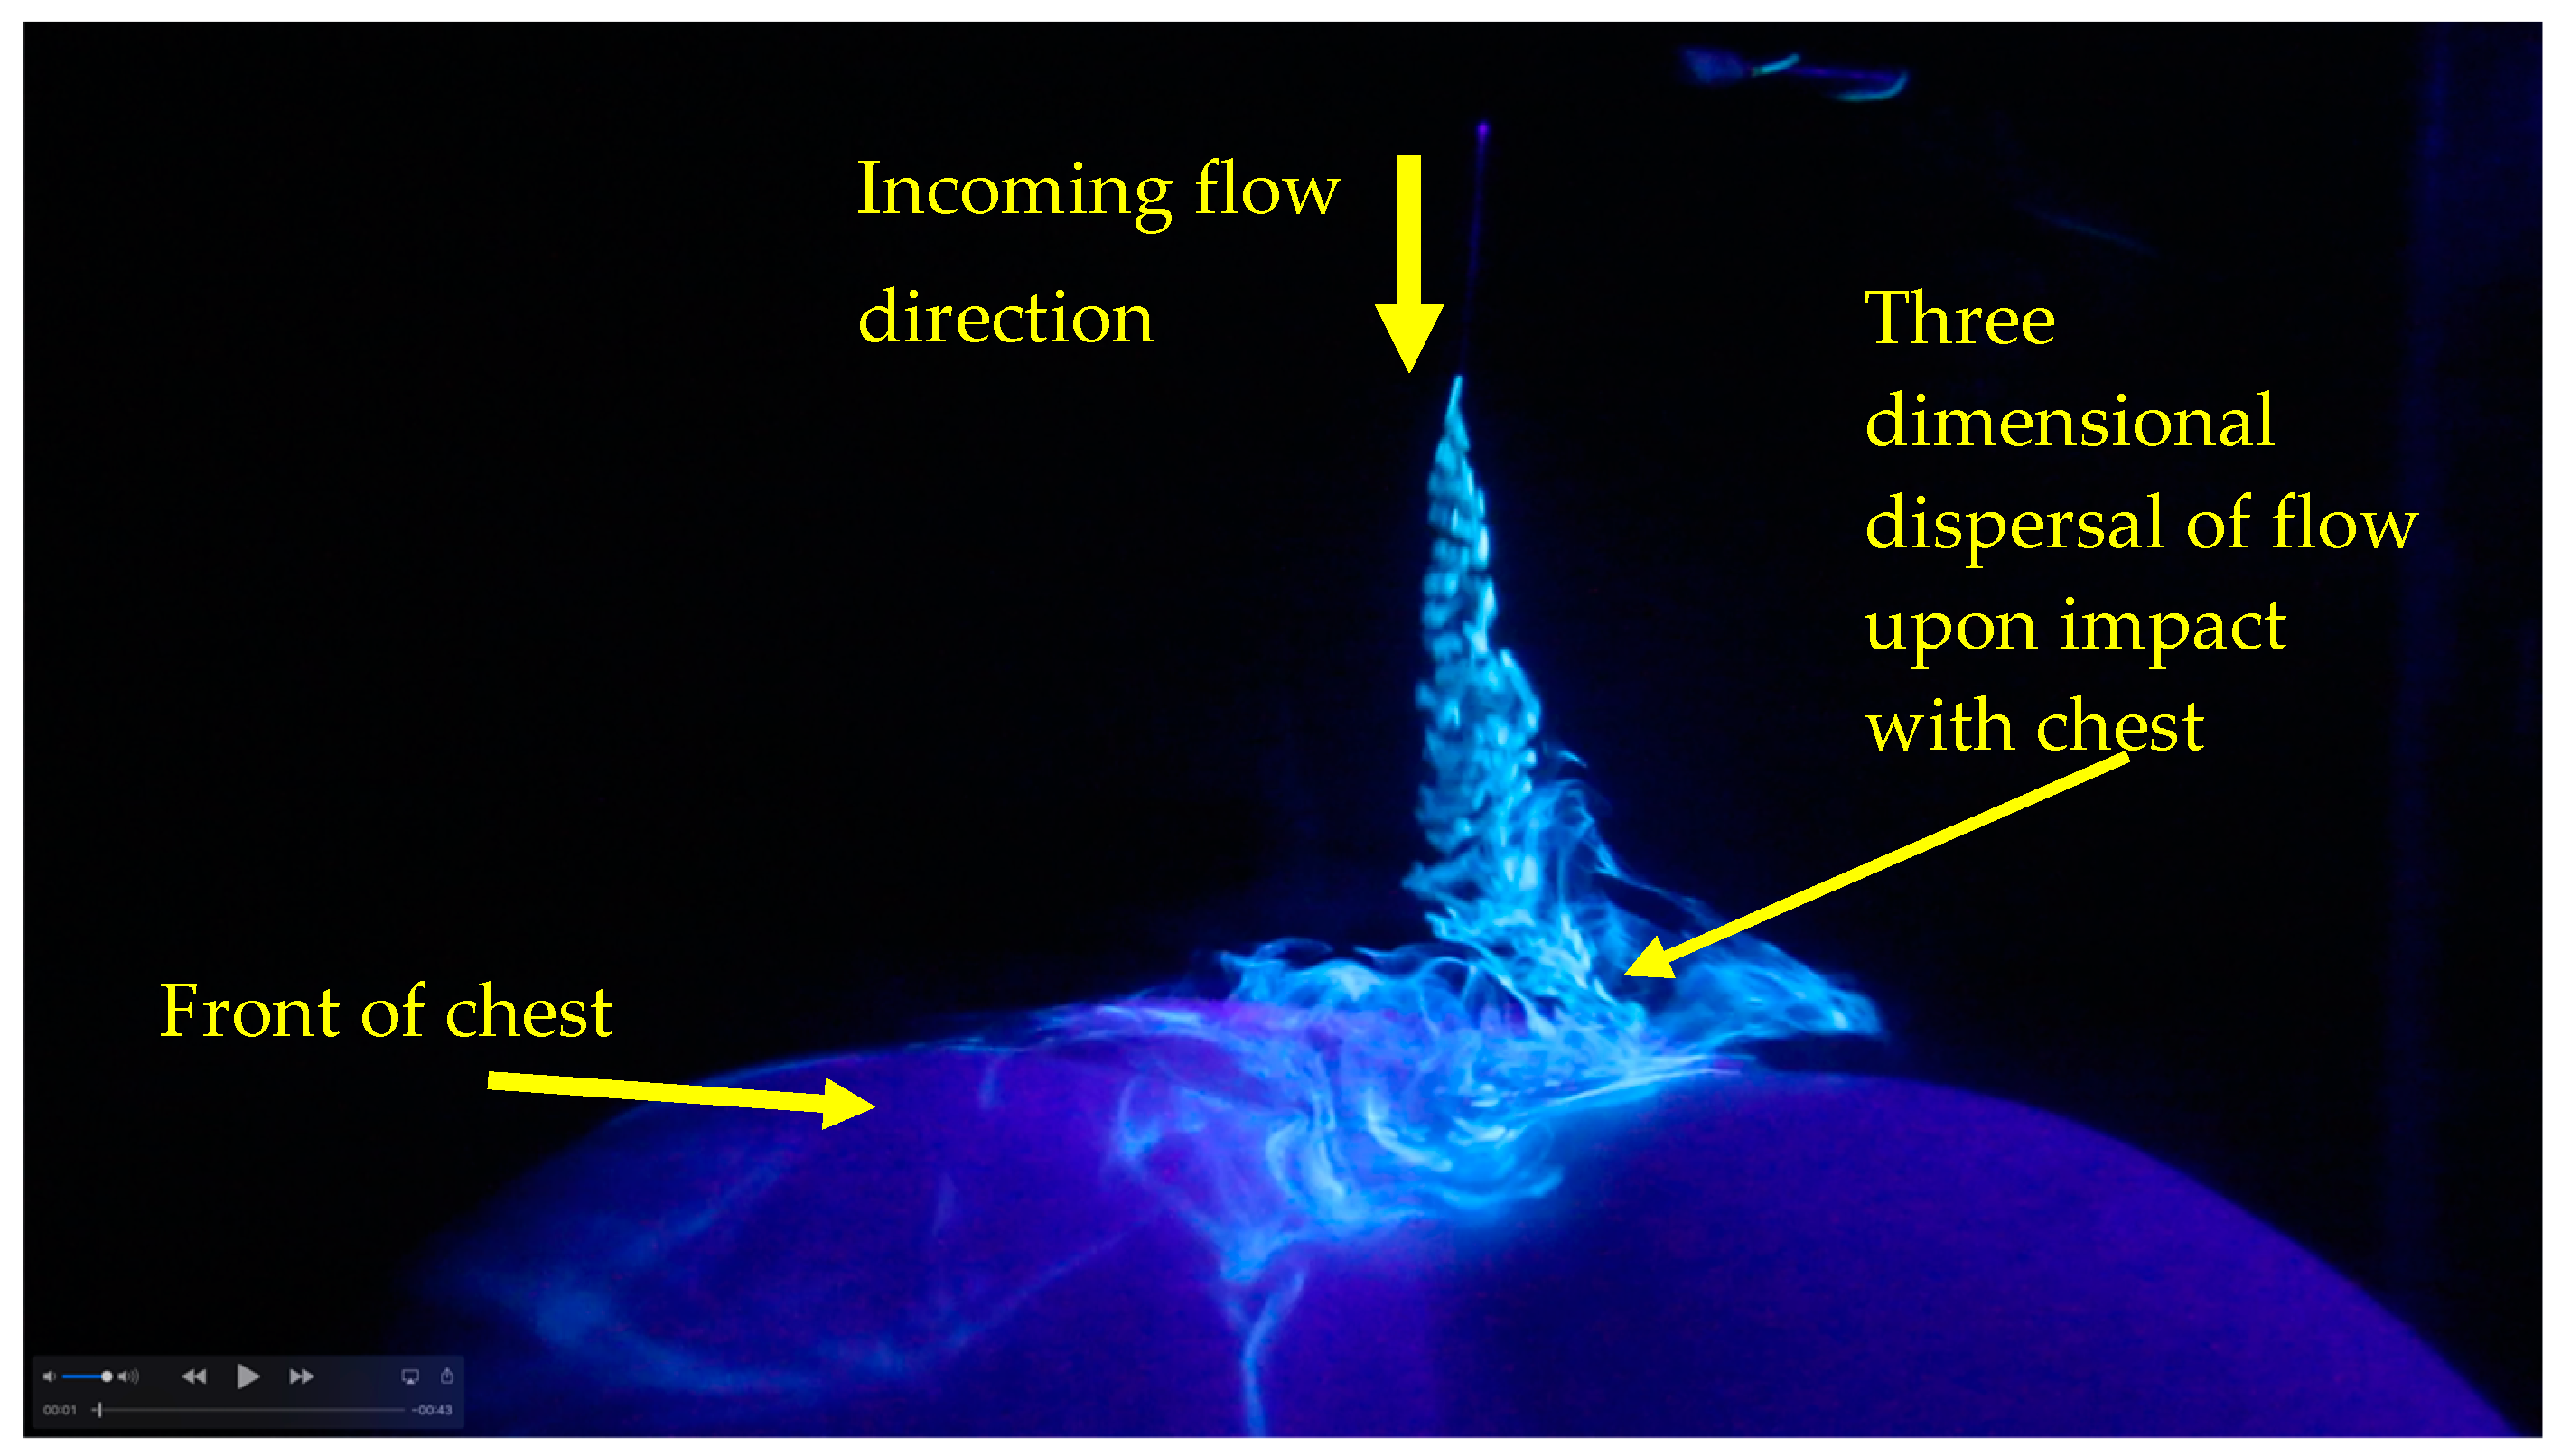
2.4. Flow Visualization

Flow visualization studies were performed at both the 1 m wide × 1 m high × 15 m long OTTER I (Optical Towing Tank for Energetics Research) tow tank in the Queen’s University Department of Mechanical and Materials Engineering (Figure 3a) and the University of Washington water flume. Flow visualization was performed using micro pumps to inject either permanganate or fluorescent dyes through pipettes placed 1 cm ahead of a submersed fabric sample held in an oval frame (Figure 3b) or a mannequin torso as it was towed through the OTTER I water tank or subjected to water flows at the University of Washington flume at water equivalent running velocities of 3.6 and 5.6 m/s. Results of the flow visualization studies were collected as a series of HD videos with a Canon 70D DSLR camera and 50 mm Nikkor lens. Visual analysis of the flow was accomplished by replaying the videos in slow motion.

3. Results and Discussion

3.1. Calibration of Hot Wire Anemometer and Repeatability of Flow Measurements

Comparison of the miniature probe hot wire anemometer freestream flow velocities with vane anemometer wind speed values revealed that the hot wire values were within +/− 0.5% of the vane anemometer values. Care was required to ensure that a hole in the fabric was not positioned directly over the probe where an unrealistic “jet” effect would confound the flow measurements. The open screen and the fabric with 9 mm holes and 15% openness were tested on two separate occasions approximately 1 month apart at a flow velocity of 10 m/s. A comparison of the results of these two tests revealed maximum differences in measured velocity of +/− 0.5 m/s over standoff distances of 3 to 13 mm. This level of repeatability was deemed acceptable for the purpose of identifying large scale differences between the effects of the independent variables of ambient wind speed, standoff, hole size and per cent openness on the measured flow speed at the surface of the simulated torso. In future work, multiple probes maybe added to the device so as to provide an average flow at several points under the test sample.

3.2. Effect of Ambient Wind Speed on Measured Flow Rate at Plate

In preliminary tests with the plexiglass plate perpendicular to the incoming wind, the measured flow at all ambient wind speeds was exceedingly low as the flow stagnated in front of the plate. Measurable flow was encountered when the testing device was yawed to 20° from the incoming wind and all fabric tests were conducted at this yaw angle, simulating the flanks of the torso. With incoming wind speeds of 3.3, 5.3 and 10 m/s and only the metal screen in place (standoff distance between the screen and plate collapsed), flow at the face of the plate averaged 1.31 +/− 0.10 m/s; 1.92 +/− 0.15 m/s and 3.51 +/− 0.27 m/s, respectively, representing only 39.6, 36.2 and 35.0% of the ambient wind speed. While the flow at the face of the plate increased with increasing ambient wind speeds, there was a substantial reduction in flow near the surface prior to adding any fabric cover.

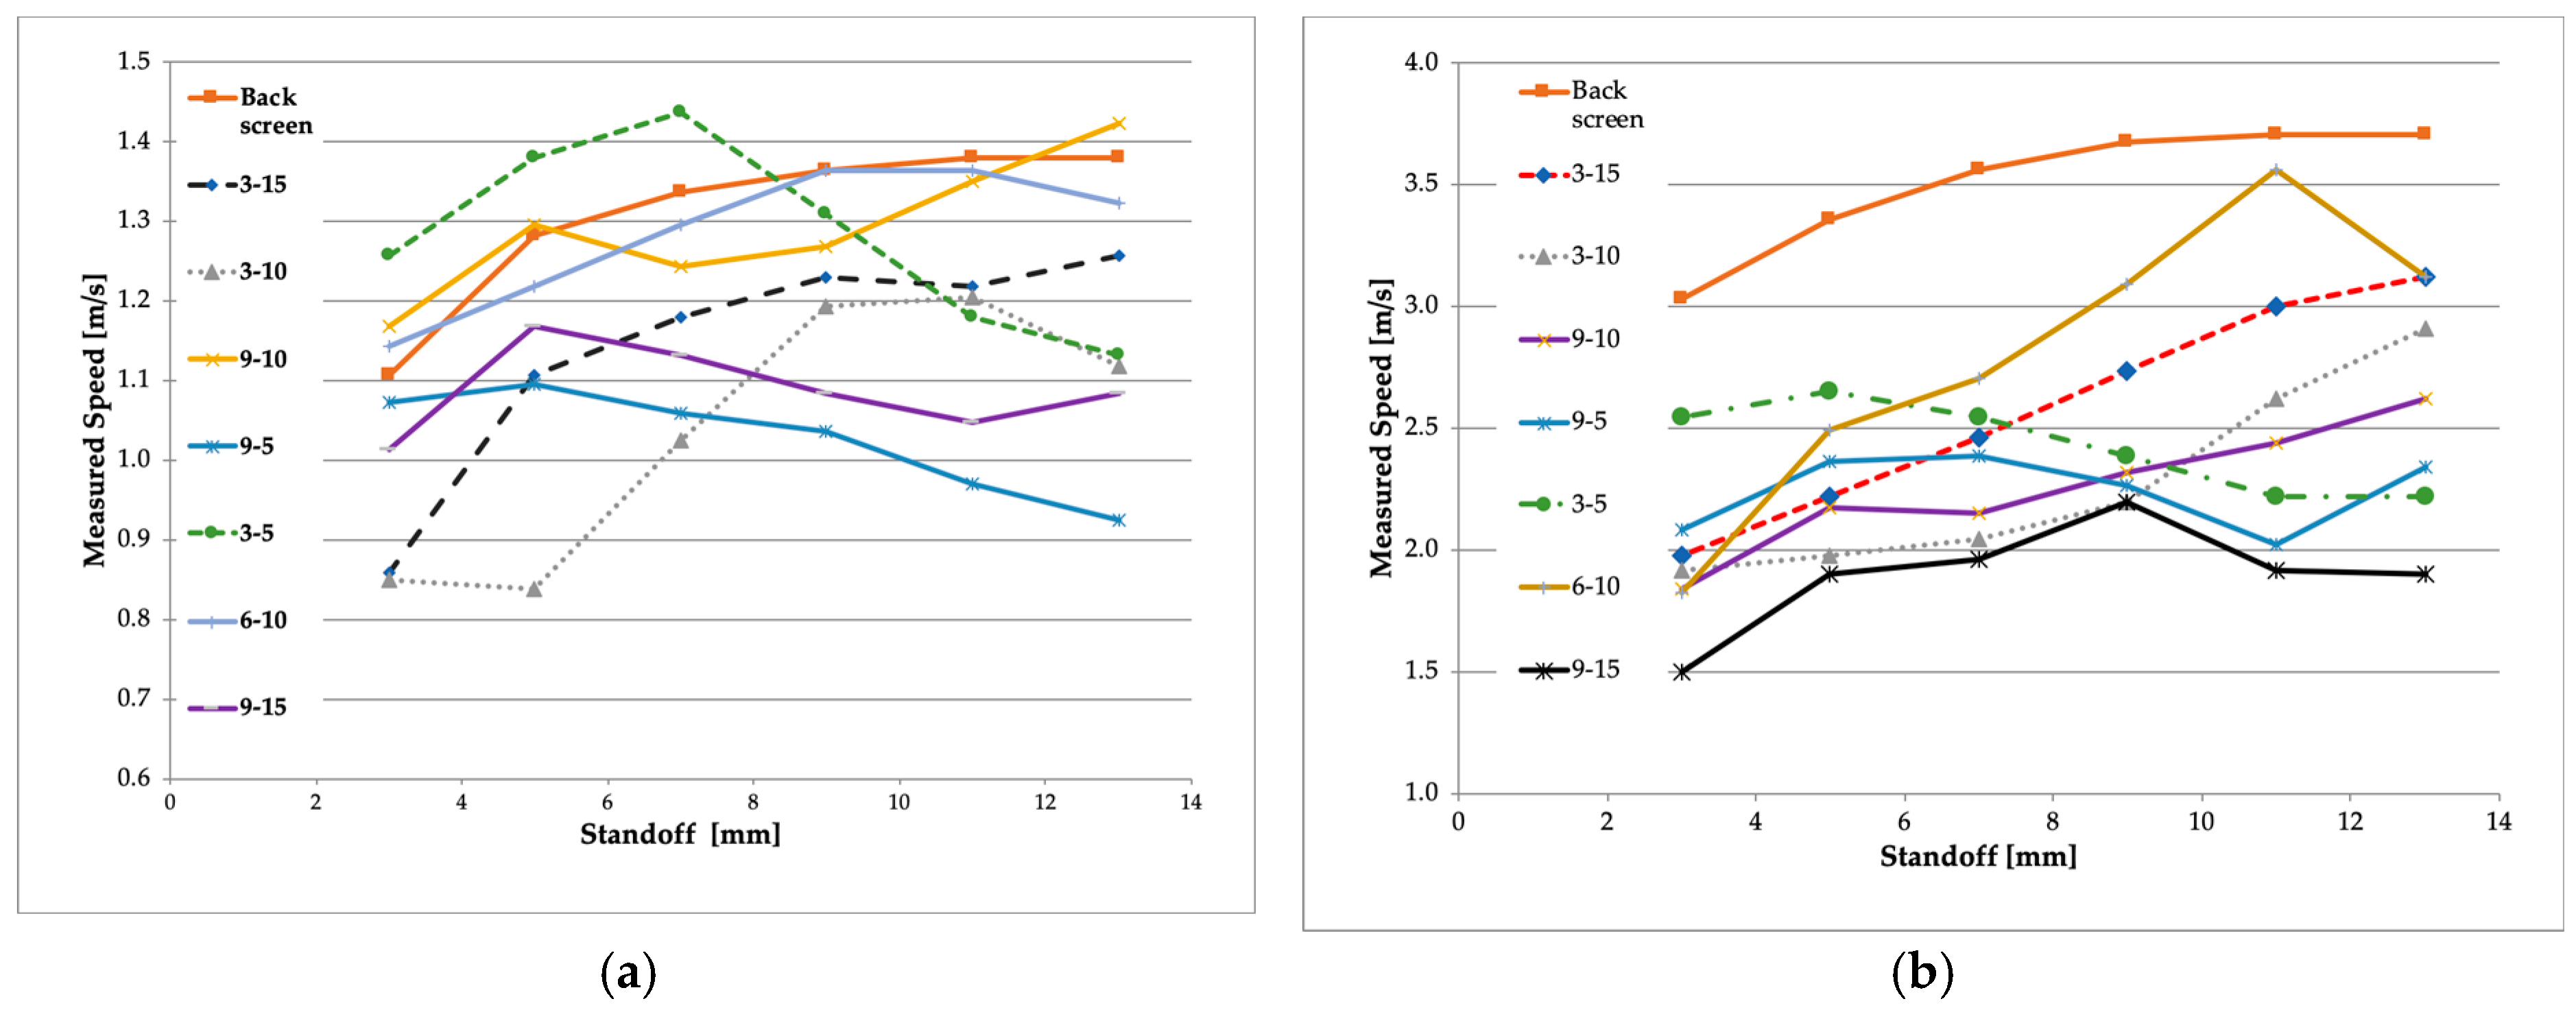
3.3. Effects of Standoff, Hole Diameter and % Openness

The effect of standoff, % openness and fabric hole diameter on flow speed in front of the plate at freestream velocities of 3.3 and 10 m/s are shown in Figure 4a,b. A “flow ratio” parameter was developed which compared the flow velocity with the fabric sample in place compared to the flow velocity without a fabric in place at standoff distances of 3, 5 or 7 mm. Table 1 shows the flow ratio summaries averaged across these realistic standoff distances. Table 1 and Figure 4a,b do not display any clear relationship between flow rate and hole size or % openness. Focusing on the 3 to 7 mm standoff distances, Figure 4a,b do display a trend towards an increased flow of about 0.5 m/s with increasing standoff distance for most of the fabrics tested. Surprisingly, the flow ratio decreases with increasing wind speed, even though flow speed at the probe increases (Table 1). This result indicates that there are diminishing returns in terms of flow at the body surface with increasing running speed.

3.4. Interpretation of Flow Visualization

Flow visualization confirmed that the incoming water hits the centre chest at a stagnation point and then suffers a large reduction in velocity, with the flow improving around the flanks (Figure 5). Rotating the mannequin torso to a yaw angle improved the velocity over the flanks and reduced the size of the stagnation area.
Flow visualization of stretched fabric samples (Figure 3b) demonstrated that open weaves do improve flow through the fabric however this improvement was very limited once the fabric was draped on the torso, due to the low driving pressure at the front stagnation point.

4. Conclusions

A novel air flow measurement device was used to measure airflow through textiles and the effects of fabric hole size, coverage area and standoff distance between a simulated torso and fabric at velocities of 3.3, 5.3 and 10 m/s. With increased wind speed, the flow rate at the torso increased but was limited to approximately 37% of the freestream flow. Increasing the standoff distance from 3 to 7 mm increased flow rates by about 0.5 m/s. There was no direct relationship between flow rate, hole size and % openness. These results suggest that improving passive ventilation through athletic apparel will be constrained by the stagnation of airflow over the front of the body at running velocities.

Funding

This research was supported by NIKE Inc. No funds were received to cover any costs associated with publication of the results.

Conflicts of Interest

The authors are paid employees or consultants to NIKE Inc. and were involved in the design of the study; in the collection, analyses and interpretation of data, in the writing of the manuscript, and in the decision to publish the results.

References

  1. Adams, W.C. Influence of exercise mode and selected ambient conditions on skin temperature. Ann. N. Y. Acad. Sci. 1977, 301, 110–127. [Google Scholar] [CrossRef] [PubMed]
  2. Adams, W.C.; Mack, G.W.; Langhans, G.W.; Nadal, E.R. Effects of varied air velocity on sweating and evaporative rates during exercise. J. Appl. Phys. 1992, 73, 2668–2674. [Google Scholar] [CrossRef] [PubMed]
  3. Shaffrath, J.D.; Adams, W.C. Effects of airflow and workload on cardiovascular drift and skin blood flow. J. Appl. Phys. 1984, 56, 1411–1417. [Google Scholar] [CrossRef]
  4. Saunders, A.G.; Dugas, J.P.; Tucker, R.; Lambert, M.I.; Noakes, T.D. The effects of different air velocities on heart storage and body temperature in humans cycling in a hot, humid environment. Acta Physiol. Scand. 2005, 183, 241–255. [Google Scholar] [CrossRef] [PubMed]
  5. Teunissen, L.P.J.; de Haan, A.; de Koning, J.J.; Daanen, H.A.M. Effects of wind application on thermal perception and self-paced performance. Eur. J. Appl. Physiol. 2013, 113, 1705–1717. [Google Scholar] [CrossRef] [PubMed]
  6. Brownlie, L.W.; Ostafichuk, P.; Carbo, J.; Demarest, N. Air permeability of sports fabrics at running speeds. Proc. Eng. 2014, 72, 697–702. [Google Scholar] [CrossRef]
Figure 1. (a) Rear view of airflow measurement device; (b) Front (wind facing) view of the airflow measurement device.
Proceedings 49 00021 g001
Figure 2. (a) Knit fabric sample with 9 mm holes and 5% openness; (b) Knit fabric sample with 9 mm holes and 15% openness (Note: magnification ratio differs between images).
Proceedings 49 00021 g002
Figure 3. (a) Knit fabric sample held in oval frame being submersed in OTTER 1 tow tank; (b) Knit fabric sample with dye injection showing dye dispersion through porous openings in fabric.
Proceedings 49 00021 g003
Figure 4. (a) Measured flow speed (m/s) as a function of standoff (mm) for all fabric samples tested at a velocity of 3.3 m/s; (b) Measured flow speed (m/s) as a function of standoff (mm) for all fabric samples tested at a velocity of 10 m/s.
Proceedings 49 00021 g004
Figure 5. Screen shot of video of fluorescent dye flow visualization over the chest of a mannequin. Note the three dimensional dispersion of the flow as its velocity is reduced upon impact with the chest.
Proceedings 49 00021 g005
Table 1. Flow ratio summaries averaged across realistic standoff distances of 3, 5 or 7 mm.
Wind SpeedHole SizePermeability (% Openesss)
(m/s)(mm)51015Avg
3.331.090.730.840.89
6 0.98 0.98
90.871.00 0.94
Avg0.980.900.840.92
1030.780.600.670.68
6 0.70 0.70
90.690.62 0.65
Avg0.730.640.67

