Abstract
Auxetic materials have a negative Poisson’s ratio, meaning they contract laterally during axial compression. Auxetics can also absorb more energy during impacts than conventional materials. Auxetic foam was fabricated by volumetrically compressing open cell foam to buckle cell ribs and impart a re-entrant cell structure, then the imposed structure was fixed by heating and cooling. Passing pins through the foam allowed localised control over compression during fabrication, producing gradient foam with regions with differing Poisson’s ratios and stress vs. strain relationships. Uniform sheets had volumetric compression ratios of three, gradient sheets had volumetric compression ratios of one (unchanged) or three in different regions. One participant jumped barefoot on all foams, cut out to fit pressure sensors; another ran wearing shoes containing uniform converted and unconverted foam insoles. Pressure distribution was measured underneath the foams and foam insoles. Peak pressure was lowest underneath converted foams, warranting further investigation with more participants.
1. Introduction
Running is one of the most popular forms of exercise [1]. Running shoes are designed to protect feet and lower limbs from injuries caused by repeated impacts and abrasion [1]. Running shoe design, particularly the type and thickness of foam in the midsole, can change impact forces and running style [1]. Most shod runners favour a heel strike [2], which increases loading to the knee and hip [2]. Running shoes typically use energy absorbing closed cell foam [1,2], or moulded or additively manufactured structures [3] in their midsole.
Poisson’s ratio is the ratio of lateral expansion to axial compression during deformation, and auxetic materials have a negative Poisson’s ratio (NPR) [3], meaning they contract laterally during axial compression. Open cell auxetic foam is typically made by compressing open cell foam with a uniform volumetric compression ratio (VCR, original/final volume) of two to five into a mould to buckle cell ribs, then heating and cooling to fix the imparted structure [3]. The imparted buckled, contorted cell ribs provide an NPR. A recent review described auxetic materials and their potential application to sports equipment [3].
Auxetic open cell foams exhibited ~3 to ~8 times lower peak force under impact [3] than their conventional counterparts. The reduction in peak force is likely caused by a combination of NPR and the removal of the plateau in the stress vs. strain response of conventional open cell foam, increasing energy absorption before foam densification or ‘bottoming out’ above ~80% compression [3]. Until recently [4], closed cell foam fabrications were not accessible.
Open cell gradient foams with regions of different cell structures, Poisson’s ratios and stress vs. strain relationships can be fabricated by applying variable compression during fabrication [5]. Using pins to constrain sections of sheets of foam during fabrication varies imposed VCRs, and therefore cell structures and mechanical properties [5]. Sections of foam with a VCR of three exhibited about a third of the peak force of those with a VCR of ~1 under impacts adapted from sporting standards [5].
Auxetic foam has been applied to shoes [6], and auxetic structures have been applied to the soles and uppers of running shoes, mainly to improve comfort [3]. This work begins to assess whether open cell auxetic and gradient foams could reduce peak pressure during running when located underfoot.
2. Materials and Methods
Two sheets of open cell polyurethane foam (PUR30FR, Custom Foams) were processed. One sheet (500 × 500 × 28.5 mm) was converted with uniform compression to 30% in all three axes (350 × 350 × 20 mm) in a metal mould, giving a VCR of 2.9. Another 28.5 mm thick sheet of the same foam was cut to have a width of 500 mm at one end and 360 mm at the other (Figure 1a). Pins were inserted through a 5 mm thick, laser cut (Trotec, Speedy 500) acrylic sheet at 42.5 mm spacing at the narrower (360 mm wide) end, and used to apply 20% tension in each direction at the 500 mm wide end [5]. Following 30% through-thickness compression to the entire sheet of foam by the lid of the mould (Figure 1b), opposing halves of the fabricated gradient sheet had a VCR of 1.0 or 2.9. Foam and mould were then placed in an oven (MCP Tooling Technologies LC/CD) at 180 °C for 40 minutes, before being removed and cooled to room temperature (~1 h). A third sheet of the unconverted foam with the same thickness as the converted sheets (20 mm) was also used throughout the study.
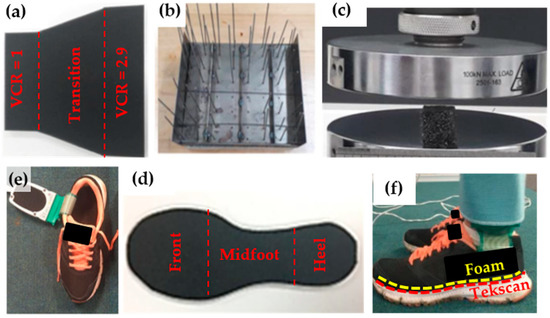
Figure 1.
(a) Sheet of foam used for gradient fabrication; (b) mould used for fabrication; (c) quasi-static compression test; (d) cut out insole; (e) pressure sensors inserted into the running shoe, covered by a foam sample; (f) participant wearing instrumented shoes, foam insole and Tekscan, labelled in yellow and red, respectively.
Six 20 mm sided cubes were cut for compression testing (Figure 1c) from the uniform and unconverted sheets and both VCR regions (1.0 and 2.9) of the gradient sheet. Through-thickness compression testing to 10% strain at 0.003 s−1 was carried out (Instron 3369, 500 N load cell), with stress and engineering strain calculated from force and displacement data and sample dimensions. Young’s modulus was taken as the gradient of linear trend lines fitted to the stress vs. strain data. Two-dimensional digital image correlation (DIC, LaVision, 35 mm optical zoom, DaVis software) was used to measure lateral and axial engineering strain. Poisson’s ratio was obtained from the negative of the gradient of linear trend lines fitted to lateral vs. axial strain. Trend lines were fitted to the linear portion of plots between 0 and 2% compression, prior to the well reported plateau [3,5], for unconverted foam and foam with a VCR of 1.0, and up to 10% strain for other foams.
A pair of insole shapes were cut from each sheet of uniform (converted and unconverted) foam (Figure 1d). Two pairs were cut from the gradient sheet, with sections of foam with a VCR of 1.0 and 2.9 at the forefoot and heel. Pressure distribution was measured underneath the foam insole shapes, placed over sensors (Tekscan F-Scan pressure sensors [6], UK size 10, 3.9 sensors per cm2, max pressure 862 kPa) on a rigid floor (Figure 1d) while participant A (male, 21 years old, 68 kg, shoe size UK 7) jumped barefoot on them three times from ~100–150 mm. The uniform converted and unconverted foam insoles were then inserted into a running shoe following minor trimming, covering the pressure sensors. Pressure distribution was recorded while participant B (female, 21 years old, 53 kg, shoe size UK 5) ran for three strides across a rigid floor, with a data logger (VersaTek Cuffs) connected to the same pressure sensors. Maximum peak pressure, normalised peak pressure (peak/mean pressure) and contour plots showing the pressure distribution of the second jump or foot strike for each foot were compared. Participants had five minutes to familiarise themselves with the exercise and shoes before testing. Ethical approval was granted by Sheffield Hallam University’s ethics committee.
3. Results
3.1. Characterisation
Contour plots of the lateral strain at maximum compression, from DIC, show unconverted foam expanded (Figure 2a) while the width of the uniformly converted foam barely changed during compression testing (Figure 2b), suggesting respective positive and near zero Poisson’s ratios. The gradient foam with a VCR of 1.0 expanded laterally during compression (Figure 2c), while the section with a VCR of 2.9 contracted laterally (Figure 2d), suggesting a positive Poisson’s ratio and an NPR, respectively. Lateral vs. axial strain plots from DIC show unconverted foam expanding laterally, uniformly converted foam exhibiting low lateral expansion, and sections of gradient foam with VCR of 1.0 and 2.9 expanding and contracting laterally, respectively (Figure 2e).
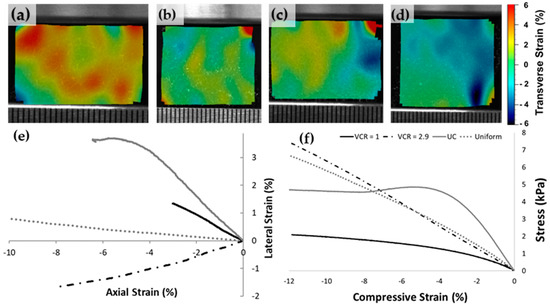
Figure 2.
Contour plots from DIC of the lateral strain at maximum compression for: (a) unconverted foam; (b) isotropic, uniformly converted foam; (c) gradient foam with a VCR of 1; (d) gradient foam with a VCR of 2.9. Sample (e) lateral vs. axial strain and (f) stress vs. axial strain plots, same legend (d) for (a) to (d) and (f) for (e,f); UC = unconverted foam.
The unconverted foam’s lateral strain (Figure 2e) and stress (Figure 2f) plateaued beyond approximately 2% compression. The small amount of applied through-thickness compression (30%) in the gradient foam removed (Figure 2e) or reduced (Figure 2f) the respective lateral vs. axial strain and stress vs. strain plateaus for the region of foam with a VCR of 1.0. Increasing the VCR from 1.0 to 2.9 increased Young’s modulus (gradient of stress vs. strain plots). Poisson’s ratios were approximately 0.5 or 0.1 for the unconverted and uniform sheet, and 0.2 or −0.1 for regions of the gradient sheet with an applied VCR of 1.0 or 2.9, respectively (Figure 3a). Young’s modulus was 170 kPa for the unconverted foam and approximately 50 kPa for the three other foams (Figure 3b).
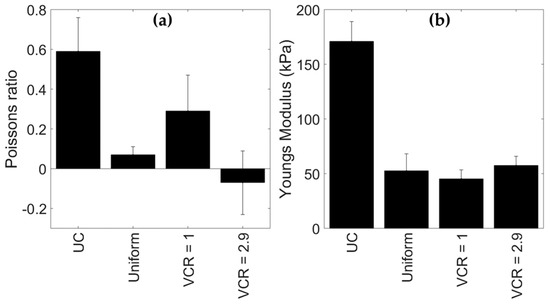
Figure 3.
Mean (a) Poisson’s ratios and (b) Young’s moduli. Unconverted (UC) and VCR = 1 samples were measured pre-plateau (between 0 and 2% compression), uniformly compressed and VCR = 2.9 regions were measured up to 10% compression. Error bars show 1 s. d.
3.2. Pressure Distributions
During jumping, all converted foams exhibited lower peak pressure than the unconverted foam (Figure 4a). When normalised to the mean pressure during each foot-strike, the difference was reduced but still present, suggesting the reason for the converted foam’s lower peak pressure could have been both increased impact force attenuation and enhanced pressure distribution (Figure 4b). The participant landed on the more compressed (VCR = 2.9) regions of the gradient foam insole shapes (Figure 4c,d), meaning that normalised peak pressures were similar underneath gradient and uniformly compressed insole shapes, which also had a VCR of 2.9 (Figure 4b).
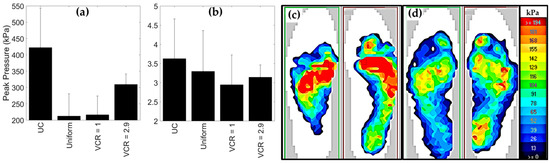
Figure 4.
(a) Mean maximum peak pressure while participant A jumped on each sheet; labels VCR = 1 and 2.9 indicate which section of the gradient foam is underneath the heel. (b) Normalised peak pressure underneath each sheet (maximum peak pressure/maximum mean pressure). Error bars show 1 s.d. (c,d) Maximum pressure distribution at maximum total pressure while participant A jumped on the gradient foam, VCR = 2.9 section under (c) forefoot and (d) heel. Same legend for (c) and (d).
As expected during running, both unconverted and uniformly converted foam insoles exhibited two broad peaks (Figure 5a,b), the first being the heel strike and the second the forefoot [2]. The unconverted foam exhibited a more pronounced second peak and higher peak pressure (Figure 5a), focussed under the forefoot (Figure 5c). The uniformly converted foam exhibited a broader and lower second peak, again highest under the forefoot (Figure 5d).
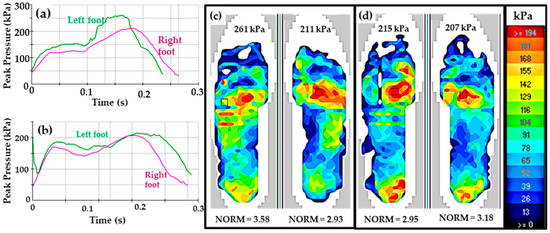
Figure 5.
Participant B’s peak pressure over time underneath the (a) conventional and (b) uniformly converted insoles inside running shoes, with the same y axis scale for both, and pressure distribution at maximum total pressure underneath (c) conventional and (d) uniformly converted foam insoles inside a running shoe, same legend for both.
4. Discussion
The converted foam did not exhibit high magnitudes of NPR (Figure 3), meaning that differences in pressure distribution were unlikely to have been due to an NPR. The fabrication process removed the characteristic stress vs. strain plateau of open cell foam (Figure 2). The energy absorption before foam densification, increased stiffness and impact force would therefore have been higher in the uniformly converted foam and the gradient region with a VCR of 2.9 [5]. The strains and strain rates during quasi-static characterisation (Figure 3) were lower than those expected during running. Previous studies have shown reduced peak force for similar auxetic and gradient foams during impact tests based on sporting standards [3,5], and little difference in shear response during dynamic bending tests [7], but further work should look to fully replicate the loading conditions expected in running when characterising the foam. The decreased peak pressure underneath converted insole shapes in these preliminary tests was clear (Figure 4 and Figure 5), warranting further investigation with more participants.
Given the exploratory nature of the study, only two participants were involved and repeat testing was not carried out. In further work, the pressure sensors may be better placed on top of the insoles, where they can measure pressure underneath the foot. Open cell foam is not typically used in running shoes, in which stiffer closed cell foam is favoured [1], but following recent advances in their fabrication [4], auxetic closed cell foams could also be tested in shoes.
5. Conclusions
Pressure differences underneath uniformly converted, volumetrically compressed foam—previously shown to absorb more energy under impact—were lower than underneath unconverted foam during both running and jumping. Further work should continue the exploratory work presented here with more participants, including testing with auxetic closed cell foam.
Funding
This research received no external funding.
References
- Relph, N.; Greaves, H.; Armstrong, R.; Gichuru, P.; Prior, T.D.; Griffiths, I.B.; Spencer, S.; Dey, P.; Langley, B. Running shoes for preventing lower limb running injuries in adults. Cochrane Database Syst. Rev. 2019, 7. [Google Scholar] [CrossRef]
- Lieberman, D.E.; Venkadesan, M.; Werbel, W.A.; Daoud, A.I.; Dandrea, S.; Davis, I.S.; Mang’Eni, R.O.; Pitsiladis, Y. Foot strike patterns and collision forces in habitually barefoot versus shod runners. Nature 2010, 463, 531–535. [Google Scholar] [CrossRef] [PubMed]
- Duncan, O.; Shepherd, T.; Moroney, C.; Foster, L.; Venkatraman, P.D.; Winwood, K.; Allen, T.; Alderson, A. Review of auxetic materials for sports applications: Expanding options in comfort and protection. Appl. Sci. 2018, 8, 941. [Google Scholar] [CrossRef]
- Fan, D.; Li, M.; Qiu, J.; Xing, H.; Jiang, Z.; Tang, T. A Novel Method for Preparing Auxetic Foam from Closed-cell Polymer Foam Based on Steam Penetration and Condensation (SPC) Process. ACS Appl. Mater. Interfaces 2018, 10, 22669–22677. [Google Scholar] [CrossRef] [PubMed]
- Duncan, O.; Allen, T.; Foster, L.; Senior, T.; Alderson, A. Fabrication, characterisation and modelling of uniform and gradient auxetic foam sheets. Acta Mater. 2017, 126, 426–437. [Google Scholar] [CrossRef]
- Stojmanovski Mercieca, L.A.; Formosa, C.; Grima, J.N.; Chockalingam, N.; Gatt, R.; Gatt, A. On the Use of Auxetics in Footwear: Investigating the Effect of Padding and Padding Material on Forefoot Pressure in High Heels. Phys. Status Solidi Basic Res. 2017, 254, 1700528. [Google Scholar] [CrossRef]
- Cheng, H.C.; Scarpa, F.; Panzera, T.H.; Farrow, I.; Peng, H.X. Shear Stiffness and Energy Absorption of Auxetic Open Cell Foams as Sandwich Cores. Phys. Status Solidi Basic Res. 2019, 256, 1800411. [Google Scholar] [CrossRef]
© 2020 by the authors. Licensee MDPI, Basel, Switzerland. This article is an open access article distributed under the terms and conditions of the Creative Commons Attribution (CC BY) license (http://creativecommons.org/licenses/by/4.0/).