Proceeding Paper

Investigation on Indoor Air Quality in the Badminton Hall of Wuhan Sports University in winter Based on Subjective Questionnaire Survey and Field Test †

1
Department of Physical Education, Northwest Polytechnical University, Xi’an 710072, China
2
School of Sports Engineering and Information Technology, Wuhan Sports University, Wuhan 430079, China
*
Author to whom correspondence should be addressed.
Presented at the 13th conference of the International Sports Engineering Association, Online, 22–26 June 2020.
Proceedings 2020, 49(1), 148; https://doi.org/10.3390/proceedings2020049148
Published: 15 June 2020

Abstract

:
More and more people play badminton and pay close attention to indoor air quality (IAQ) in the badminton hall. In order to get the perception of the reception for IAQ from the badminton players, a subjective questionnaire was done separately in the badminton hall of Wuhan Sports University. A Field Test was done in the badminton hall and testing parameters included carbon monoxide (CO2), PM2.5, Volatile Organic Compounds (TVOC), etc. The results show that the testing result was consistent with the questionnaire and the environmental parameters were within the scope of national standards. The results indicated that, although IAQ in the badminton halls can be accepted currently, there are still many unsatisfactory elements. The air freshness in most indoor badminton halls is relatively low, the ventilation is insufficient and the mugginess is strong.

1. Introduction

With the development of economy and technology, as well as the continuous improvement of living standards, national fitness activities in China have become more and more common, and more and more people participate in the stadiums. The poor indoor air quality (IAQ) will have different degrees of physical and psychological effect on sports participants, spectators and other groups. The influence of IAQ on physical exercise, and the research and evaluation methods of IAQ in the stadiums should be studied systematically.
Zhang et al. (2009) [1] evaluated the IAQ of some Olympic venues and media villages. The result showed that the indoor pollutant index that exceeded the standard rate of every venue was low, and more than 95% of the detecting points were clean and unpolluted. Zhang et al. (2012) [2] used various methods to evaluate the IAQ of some university stadiums in Henan Province, the results showed that carbon monoxide (CO2) in the normal range, CO2 was higher than the national standard. Lu et al. (2013) [3] selected 20 subjects to perform equal load exercise under two different ventilation conditions and found that CO2 concentration had a significant impact on the exercise ability of the indoor personnel. Rajagopalan et al. (2013) [4] studied the Heating Ventilation and Air Conditioning (HVAC) benefits of the Victoria Aquatic Center Gymnasium in a mild climate under natural and mixed ventilation. The spatial temperature distribution, thermal comfort, CO2 concentration and tracer gas method applied in ventilation was mainly studied. Chen et al. (2014) [5] selected representative gyms in Jiangsu province as survey objects and the IAQ was measured during their business time. It was found that the most serious pollution place was the spinning room. Ramos et al. (2014) [6] measured indoor air pollutants (PM2.5, PM10, CO2 and VOC) in 11 fitness centers in Lisbon. The results showed that the concentration of CO2 and VOC exceeded the national limit. The results showed that the air pollution in the fitness center can be reduced by optimizing the HVAC system, ventilation rate and the exercisers’ behavior.
At present, the haze situation in various regions is becoming more and more serious, and the IAQ is getting worse and worse. An effective and mature IAQ evaluation method was established by referring to subjective and objective evaluation methods [7,8]. PM2.5, CO2 and Volatile Organic Compounds (TVOC) are generally selected as indoor air parameters for the field test. The main research direction is still limited in residential buildings, the structure of the different level education (kindergarten, middle school and university classroom, library, dormitory, etc.), work buildings (office, workshop, etc.), transportation or crowded places (bus, subway, elevator, etc.), hospitals, museums, restaurants, etc., and living and working places [9,10,11,12,13,14,15]. However, there is little research on the indoor environment of sports buildings, especially the badminton hall with more participants. Due to the particularity and functionality of sports buildings, the indoor environment is different between the ordinary buildings and sports buildings. With the increase in exercise intensity, people who participate in sports can exchange more energy and materials with the surrounding environment and have higher requirements on the indoor environment. Therefore, due to the uniqueness of the construction and function of sports buildings, the conclusion of the indoor environment of other buildings is not completely suitable for sports buildings.
The subjective questionnaire survey and field test on IAQ of badminton hall of Wuhan Sports University (WSU) was done. Based on the subjective questionnaire survey, people’s feelings about the current air quality and the problems of IAQ were foubd and the reasons analyzed. At the same time, the environmental parameters in the badminton hall were measured.

2. Materials and Methods

The object is the badminton hall of WSU in the winter of 2015. Based on the domestic and foreign literature, the relevant experts from Tsinghua University, Chongqing University and other research institutes and the indoor environment questionnaire at present, the questionnaire was designed. This questionnaire has a good reliability and validity (the reliability is 0.71 and the validity is 0.56). The questionnaire of the IAQ includes: odor and musty taste, stuffy feeling, ventilation, air quality satisfaction, air quality expectation. The test parameters include CO2 concentration, TVOC and PM2.5. The parameters of the test instrument are shown in Table 1.
According to the relevant indoor environment standards, there are different methods to select the location of test. In the winter, the testing point is near the window, the entrance and exit of the door, the places near the heat source, the places under the tuber and other unfavorable places. The badminton hall is divided into competition areas and rest areas. The height of the testing point should be 0.6 m away from the ground when sitting in the rest area and 1.1 m away from the ground when standing in the competition area.
Based on the “evaluation standard of indoor thermal and humid environment of civil building”, the test point for the area less than or equal to 16 m2 is in the center of the area. If the area is larger than 16 m2 and less than 30 m2, two equal points on the diagonal are selected as test points. If the area is larger than 30 m2 and less than 60 m2, three equal points on the diagonal of the test area shall be selected as the test points. The five equal points on the two diagonals were selected as test points for the area larger than 60 m2. The tested badminton hall is 13.4 m at length, 6.10 m at width and the area is 81.74 m2. Generally, the number of badminton venues is more than 6, and the venue of the area is much greater than the civil building’s, so the measurement points are five equal points on the two diagonals of the civil area greater than 60 m2.

3. Results

3.1. Questionnaire Inquiry

(1) The smell of the participants when the participant just entered the hall.
Among the participants in the badminton hall of WSU, about 60% of them felt a “slight odor” when they first entered the hall, 22% of them felt “strong odor” and 20% of them felt “no odor”. Overall, 60% chose “mild odor” and 20% chose “no odor.” The peculiar smell is greatly affected by the hall itself (formaldehyde, etc.), as well as the weather of the day (haze, etc.) and the ventilation of the hall;
(2) The smell of mildew when the participant entered the venue.
A total of 35%, 33% and 18% of the participants thought that the moldy smell was “general”, “few” and “fewer”, respectively. A total of 13% of the participants thought that the moldy smell inside the hall was “big”, while almost none thought that the moldy smell inside the hall was “very big”. It can be seen that the musty smell in the badminton hall of WSU can be accepted by more than 80% of the participants;
(3) The sense of smell when the participants were inside the stadium at the time of the survey.
For a period of time after entering the stadium, the percentage of “slight odor” and “strong odor” decreased. About 50% of them chose “slight odor”, about 13% felt a “strong odor” and 35% felt “no odor”. It was found that the participants’ sense of odor decreased with the increase in time. Therefore, odor perception was investigated in a controlled way;
(4) The source of the peculiar smell, according to the participants.
Some participants thought that the source of indoor peculiar smell was the venue equipment. The percentage was about 50%. The percentage of the participants who thought the sources of indoor peculiar smell were “clean and disinfected water”, “building of the venue itself”, “food or drink taken out”, or “sweat smell” was between 20% and 25%;
(5) The source of the mugginess in the hall, according to participants.
More than 50% of the participants thought that the indoor of the hall was “slightly suffocated”, and nearly 40% of the participants thought that it was “no suffocation”. The feeling of suffocation is closely related to the ventilation of the hall, because the opening and closing of doors and windows, outdoor air quality problems and so on will affect the feeling of suffocation in the hall;
(6) Participants’ feelings of dust during in the hall the survey.
The percentage of the participants who thought that the dust in the indoor venue was “more” was 20%, the percentage of the participants who thought that the dust in the indoor venue was “much” was 1.28% and the percentages of the participants who thought that the dust was “moderate”, “less” and “little” accounted for 34.6%, 33.3% and 11.5% of the total number, respectively. Thus, it can be seen that 80% of the participants think that the dust in the indoor venue is moderate or less;
(7) Participants’ satisfaction with outdoor air quality.
During the questionnaire survey, the outdoor air quality of the badminton hall of WSU was relatively good. The percentages of the participants who thought that the outdoor air qualities were “average” and “relatively satisfied” were close to 40%. The percentage of the participants who thought that the outdoor air quality was “satisfied” accounts for about 15%, for another, the percentages of the participants that were “less satisfied” and “dissatisfied” were 5.1% and 2.5%. Therefore, it was found that the outdoor air quality is more acceptable for most people during the questionnaire survey in the WSU;
(8) Participants’ satisfaction with indoor air quality.
The percentages of participants who thought that the IAQ was “relatively satisfied” and “average” were 35% and 50%. Only 10% of participants thought that IAQ was “satisfied” and 5% of participants who thought that IAQ was “less satisfied”. Therefore, the participants’ satisfaction with IAQ is not very good and it is necessary to improve the IAQ;
(9) Participants’ overall satisfaction with the ventilation of the hall.
The percentages of “satisfied”, “relatively satisfied”, “general”, “less satisfied” and “dissatisfied”, the percentages of participants were 8.97%, 23.08%, 51.28%, 14.10% and 2.56%, respectively. It can be seen that about 85% of participants can accept the ventilation condition of the badminton hall of WSU;
(10) Reasons for participants’ dissatisfaction with IAQ.
The percentages of “peculiar smell”, “moldy taste”, “suffocating feeling” and “dust” accounted for 23%, 9%, 33% and 23% of responses, respectively. It can be seen that participants’ dissatisfaction with indoor air quality was due to three aspects: “peculiar smell”, “suffocation” and “dust”. “Peculiar smell” and “moldy taste” are related to the degree of indoor air purification, while “suffocation” requires enhanced ventilation;
(11) Participants’ expectations with IAQ.
The percentage of “keep the status”, “slightly improve” and “significantly improve” accounted for 8.97%, 71.79% and 19.23% of participants, respectively. It can be seen that more than 90% of participants expect that the air quality in the hall can be improved.

3.2. Results of Field Tests

3.2.1. CO2

The indoor and outdoor CO2 content of each hour is tested by two points, respectively. The value of CO2 on each testing point is the average value of the data measured within three minutes before and after each whole point (every 10s).
Figure 1 shows the change in indoor and outdoor CO2 content with the different times during the testing. It was found that there is a rising trend of indoor and outdoor CO2 content, which is 569 ppm at 10 a.m. and 1063 ppm at 6 p.m. Combined with the change chart of the number of people in the hall, it can be concluded that the CO2 content increases with the increasing number of people in the hall, but only slightly decreases when the number of people decreases at 19:00. The outdoor CO2 content fluctuates relatively little in the whole day. At 6 p.m., the CO2 content has reached 617 ppm. From 10 a.m. to 4 p.m., the CO2 content fluctuates back and forth between 470–528 ppm. The fastest rising time is between 4–5 p.m., and at 19 p.m., the CO2 content slightly drops to 589 ppm. Thus, it can be seen that the indoor CO2 content increases with the increase in people while the outdoor CO2 content fluctuates in a certain range, and the CO2 concentration will be affected by people’s activities. The chart shows that the concentration of outdoor CO2 is passively large in the later stage, which can also be suspected to be caused by small problems of the instrument itself. All measured CO2 content is within the scope of national standard (<2000 mg/m3).

3.2.2. TVOC

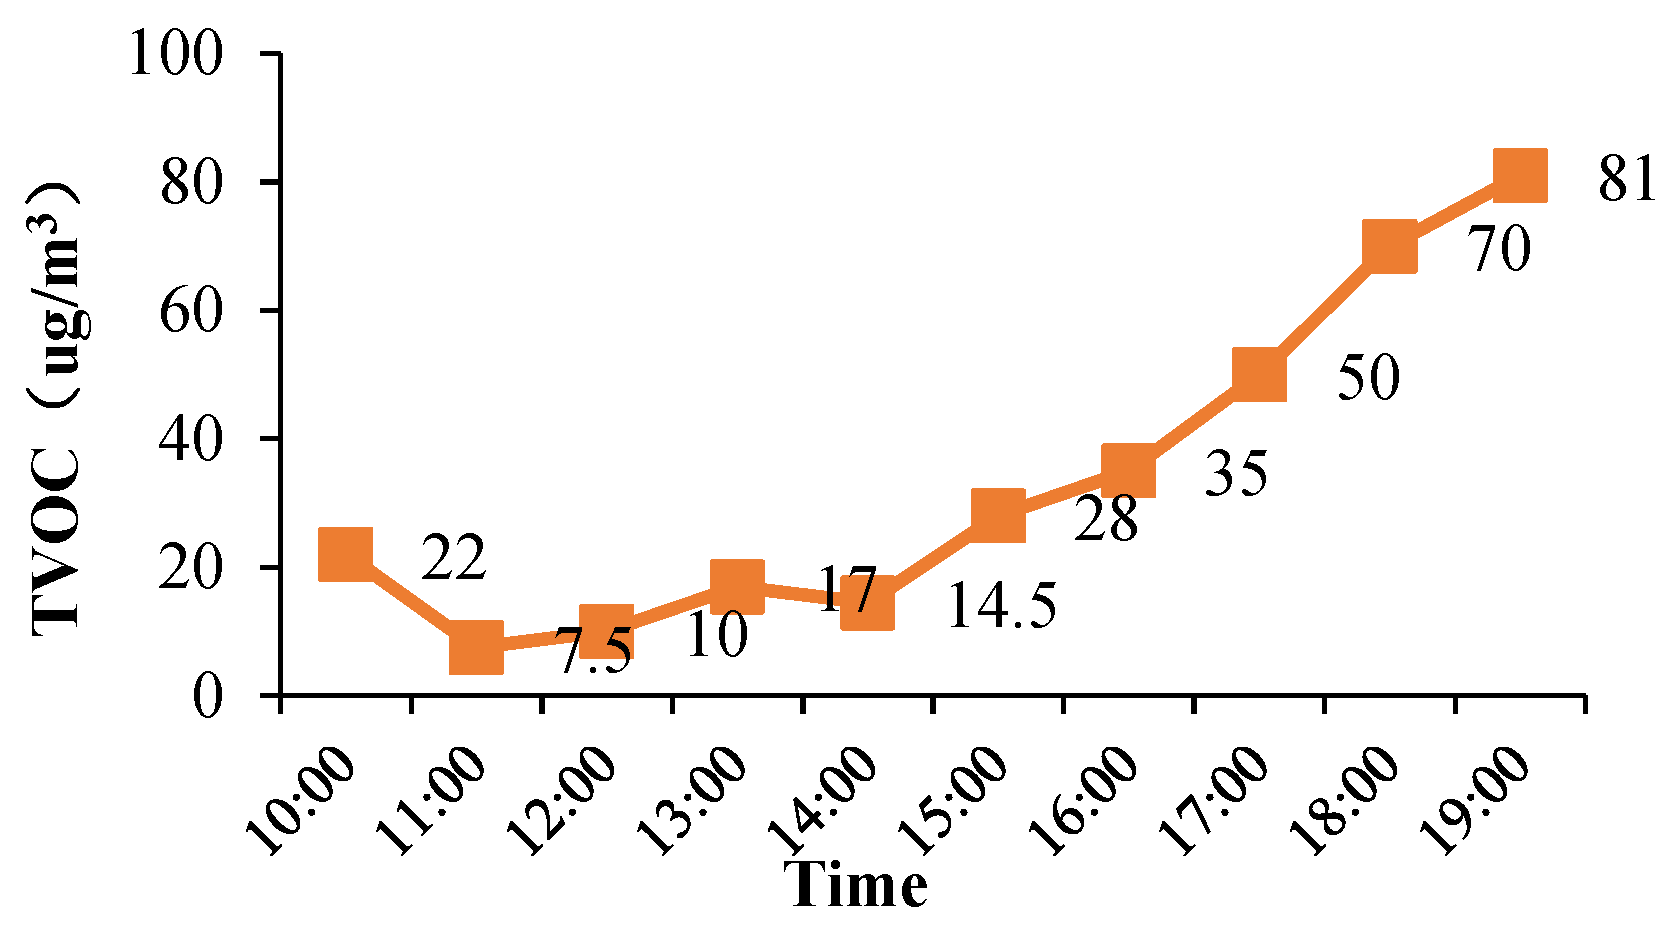
The indoor TVOC content of each whole point time is the average value of the data measured before and after each whole point (every 10s). Figure 2, the TVOC concentration keeps increasing with time (the first point is the appearance value when the instrument starts, thus it can be ignored). From 11 a.m., the TVOC content is 7.5 μg/m3, and at 19:00, the TVOC content rises to 81 μg/m3, but the highest value is also within the national standard range (< 600 μg/m3). In Figure 2, it is found that the change trend of TVOC content is the same as the change trend of indoor CO2 content. Because the content of formaldehyde is not measured in the test, the comparison between formaldehyde and TVOC will not be made. In summary, the change of TVOC content will be affected by human activities and indoor temperature, and it is also closely related to indoor CO2 content and formaldehyde content.

3.2.3. PM2.5

The indoor and outdoor PM2.5 content of each whole point time is tested by two points. The value of each testing point is the average value of the data measured before and after each whole point (every 10s). It was found that the indoor PM2.5 content increased from 9 to 11 a.m. and from 84 to 130 μg/m3, and from 11 a.m. to 5 p.m. and the PM2.5 content fluctuated between 119 and 132 μg/m3. From 5 to 6 p.m., the PM2.5 content increased from 119 to 173 μg/m3, while the outdoor PM2.5 content had a similar change trend with the indoor PM2.5 content. It can also be assumed that the similar indoor and outdoor PM2.5 content is related to the indoor ventilation. Among the PM2.5 content measured in a day, the lowest value is 91 μg/m3 at 9 a.m., the highest value is 153 μg/m3 at 5 p.m. Therefore, the PM2.5 content may increase with the accumulation of personnel activities, and the highest value is 173 μg/m3 which is within the scope of national standard and the national standard of PM2.5 content is less than 250 μg/m3.

4. Discussion

(1) In the indoor field test, the highest CO2 content was 1063 ppm; the highest TVOC content was 197 μg/m3; the highest formaldehyde content was 61.32 μg/m3; the highest PM2.5 content was 173 μg/m3, and the highest values of the measured parameters were lower than the national standard;
(2) Based on the questionnaire survey, it could be seen that about 60% of the participants sensed a slight peculiar smell and about 20% of the participants sensed a strong peculiar smell;
(3) For the indoor peculiar smell, 50% of the participants thought that the source of peculiar smell was the equipment in the hall (such as glue), nearly 25% of the participants thought that it was clean water or the building itself (wall coating, etc.), the food and sweat smell brought out, and 20% of the participants thought that it was other things (such as mold);
(4) For the indoor moldy taste, more than 85% of the participants thought that moldy taste belonged to normal or very small to no feeling;
(5) For the indoor suffocating feeling, nearly a half of the participants thought it was a slight suffocation, less than 10% of the total people had a strong feeling of suffocation, and the remainingt 40% thought there was no feeling of suffocation;
(6) For the indoor dust, 80% of the participants thought dust was normal, and 40% thought dust was little;
(7) For the satisfaction with indoor and outdoor air quality, about 40% of the participants were satisfied with the indoor air quality, and about 55% of the total participants were satisfied with the outdoor air quality, while about 50% of the participants thought that the indoor air quality was general, and 35% of the total participants thought that the outdoor air quality was general. It can be seen that people are highly satisfied with outdoor air quality;
(8) For reasons for the dissatisfaction with the indoor air quality, 23% of the participants thought it had a peculiar smell, 9% of the participants thought it had a moldy taste, 33% of the participants thought it had suffocation, and 28% of the participants were not satisfied with indoor dust;
(9) For expectations with the indoor air quality, 90% of the participants expected that the air quality could be improved, and 20% of them expected that the air quality could be significantly improved, and they expected to participate in physical exercise in a better environment in the future.

5. Conclusions

The comprehensive evaluation method of the combination of questionnaire survey and field test is very suitable for the research about indoor air quality. The satisfaction or dissatisfaction with the indoor air quality could be got based on the comprehensive questionnaire survey and the objective data of the field test can confirm the survey. Based on the comprehensive questionnaire survey and field test, the results of the questionnaire survey were consistent with the results of the field test. Although the measured values of the parameters of the field test were all within the scope of the national standards, people’s satisfaction with the air quality in the hall was not high in the questionnaire survey. It can be seen that the indoor air quality of the badminton hall can no longer meet the high requirements of people in the future with the development of the economy and culture. However, the parameters of the national standard can only be regarded as the standard of general building indoor air quality parameters. It will not be applicable to special buildings’ indoor air quality, such as sports fitness venues.
In the future, the questionnaire survey should be firstly carried out on the hall. Then, a targeted field test will be done in the hall based on the analysis of the questionnaire survey. In this study, the test parameters only involved CO2, TVOC and PM2.5. There are many parameters related to indoor air quality that have not been tested systematically and comprehensively. In the follow-up study, more environmental parameters should be tested.

Funding

This research was funded by the East Lake Scholars Sponsorship Program of Wuhan Sports University and Double-First-Class Construction Projects.

Conflicts of Interest

The authors declare no conflict of interest.

References

  1. Zhang, J.P.; Zhang, Y.P.; Gao, P.; Yao, Y.; Zhou, Z.P. Test and Evaluation on Indoor Air Quality in Olympic Gymnasiums. Build. Sci. 2009, 25, 26–32. [Google Scholar]
  2. Zhang, D.C.; Zhang, Y.F. Investigation and Analysis on Air Quality of Indoor Sports Environment of Colleges and Universities. J. Beijing Sport Univ. 2012, 35, 103–107. [Google Scholar]
  3. Lu, W.H.; Chen, J.; Feng, X. Effect of Indoor Air Quality on the Sports Ability of Male College Students. Sport Sci. Res. 2013, 34, 72–74. [Google Scholar]
  4. Rajagopalan, P.; Luther, M.B. Thermal and ventilation performance of a naturally ventilated sports hall within an aquatic centre. Energy Build. 2013, 58, 111–122. [Google Scholar] [CrossRef]
  5. Chen, J.A.; Zhou, Z.B.; Lu, A.M. Investigation and Analysis on Air Quality of Indoor Sports Environment in Gym. China Sport Sci. Technol. 2014, 50, 140–145. [Google Scholar]
  6. Ramos, C.A.; Wolterbeek, H.T.; Almeida, S.M. Almeida. Exposure to indoor air pollutants during physical activity in fitness centers. Build. Environ. 2014, 82, 349–360. [Google Scholar] [CrossRef]
  7. Kim, J.; de Dear, R.; Candido, C.; Zhang, H.; Arens, E. Gender differences in office occupant perception of indoor environmental quality (IEQ). Build. Environ. 2013, 70, 245–256. [Google Scholar] [CrossRef]
  8. Zalejska-Jonsson, A.; Wilhelmsson, M. Impact of perceived indoor environment quality on overall satisfaction in Swedish dwellings. Build. Environ. 2013, 63, 134–144. [Google Scholar] [CrossRef]
  9. Theodosiou, T.G.; Ordoumpozanis, K.T. Ordoumpozanis. Energy, comfort and indoor air quality in nursery and elementary school buildings in the cold climatic zone of Greece. Energy Build. 2008, 40, 2207–2214. [Google Scholar] [CrossRef]
  10. Dascalaki, E.G.; Sermpetzoglou, V.G. Energy performance and indoor environmental quality in Hellenic schools. Energy Build. 2011, 43, 718–727. [Google Scholar] [CrossRef]
  11. Lee, M.C.; Mui, K.W.; Wong, L.T.; Chan, W.Y.; Lee, E.W.M.; Cheung, C.T. Student learning performance and indoor environmental quality (IEQ) in air-conditioned university teaching rooms. Build. Environ. 2012, 49, 238–244. [Google Scholar] [CrossRef]
  12. Ma, Y.; Zheng, Q.Z.; Liu, L.; Lin, S.J.; Zhang, S.; Liu, Z.R. Design on monitoring system of indoor environment parameters based on wireless sensor networks in the gymnasium. J. Wuhan Inst. Phys. Educ. 2017, 51, 70–76. [Google Scholar]
  13. Gładyszewska-Fiedoruk, K. Correlations of air humidity and carbon dioxide concentration in the kindergarten. Energy Build. 2013, 62, 45–50. [Google Scholar] [CrossRef]
  14. Jovanović, M.; Vučićević, B.; Turanjanin, V.; Živković, M.; Spasojević, V. Investigation of indoor and outdoor air quality of the classrooms at a school in Serbia. Energy 2014, 77, 42–48. [Google Scholar] [CrossRef]
  15. Guo, H.; Gao, F.; Dong, J.G.; Wu, Y.S. Measurement and analysis on the indoor air quality in the public catering building. J. Xi’an Univ. Archit. Technol. (Natural Science Edition) 2013, 45, 559–564. [Google Scholar]
Figure 1. Indoor and outdoor CO2.
Proceedings 49 00148 g001
Figure 2. TVOC.
Figure 2. TVOC.
Proceedings 49 00148 g002
Table 1. Parameters and types of test instrument.
NameTypeContentsRangePrecision
CO2 MonitorsHOBO UX120-006MCO25000 PPM±50 PPM
Portable volatile organic compounds (TVOC) MonitorsPGM-7340TVOC0.1 ppm~2000 ppm10–2000 ppmCalibration Point ±3% isobutene
Air Quality Monitor Particle CounterAM510PM2.50.001~20 mg/m3±0.001 mg/m3
Publisher’s Note: MDPI stays neutral with regard to jurisdictional claims in published maps and institutional affiliations.