1. Introduction
Running shoes, as the only interface between the surface and the runner, play an important role with respect to injuries and performance. Sufficient cushioning attenuates impact forces and protects the musculoskeletal system from potential injury [
1]. Consequently, many consumers look for certain properties such as shock absorption in the insole or midsole of footwear materials [
1]. Insoles (compared to midsoles) have less shock attenuation capacity; however, in some subjective tests, insoles have been found to attenuate impact shock compared to running barefoot [
2]. The cushioning features of running shoe are investigated in two ways: subjective and objective measurements. The perception of cushioning (subjective measurement) is a significant issue, especially in the field of the etiology of sports injuries, and is closely linked to neuromuscular and adaptational processes. The perceived (dis)comfort of cushioning is evaluated with different interview techniques, including Likert scales, visual analogue scale (VAS) and binary questionnaires. For the objective measurements of rebound, damping and other material parameters, impact testing methods are common [
3], many of them being standardized [
4]. However, there is a limited number of studies that attempt to investigate the link between the cushioning feature of shoes in subjective and objective measurements [
5]. The aim of the current study is to examine insole cushioning properties in objective and subjective measurements and investigate the potential relationship between these two measurements.
2. Material and Methods
2.1. Objective Measurement: Impactor
A dynamic shock absorption test (
Figure 1a) was used for the measurement of cushioning properties. The pneumatic impactor device consists of a 5 cm diameter and 4.3 kg weight. The machine operates by allowing the weight to fall onto the tested material (see
Figure 1b) from a defined height of 6 mm. A single axis accelerometer sensor (range of −50 g to 50 g) was attached to the impactor in order to quantify the shock absorption with a measuring frequency of 5000 Hz. This method overcomes the limitations of a quasi-static compression test and better emulates the impact of the heel on the ground in a heel stride. The impact tester provides the acceleration-time graph, which is exemplarily represented in
Figure 1c.
2.2. Objective Measurement: Insole Material
Three commercially available insole materials—(i) ethylene-propylene-diene-monomer rubber foam (EPDM), (ii) silicon-gel, and iii) synthetic viscoelastic urethane polymer Sorbothane, and their combination (see Table1)—were prepared in the pilot study. In total, 12 samples were tested using an impactor device. Four insole samples, one with the highest, one with the lowest and the two materials with middle ranges magnitudes of the peak accelerations, were selected to use in the subjective measurement. These were as follows: EPDM 6 mm (E), silicon −gel 3 mm(G), synthetic viscoelastic 3.17 mm (S1), and synthetic viscoelastic 4.7 mm (S2).
2.3. Subjective Measurement (Wear Test)
Nineteen (N = 19) participants were recruited from the sports center at the Technical University of Munich with a mean age of 23.89 (standard deviation, SD 2.31), weight of 78.84 kg (SD 2.81), and height 173.52 cm (SD 3.08). The plantar sensitivity of the participants was measured with 3.61 monofilament (Semmes Weinstein Monofilament Examination) which is equivalent to 0.4 g of linear pressure.
2.4. Pairwise Comparison Test and Visual Analogue Scale
A pairwise comparison test (PWCT) on n abilities requires a number of n (n − 1)/2 different combinations which must be tested by each tester [
6,
7]. With paired comparisons, respondents selectthe stimulus, or item, in each pair that had the greater magnitude on the choice dimension they were instructed to use. PWCT is a binary test that requires only a simple decision between two alternatives. In our study, participants performed six pairwise comparison tests with shoes which were equipped with one of the four abovementioned insoles in a random order, i.e., (E vs. G); (E vs. S1); (E vs. S2); (G vs. S1); (G vs. S2); (S1 vs. S2). Further the PWCT was combined with a rating decision using the visual analogue scale. This instrument measures “a characteristic or attitude that is believed to range across a continuum of values and cannot easily be directly measured in 100 mm or 150 mm. For example, the amount of pain that a patient feels ranges across a continuum from none to an extreme amount of pain” [
8]. During the experiment procedure, participants were not able to touch the insole with their hand or walk in the shoes. In each PWCT, participants ran for 3 min on the treadmill with the first of the two insoles (embedded in the shoe) and then immediately changed to the other insole and ran for the same time duration. To minimize the effect of the fatigue on subjective measurements, the treadmill was set at a constant velocity of 2.7 m/s (the value was determined in a pretest as optimal for the subjects in test). After each PWCT, the subjects had to answer the following three questions:
Q1. Is there any difference between the cushioning features between the two shoes? Possible answers: Yes/No. Analysis: Distribution of responses.
Q2. Which shoe can be perceived as “…having a better cushioning comfort”? Possible answers: “The first shoe”/“The second shoe”. Analysis: Decision matrix and Cochran Q-Test to test for inconsistency.
Q3. Which discomfort level with respect to cushioning do you perceive with shoe 1 and shoe 2, respectively? Possible answers: Marking on a 100 mm VAS-scale. Analysis: Mean values and the non-parametric Friedman Test for possible differences; Nemenyi posthoc to test the differences between each of the four samples for significance.
3. Results
3.1. Objective Measurement
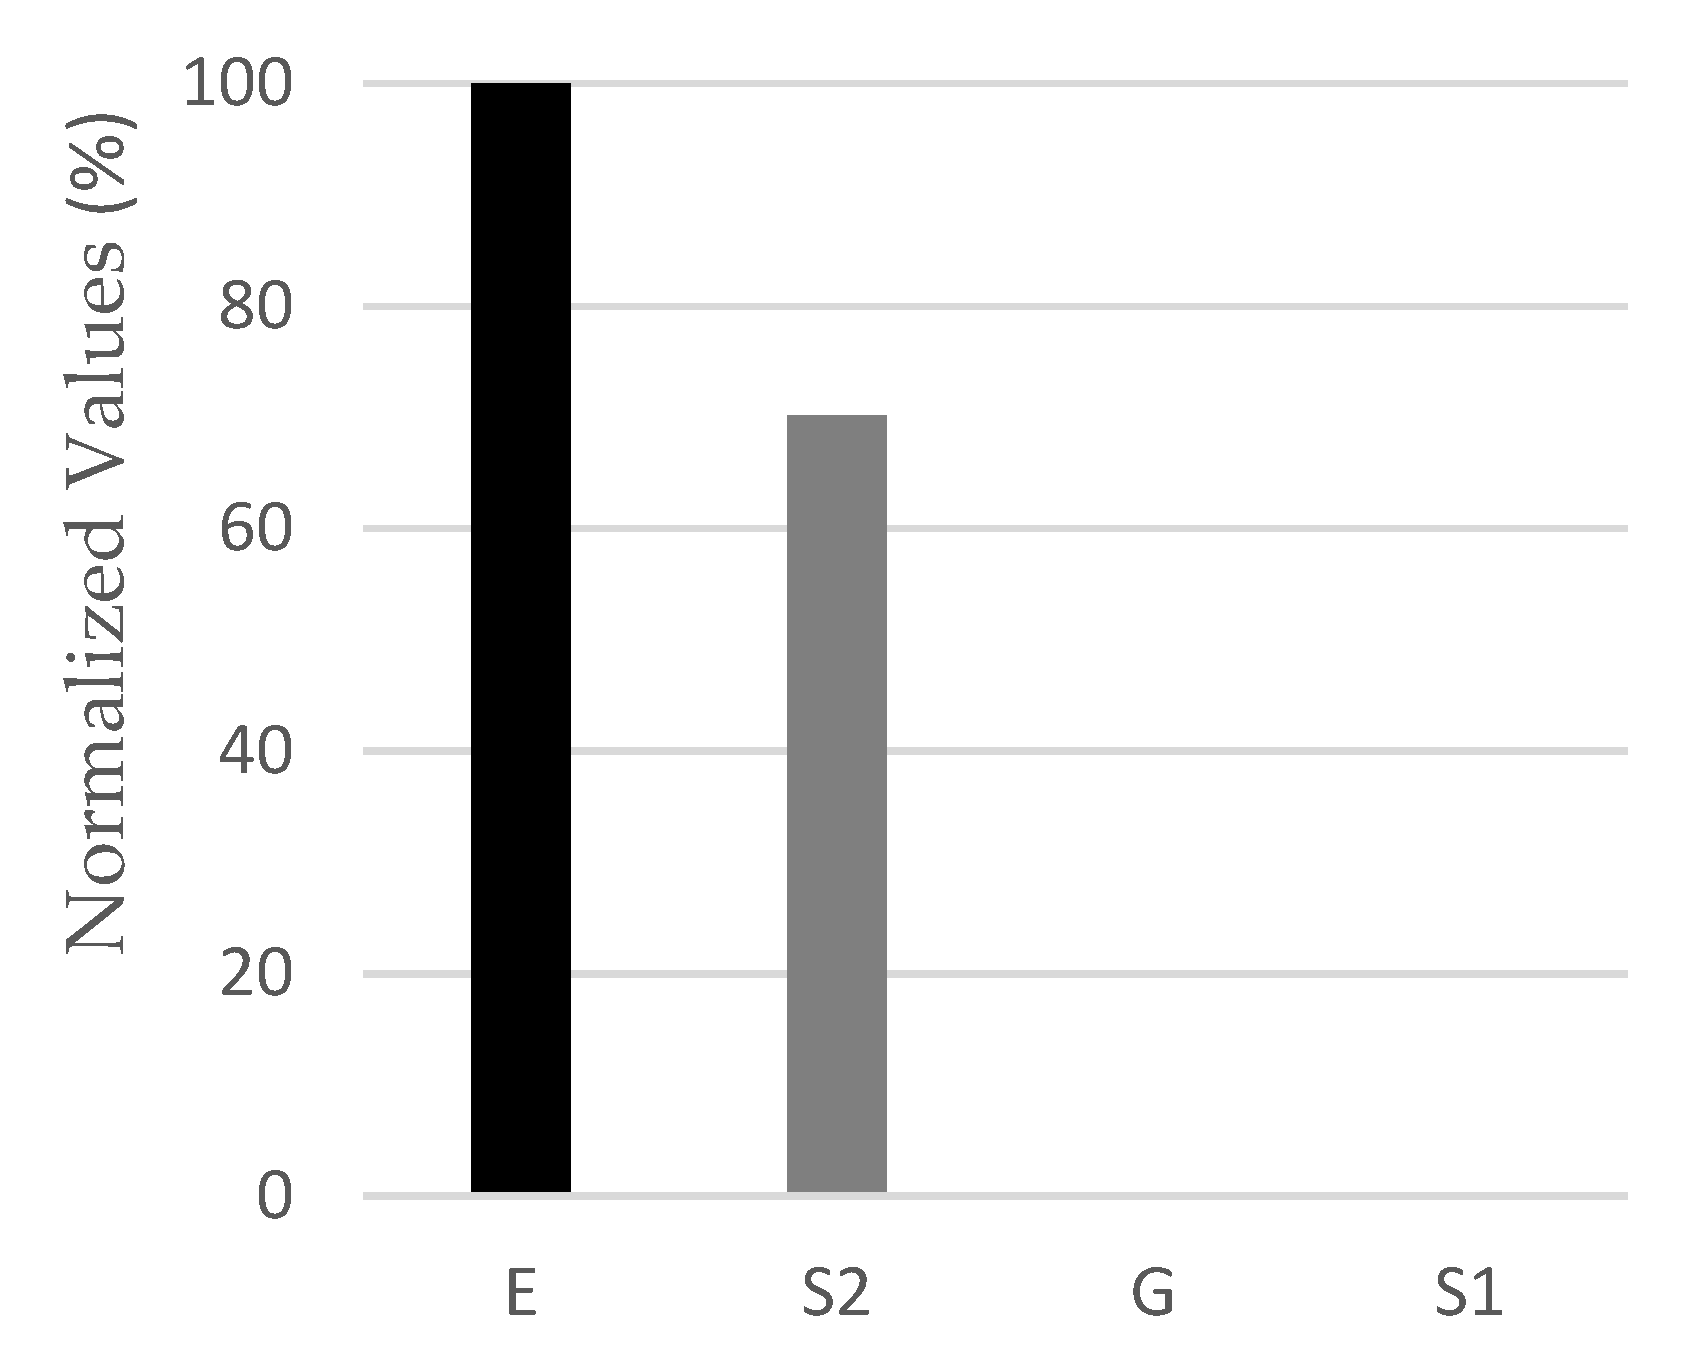
Table 1 shows the 12 samples that were tested using the impactor device. The impact peak acceleration of 12 samples and especially four samples used in the subjective test are shown in
Figure 2 and
Table 1. The mean (and standard deviation) of impact peak of E, G, S1 and S2 were 32.41 g (0.47), 11.54 g (0.25), 12.6 g (1.13), and 7.2 g (0.2), respectively.
3.2 Subjective Measurement
The Weinstein monofilament test showed that there was no significant difference in the plantar sensitivity test of subjects. In their answers to question Q1, all participants in all PWCTs (114 tests) perceived the change of cushioning stimulus. This confirms the results of the Weinstein test and reveals that participants perceived noticeable differences between the insoles in test.
To evaluate the second question Q2, PWCT was used as shown in
Table 2. The four insoles E, G, S1 and S2 were evaluated by using a 4 * 4 square decision matrix. The sums of the numbers in the rows indicate the times that the cushioning comfort of insoles was preferred over the compared one. The inconsistency test using Cochran Q-Test was not significant (p = 0.388), meaning that we had a homogeneous sample of subjects. The main results of the PWCT are given in
Figure 3.
In the responses to the third question Q3, the Friedman Test rendered a Chi-Square value of 57.76 which was significant (p < 0.05). The Nemenyi posthoc test revealed significant differences between (E vs. G), (E vs. S1), (S2 vs. G) and (S2 vs. S1) (see
Table 3).
4. Interpretation and Discussion
In this study, four insole samples were tested using objective and subjective measurements. The results of these measurements for these four samples are shown in contrast in
Figure 4a,b. Obviously the insole S2 with the lowest impact peak acceleration was rated “more comfortable” than insoles G or S1. The subjective ratings of these three insoles are well in line with the measured peak accelerations and fulfill the common paradigm that greater cushioning is related to higher comfort. This, however, was not true for insole E with the 6 mm EPDM. Insole E with the highest impact peak acceleration was rated as the most comfortable with respect to cushioning (
Figure 3 and
Figure 4b).
We assume that the behavior of materials in the beginning phase [
9] can help to explain the observed inconsistency between G, S1 and S2 on the one hand, and insole E on the other.
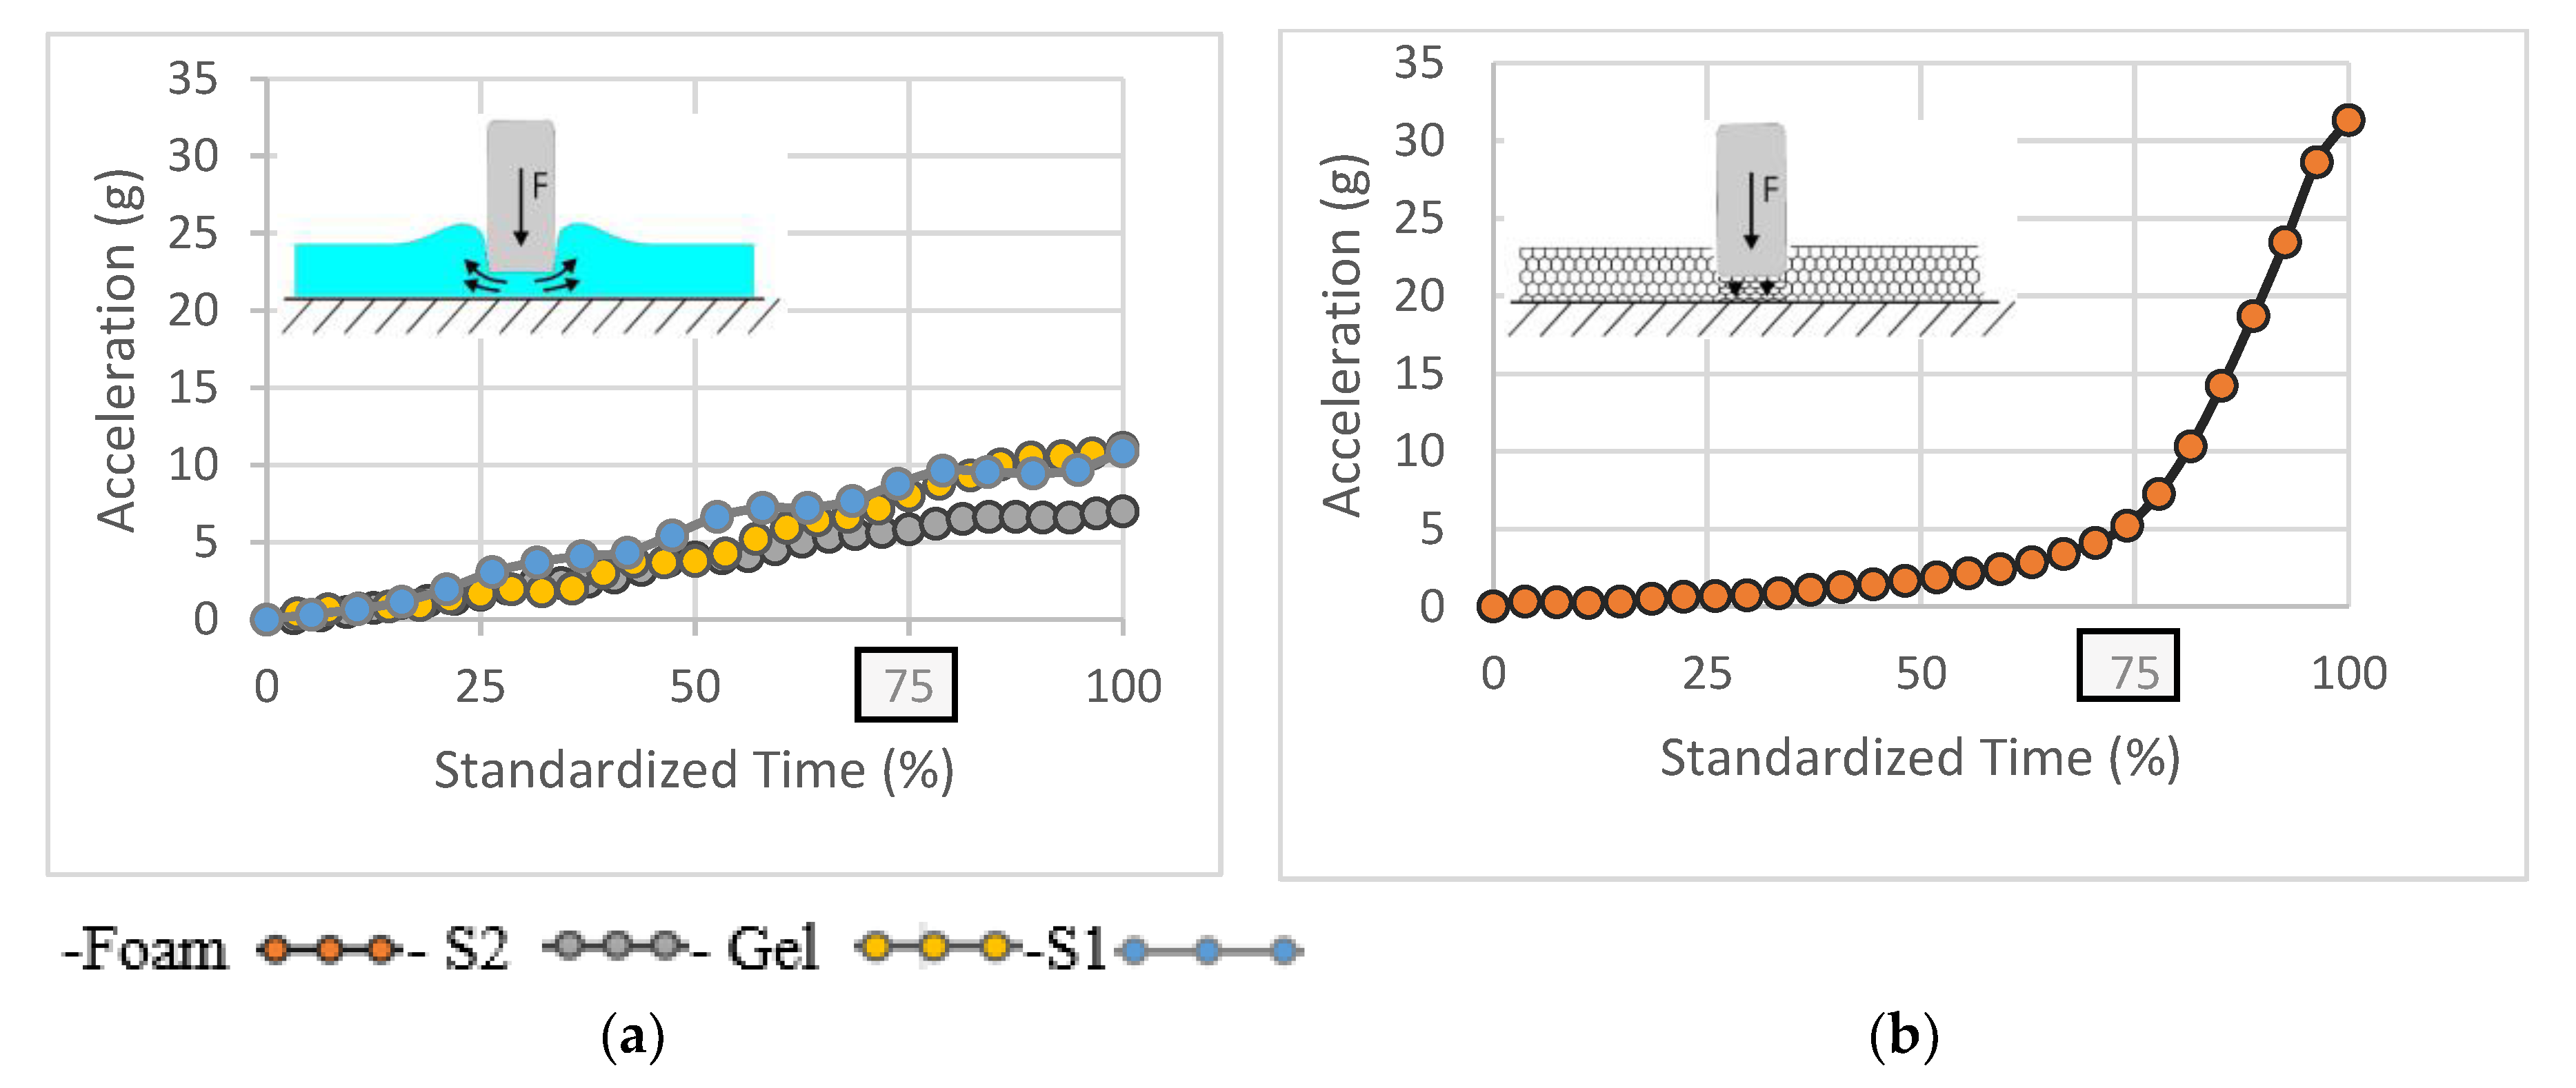
Figure 5a,b represent the time history of the impact acceleration until the peak value (normalized time = 100%) is reached. Whereas insoles G, S1 and S2 show a constant linear increase (
Figure 5a) from the very first contact, insole E (EPDM) only increases to a much lower extent until 50%, and then at 75% shows a sudden change with a much more pronounced gradient (
Figure 5b). One possible material-mechanical explanation is that G, S1 and S2 react to the vertical force by evading local material to the side (see the illustration in
Figure 5a), whereas the 6 mm EPDM of insole E is not able to absorb energy by horizontal displacement and also seems to be overloaded.
By running with insole E, subjects may not have reached to the critical impact energy because of not being in the zone 75% to 100% (critical zone). This may explain positive ratings with respect to the cushioning behavior of insole E. Further investigations are currently ongoing, and high resolution insole pressure measurements could clarify our findings.
If the subjects have reached the “critical zone” on the treadmill, why would they rate insole E so positively?
Participants did not really judge only the cushioning properties of the insoles. The subjective results may come from the perception of some other factors (or their combinations) such as response and energy rebound and perceived stability (which comes from insole material). These factors (in the early phases of contacts) affect their responses and result in the positive ratings for perceived cushioning comfort.
5. Conclusions
The effect of different running shoe insole materials on actual and perceived cushioning was tested with subjective and objective measurements. Four different pairs of insoles varying in thickness and material were evaluated in this experiment. The results showed that lower impact peak (g) led to a higher perception of cushioning comfort only between S1, S2 and G insole materials. To predict perceived cushioning comfort between all four insoles material, it was also necessary to compare acceleration rates at the beginning of the contact phase in the objective measurement.
Insole E in the 75% phase behaved differently than the other three insoles. This may be due either to the fact that: (i) participants did not reach the critical zone; or (ii) they reached the critical zone, but other factors, such as response and energy rebound and perceived stability, influenced their positive rating in the pairwise comparison tests. Further studies should investigate the effect of perceived cushioning comfort on the vertical ground reaction force between different type of insoles, and also its relationship with impact peak in a drop test.


