Proceeding Paper

Investigation of the Athlete’s Motion Using the Gymnastics Apparatus’s Motion †

1
Precision Machinery Engineering, Graduate School of Science and Technology, Nihon University, Funabashi, Chiba 274-8501, Japan
2
Precision Machinery Engineering, College of Science and Technology, Nihon University, Funabashi, Chiba 274-8501, Japan
*
Author to whom correspondence should be addressed.
Presented at the 13th Conference of the International Sports Engineering Association, Online, 22–26 June 2020.
Proceedings 2020, 49(1), 120; https://doi.org/10.3390/proceedings2020049120
Published: 15 June 2020

Abstract

:
In gymnastics, the skeleton of the athletes can be estimated from many points with three-dimensional coordinate data by measurement control using Laser Imaging Detection and Ranging (LIDAR), and the motion can be derived. However, the system cannot know what kind of load is being put on the athletes’ bodies. Additionally, it is not possible to know in detail how top-level athletes handle apparatus. Therefore, it is important to understand the dynamic response of the apparatus to the athlete’s motion. This study shows that the apparatus’s motion can be identified by performing a static load test using a multi-sensing system that can sense how the bar deforms during a game and determine the apparatus’s motions as an inverse analysis.

1. Introduction

In gymnastics, techniques are becoming more diverse and sophisticated with the development of competition. As a result, the athlete’s motion has become more complicated year by year, making it difficult for them to teach and score. In recent years, the study of sensing technologies and sports engineering such as biomechanics has advanced [1]. Therefore, the competition surrounding addressing performance improvement of athletes from a scientific point of view has been increasing. In gymnastics, the skeleton of the athletes can be estimated from many points with three-dimensional coordinate data by measurement control using LIDAR, and the motion can be derived. However, the system cannot know what kind of load is being put on the athlete’s bodies and the apparatus. Additionally, it is not possible to know in detail how top-level athletes handle apparatus. Therefore, it is important to understand the dynamic response of the apparatus to the athlete’s motion. However, it is not desirable to directly attach a sensor to the bar for measurement because it interferes with the competition. If the apparatus’s motion can be grasped by attaching a sensor to the post, measurement can be performed without affecting the competition. This research aims to identify the apparatus’s motion by performing a static load test using a sensing system that can sense how the bar deforms during a competition and determining the apparatus’s motion as an inverse analysis.

2. Experiment

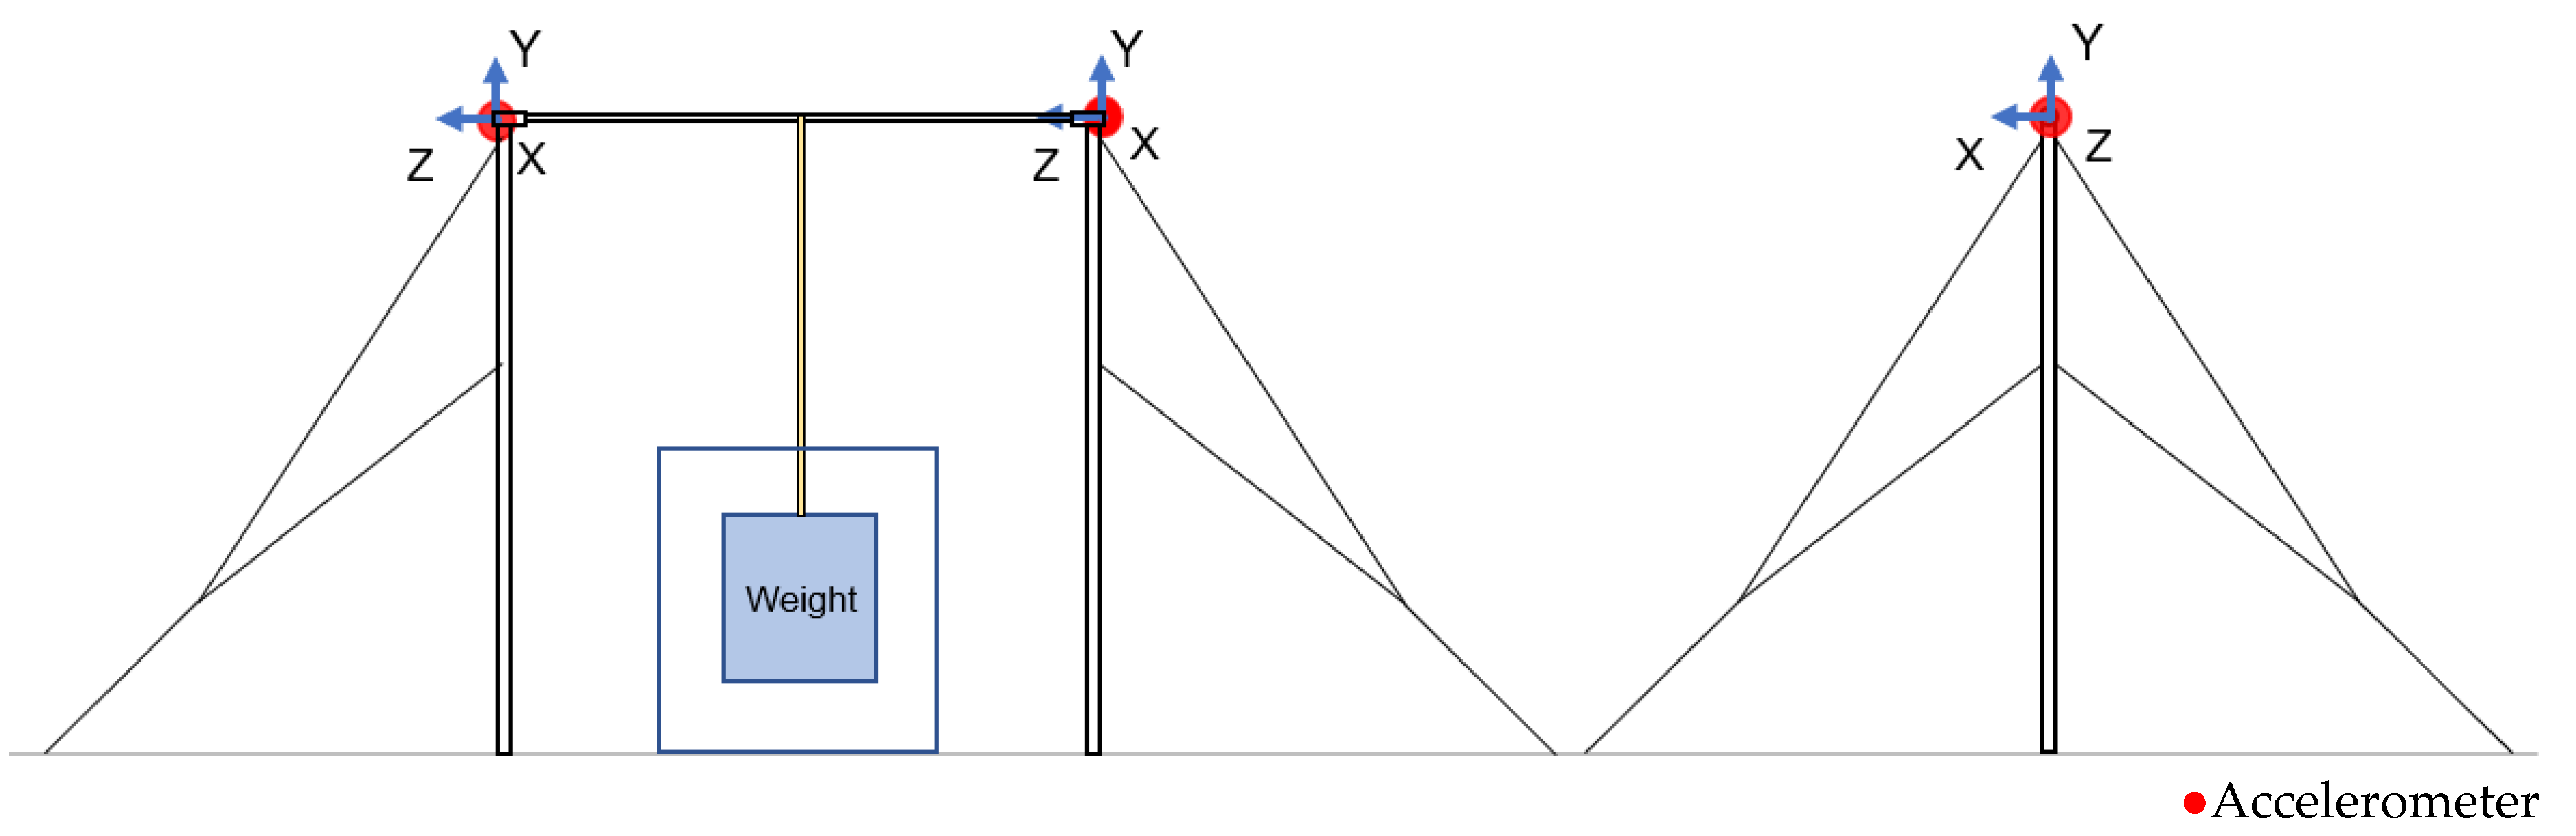
2.1. Experiment That Measures the Apparatus’s Motion
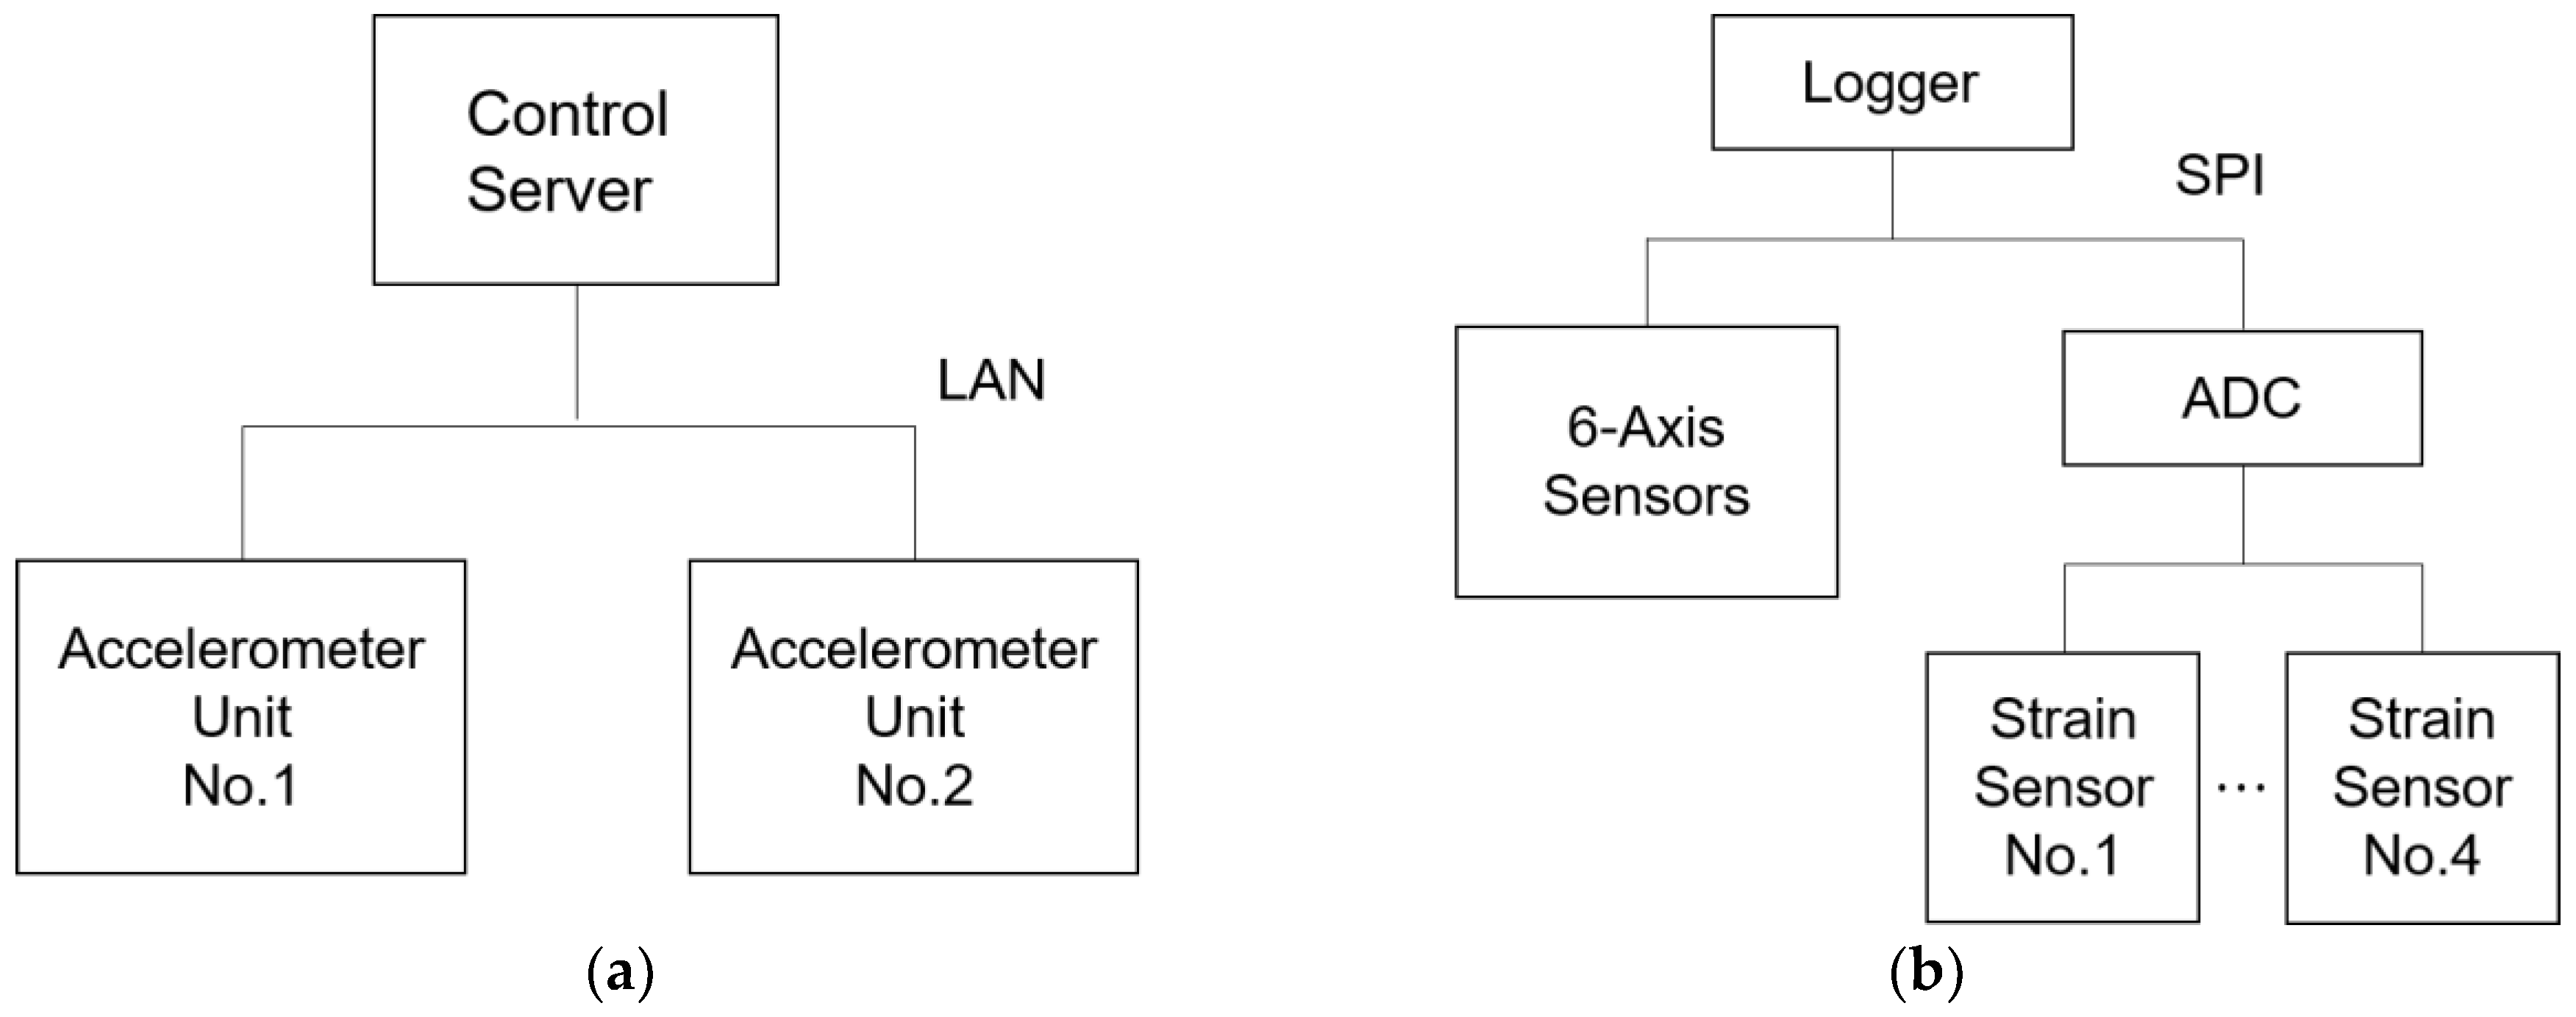
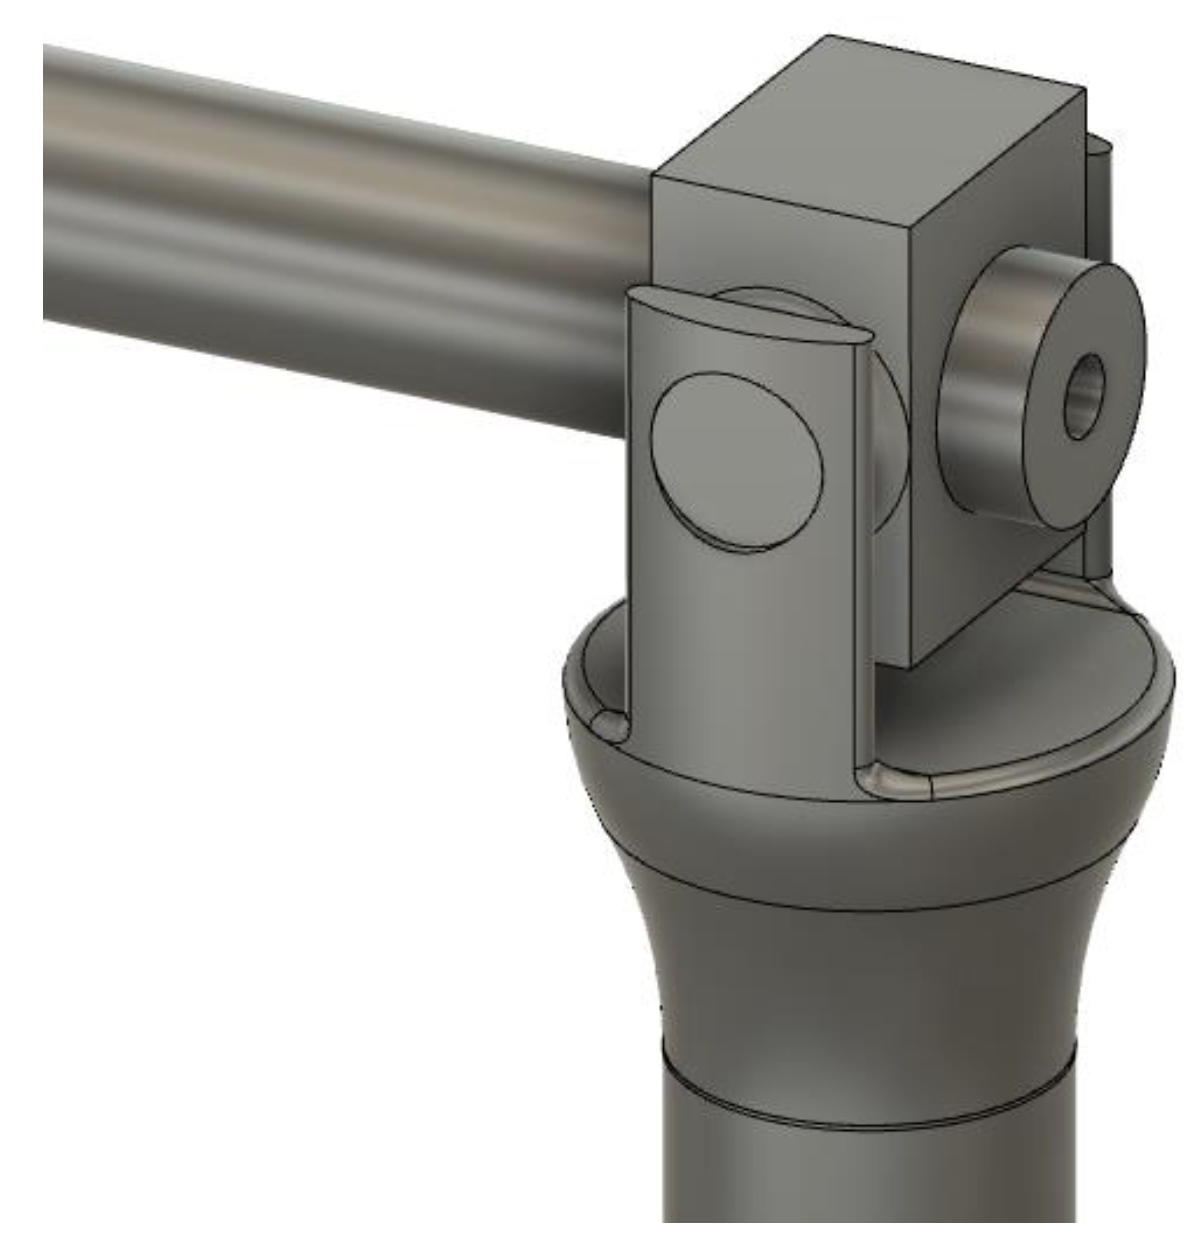
An accelerometer is attached to the post of the apparatus, and the motion measurement experiment of the apparatus is carried out. A load is applied to the center of the bar using a static load tester, and the value of the accelerometer at that time is measured.
The apparatus’s motion is reproduced on the analysis by using the measurement data.

2.2. Equipment

The specification of the horizontal bar is shown in Table 1. The specification of the accelerometer is shown in Table 2.
The experimental equipment and a system schematic diagram are shown in Figure 1 and Figure 2.
●Accelerometer

2.3. Results

Using the photographed image, the displacement of the bar in the experiment and the distance from the center position of the bar to the maximum deflection position are obtained.
The motion of the apparatus is reproduced on the analysis by using the measurement data. They are then compared and the reproducibility is evaluated.

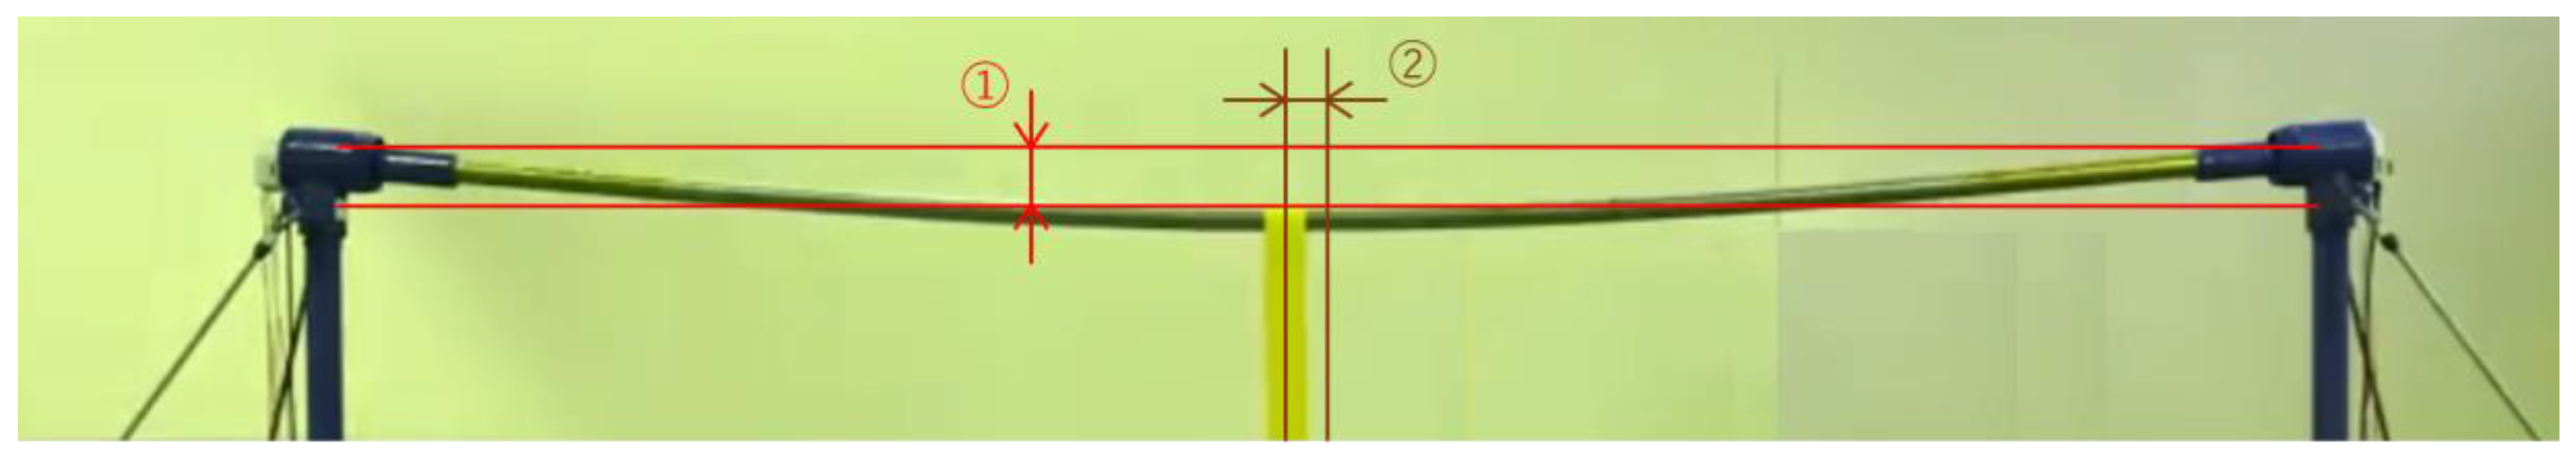
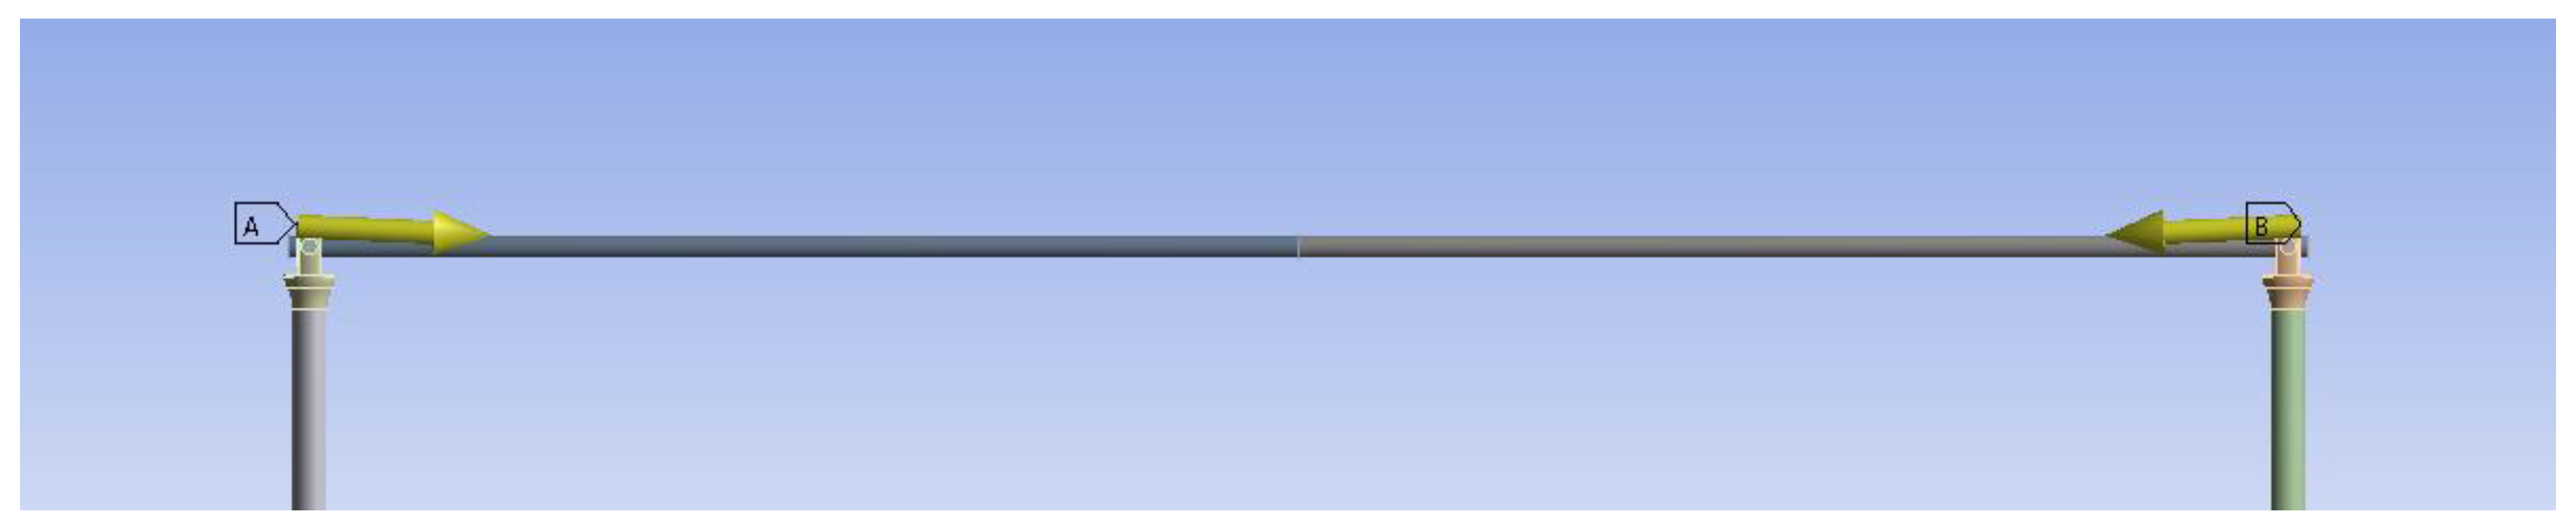
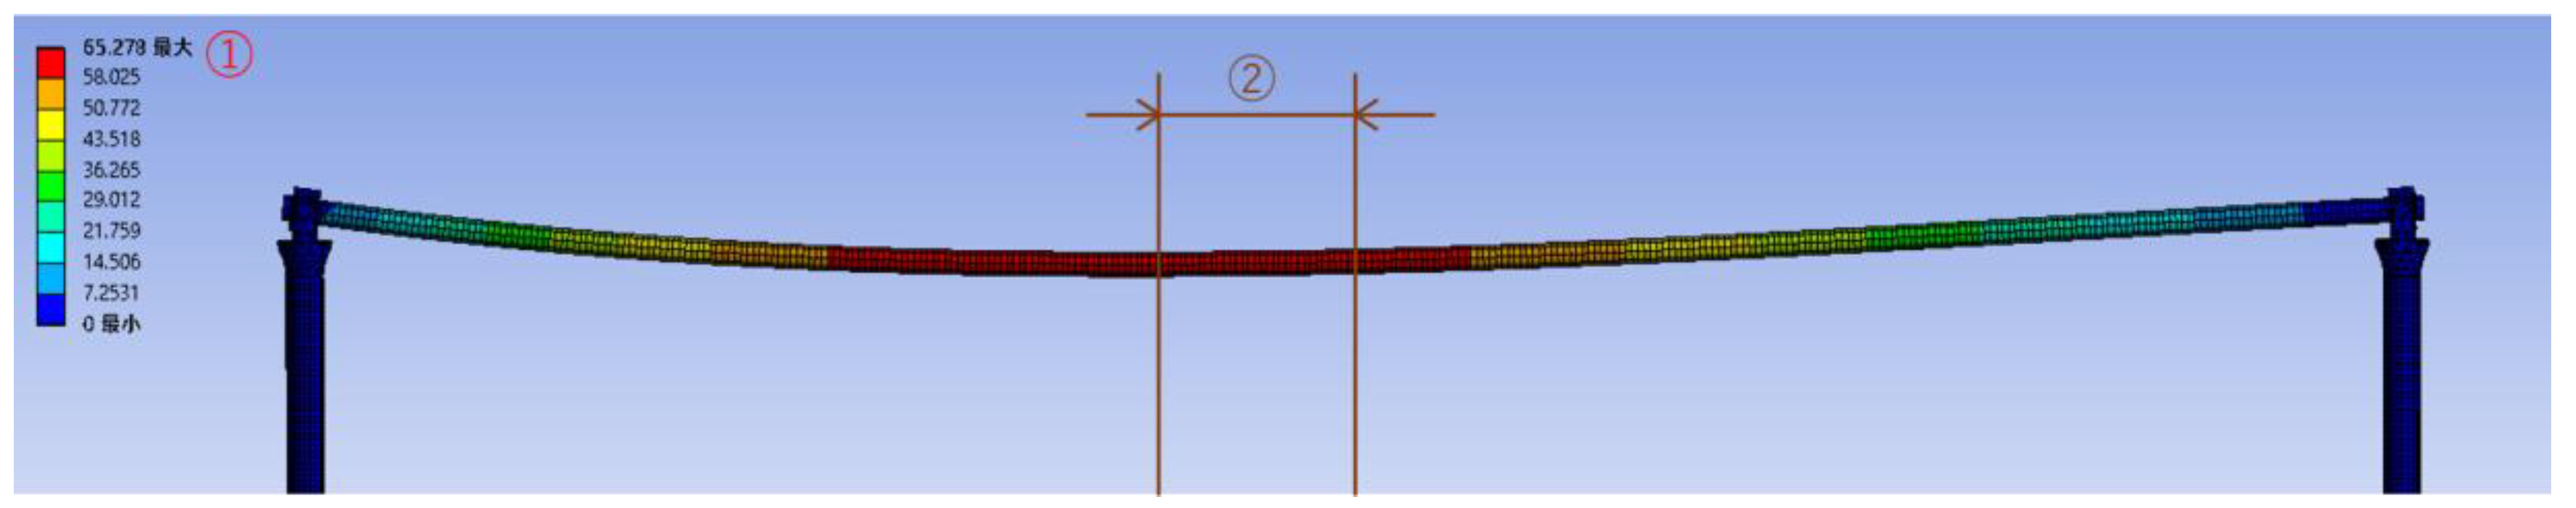
2.3.1. Static Load Experiment
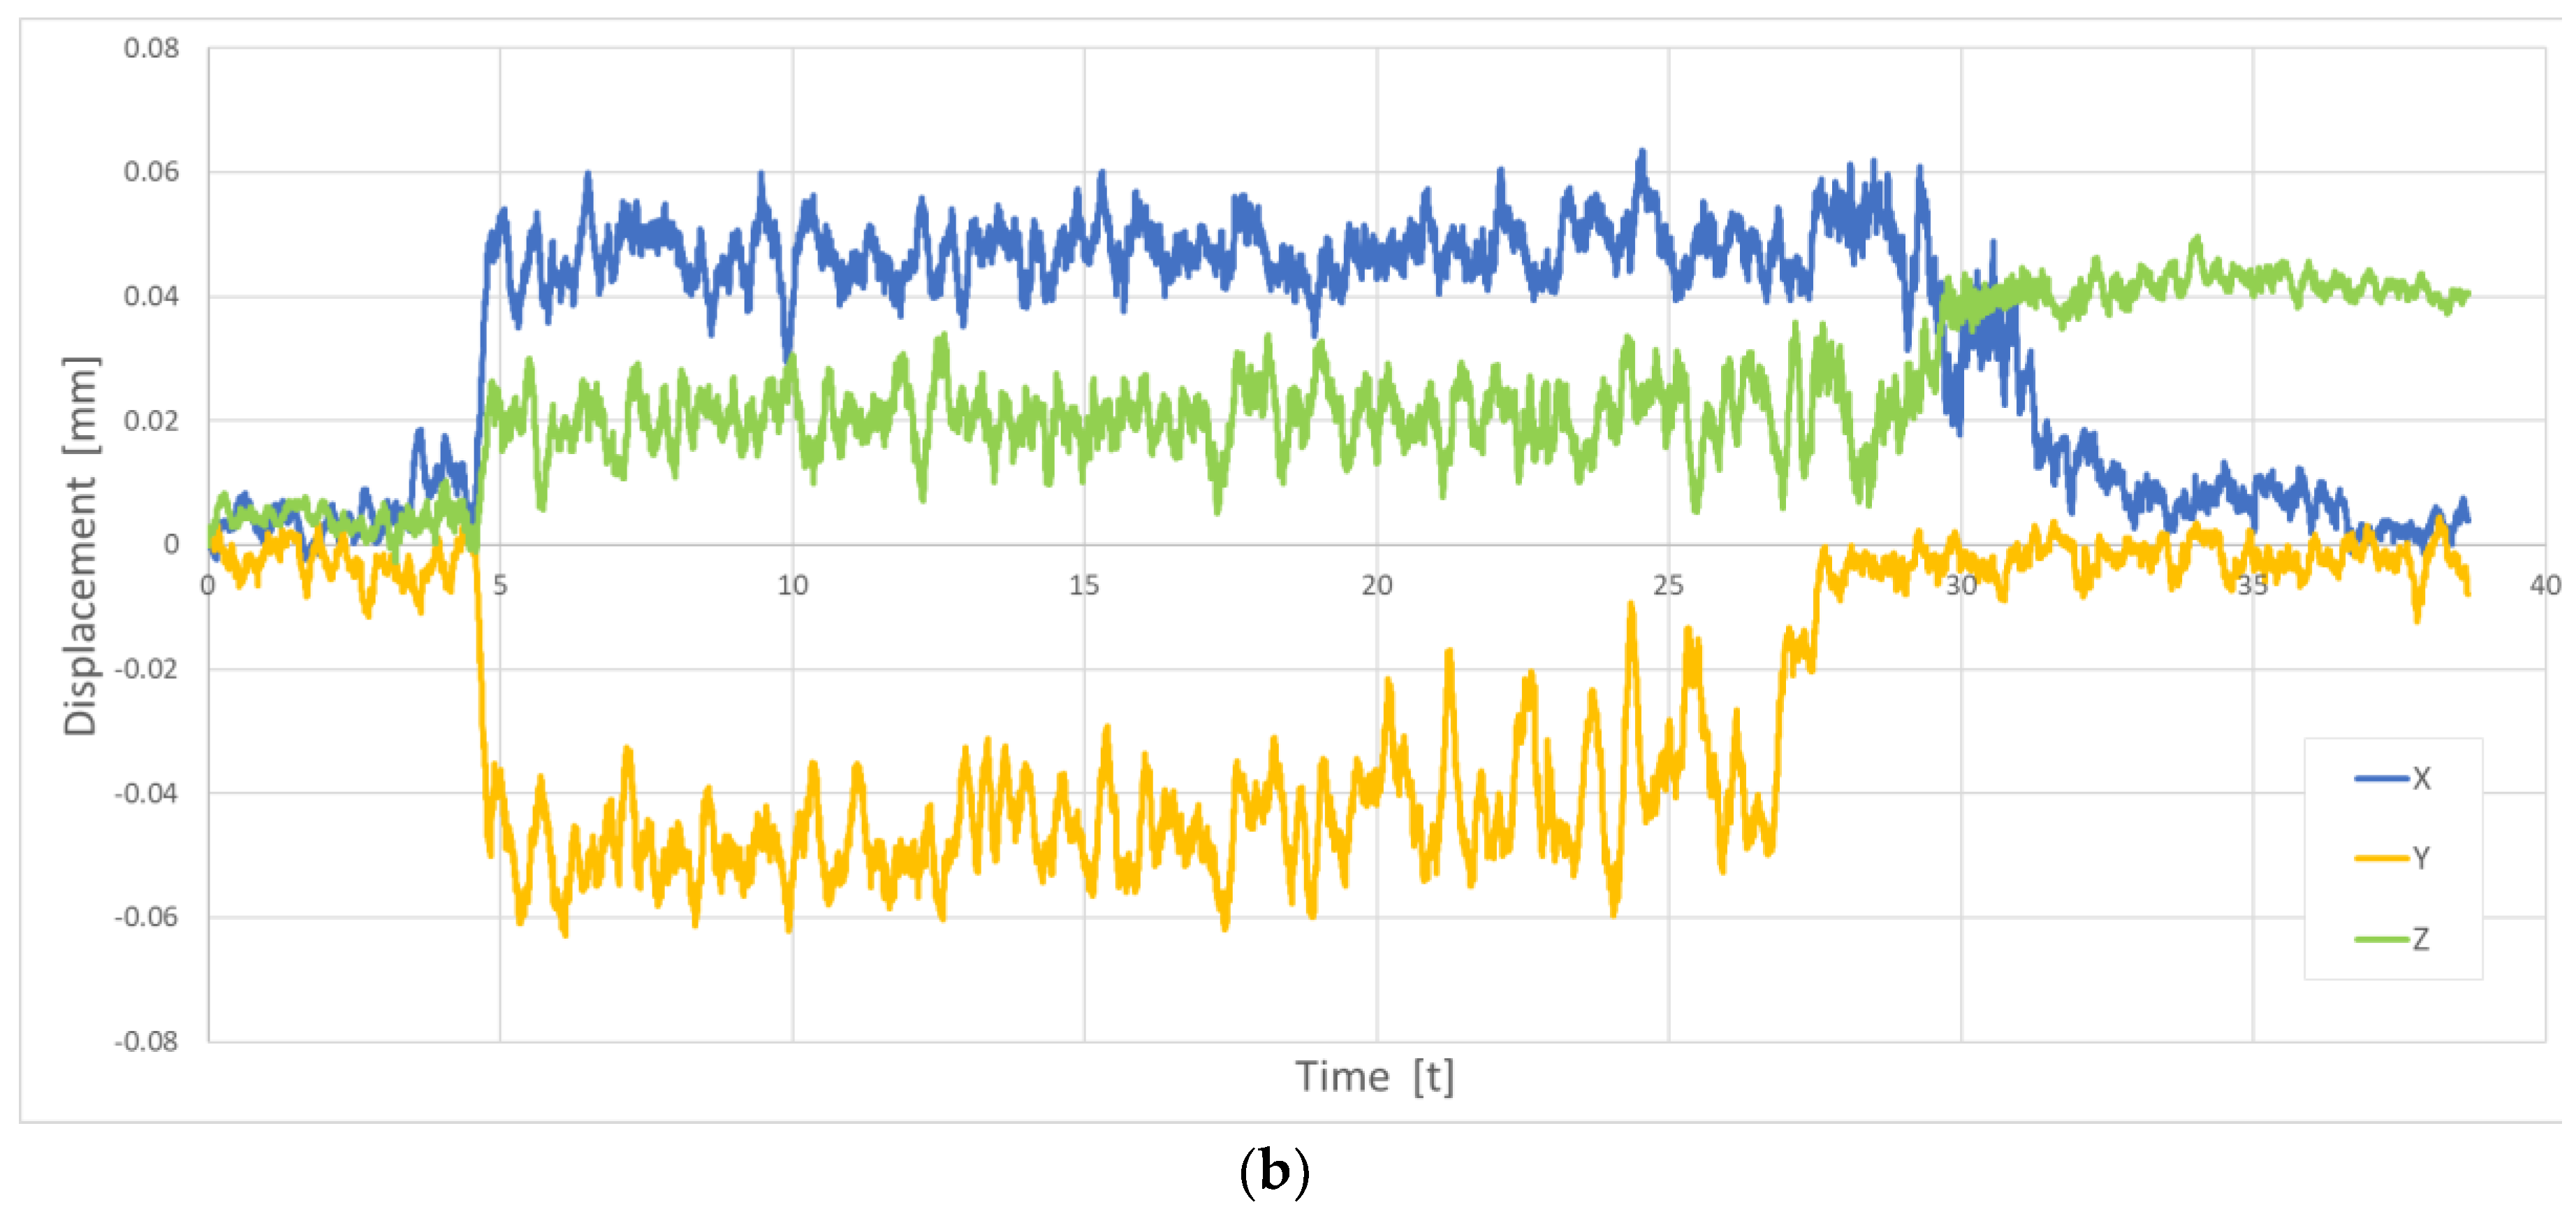
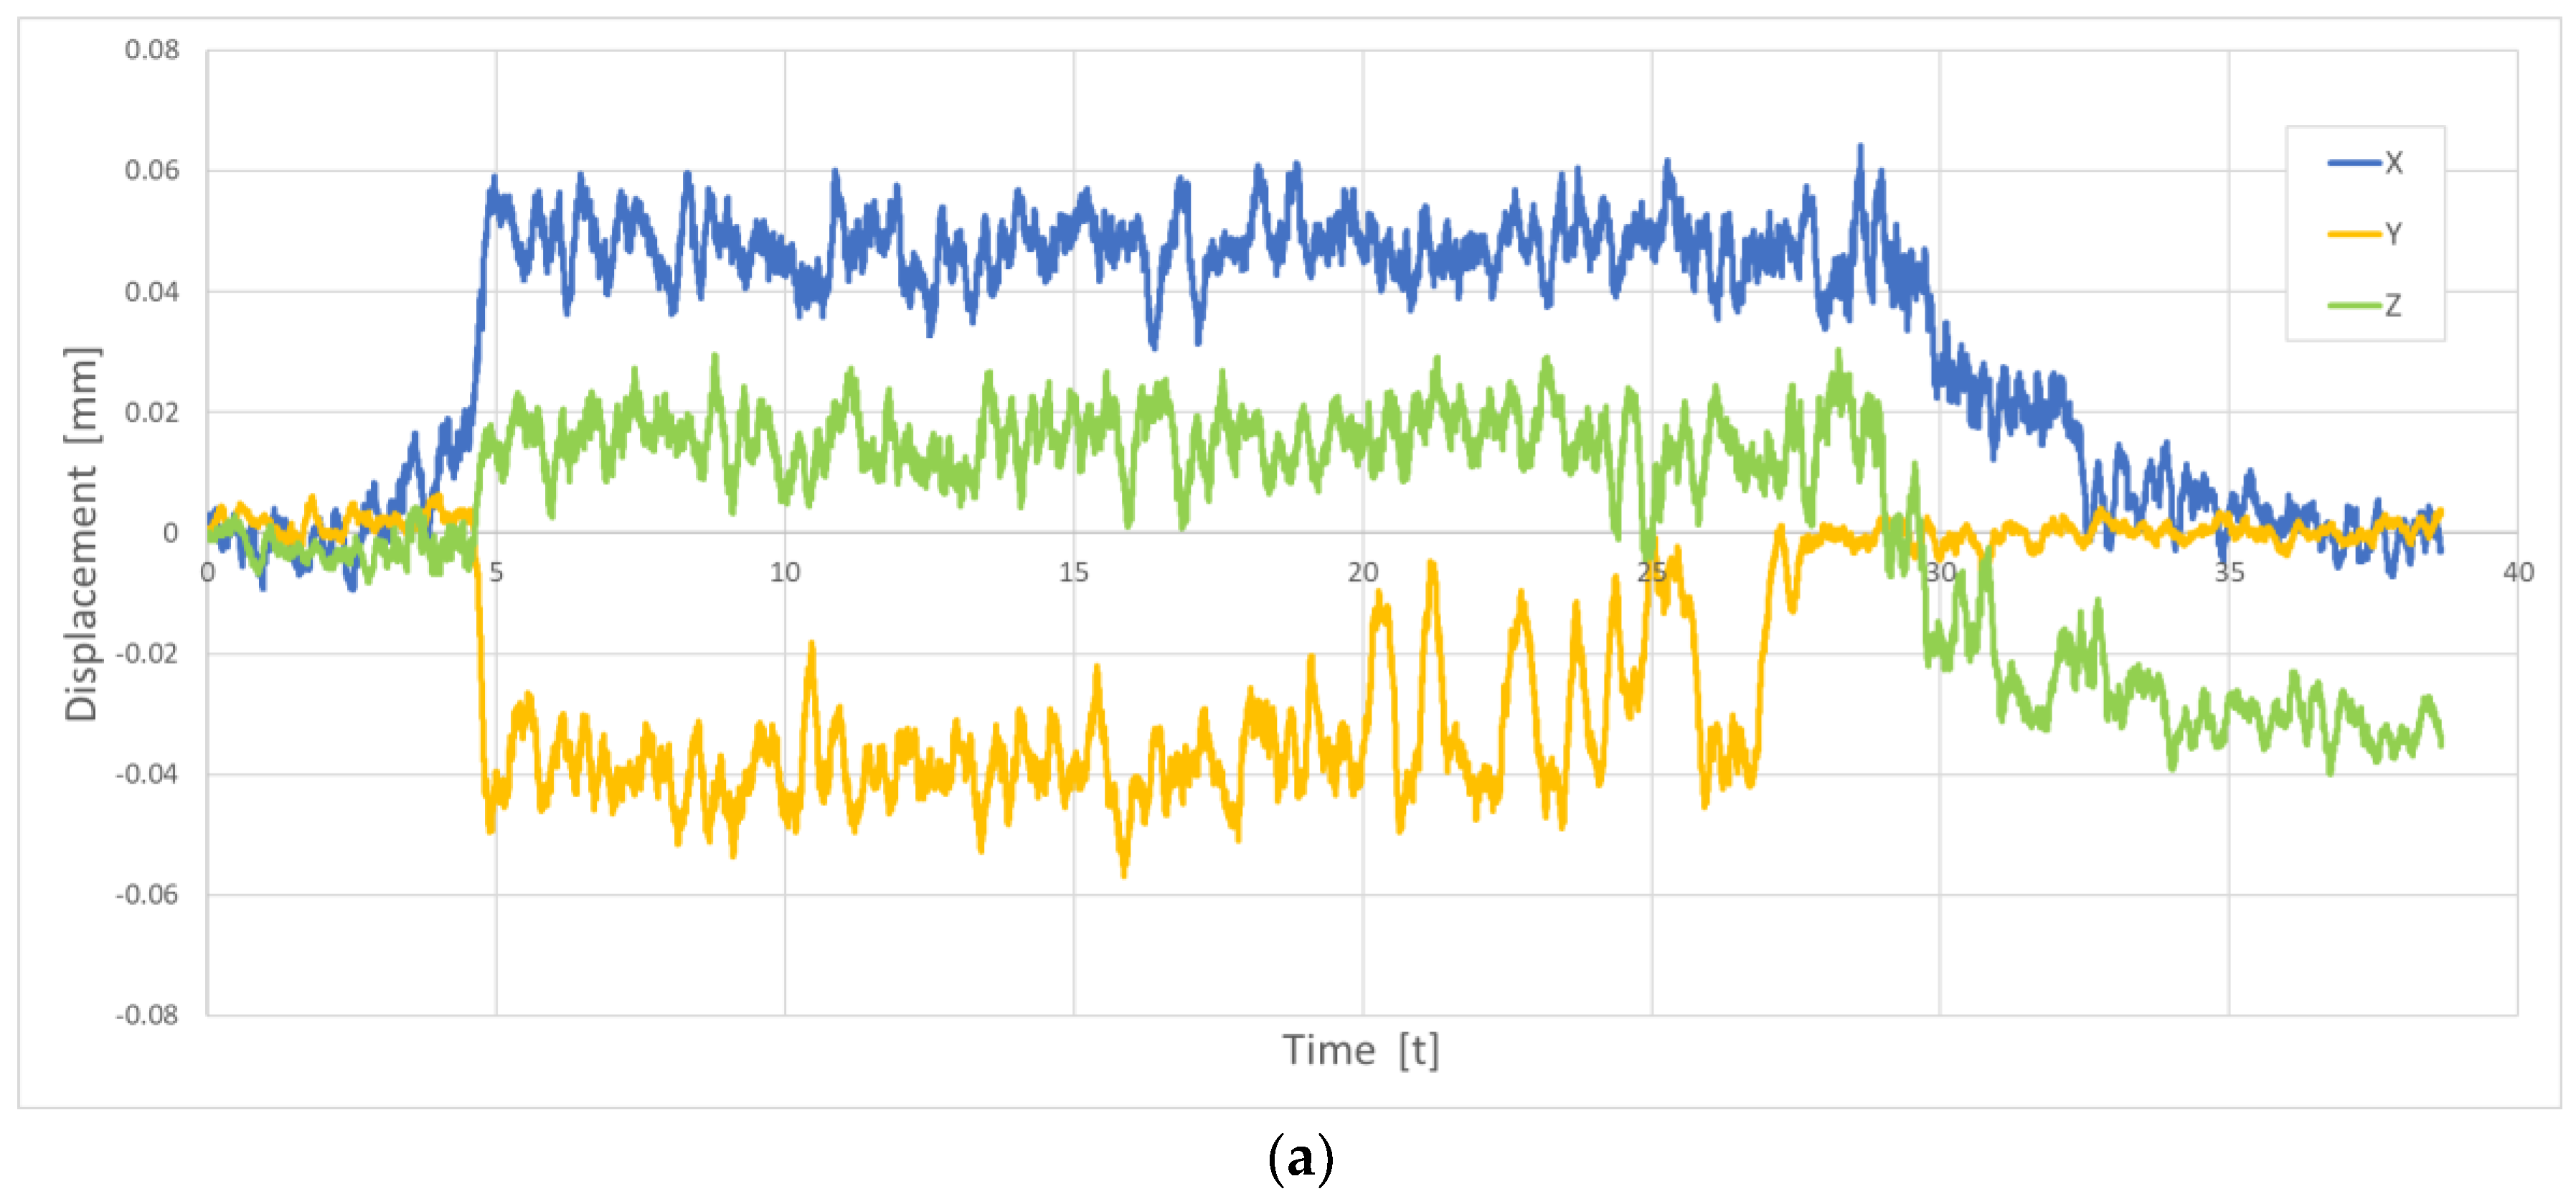
The image of the displacement of the bar in static load experiment is shown in Figure 3.
The position after the displacement is calculated by integrating the three-axis acceleration data obtained from the accelerometer with time.
The results were graphed, shown in Figure 4.
From Figure 4a,b, when the measurement start-time and the measurement end-time are compared, the displacement is hardly seen in the X and Y directions as compared with the Z direction. In the present experiment, it is considered probable that the displacement was not so great in the X direction because the load was applied directly downward. In addition, since the post does not easily shrink or buckle, the Y direction is not so displaced. In the Z direction, the left and right post ends are displaced inward. It can be seen that the post end was pulled inward by bending the central part of the bar. From these results, it can be seen that both end portions of the post are displaced inward and downward, and it can be said that the apparatus’s motion can be detected from the measurement data of the accelerometer. Since the value of the accelerometer changes greatly, especially while adjusting the belt length, the data of the accelerometer may become more effective for the dynamic load.

2.3.2. Analysis

A simple model was made to reproduce the apparatus’s motion and was analyzed.
The joint that allows rotation about the X axis was designed as shown in Figure 5, in order to freely change the angle of the bar end [3].
The displacement of the post end measured by the accelerometer is given to the analytical model [4].
The displacement given by the analysis is shown in Table 3, in Figure 6.
The analysis results are shown in Figure 7.
The displacement in the analysis was 65.278 mm, and the actual displacement was 68.75 mm. The error rate is 5.1%, and it can be said that the bar displacement can be reproduced only by the value of the accelerometer. Similar results were obtained under other experimental conditions. The maximum deflection position was qualitatively different between the experiment and the analysis, but the direction of the deviation was correct and the deviation of the load point could be obtained. By using this, it is considered that the position and direction of the force of the athlete can be known in detail. Players and coaches can use this to evaluate and improve their performance in terms of timing and intensity by comparing it to the success of their performance or the performance of top players.
From the above, it was shown that the measurement by the accelerometer was sufficiently effective for motion identification of the apparatus. However, in this experiment, the analytical model was designed for the experiment for the static load in the direct downward direction, so it was not examined whether this measurement method and analysis method are effective for the load in other directions. In order to improve the reproducibility, it is necessary to carry out similar experiments using loads in other directions and dynamic loads, and to examine analytical models and conditions repeatedly. In addition, this time, the consistency was evaluated based on the displacement of the bar and the maximum deflection position. However, since the post also swings greatly in actual competitions, it is necessary to understand and evaluate not only the strut end, but also the motion of the entire post, in more detail.

3. Conclusions

In the present experiment, the apparatus’s motion against static load was obtained as an inverse analysis by using a sensing system, and it was shown that motion identification could be performed. In the future, a dynamic load test will be conducted to verify whether motion identification of the apparatus can be performed in the same way.

References

  1. Díaz-Pereira, M.P.; Gómez-Conde, I.; Escalona, M.; Olivieri, D.N. Automatic recognition and scoring of olympic rhythmic gymnastics movements. Hum. Mov. Sci. 2014, 34, 63–80. [Google Scholar] [CrossRef] [PubMed]
  2. Goichi, B.; Toru, F.; Hiroyki, K. New: Mechanics of Materials (Japanese); Baifukan: Tokyo, Japan, 2010; pp. 75–117. [Google Scholar]
  3. Susumu, T.; Masayasu, K. Introduction to Strain Measurement with Strain Gauge (Japanese); Taiseisha: Tokyo, Japan, 2011; pp. 41–46. [Google Scholar]
  4. Yoshio, A.; Taisei, Y.; Akihisa, T.; Goichi, B. Application of Localized Flexibility Method to Detection of Loosing Part for Jointed Frame Structure. Trans. Jpn. Soc. Mech. Eng. Ser. A 2006, 72, 111–117. [Google Scholar]
Figure 1. Experimental equipment.
Proceedings 49 00120 g001
Figure 2. (a) system schematic diagram; (b) accelerometer unit [2].
Proceedings 49 00120 g002
Figure 3. Displacement of the bar. ① Displacement of the bar: 68.75 mm. ② Distance from the center position of the bar to the maximum deflection position: 53.06 mm.
Proceedings 49 00120 g003
Figure 4. (a) Displacement of the post end (left). (b) Displacement of the post end (right).
Proceedings 49 00120 g004aProceedings 49 00120 g004b
Figure 5. Joint parts of analytical model.
Proceedings 49 00120 g005
Figure 6. Analytical conditions.
Proceedings 49 00120 g006
Figure 7. Displacement of the bar on the analysis. ① Displacement of the bar on the analysis: 65.278 mm. ② Distance from the center position of the bar to the maximum deflection position: 229.36 mm.
Proceedings 49 00120 g007
Table 1. Specification of the horizontal bar.
BarInner diameter [m]9 × 10⁻³
Outside Diameter [m]28 × 10−3
Length [m]2.4
PostInner diameter [m]35.7 × 10⁻³
Outside Diameter [m]42.7 × 10⁻³
Length [m]2.8
Tension of rope [N]2750
Table 2. Specification of the accelerometer.
LSM6DS3
Frequency [Hz]500
Resolution [bit]16
Measuring range [g]±2
Table 3. Displacement of the strut end in each direction.
PostDisplacement [mm]
XYZ
A (left)0.0003−0.0016−0.0288
B (right)0.0002−0.00060.0374
Publisher’s Note: MDPI stays neutral with regard to jurisdictional claims in published maps and institutional affiliations.

