Smartphone Mode Recognition During Stairs Motion †


Abstract
:1. Introduction
2. Methodology
2.1. Problem Formulation
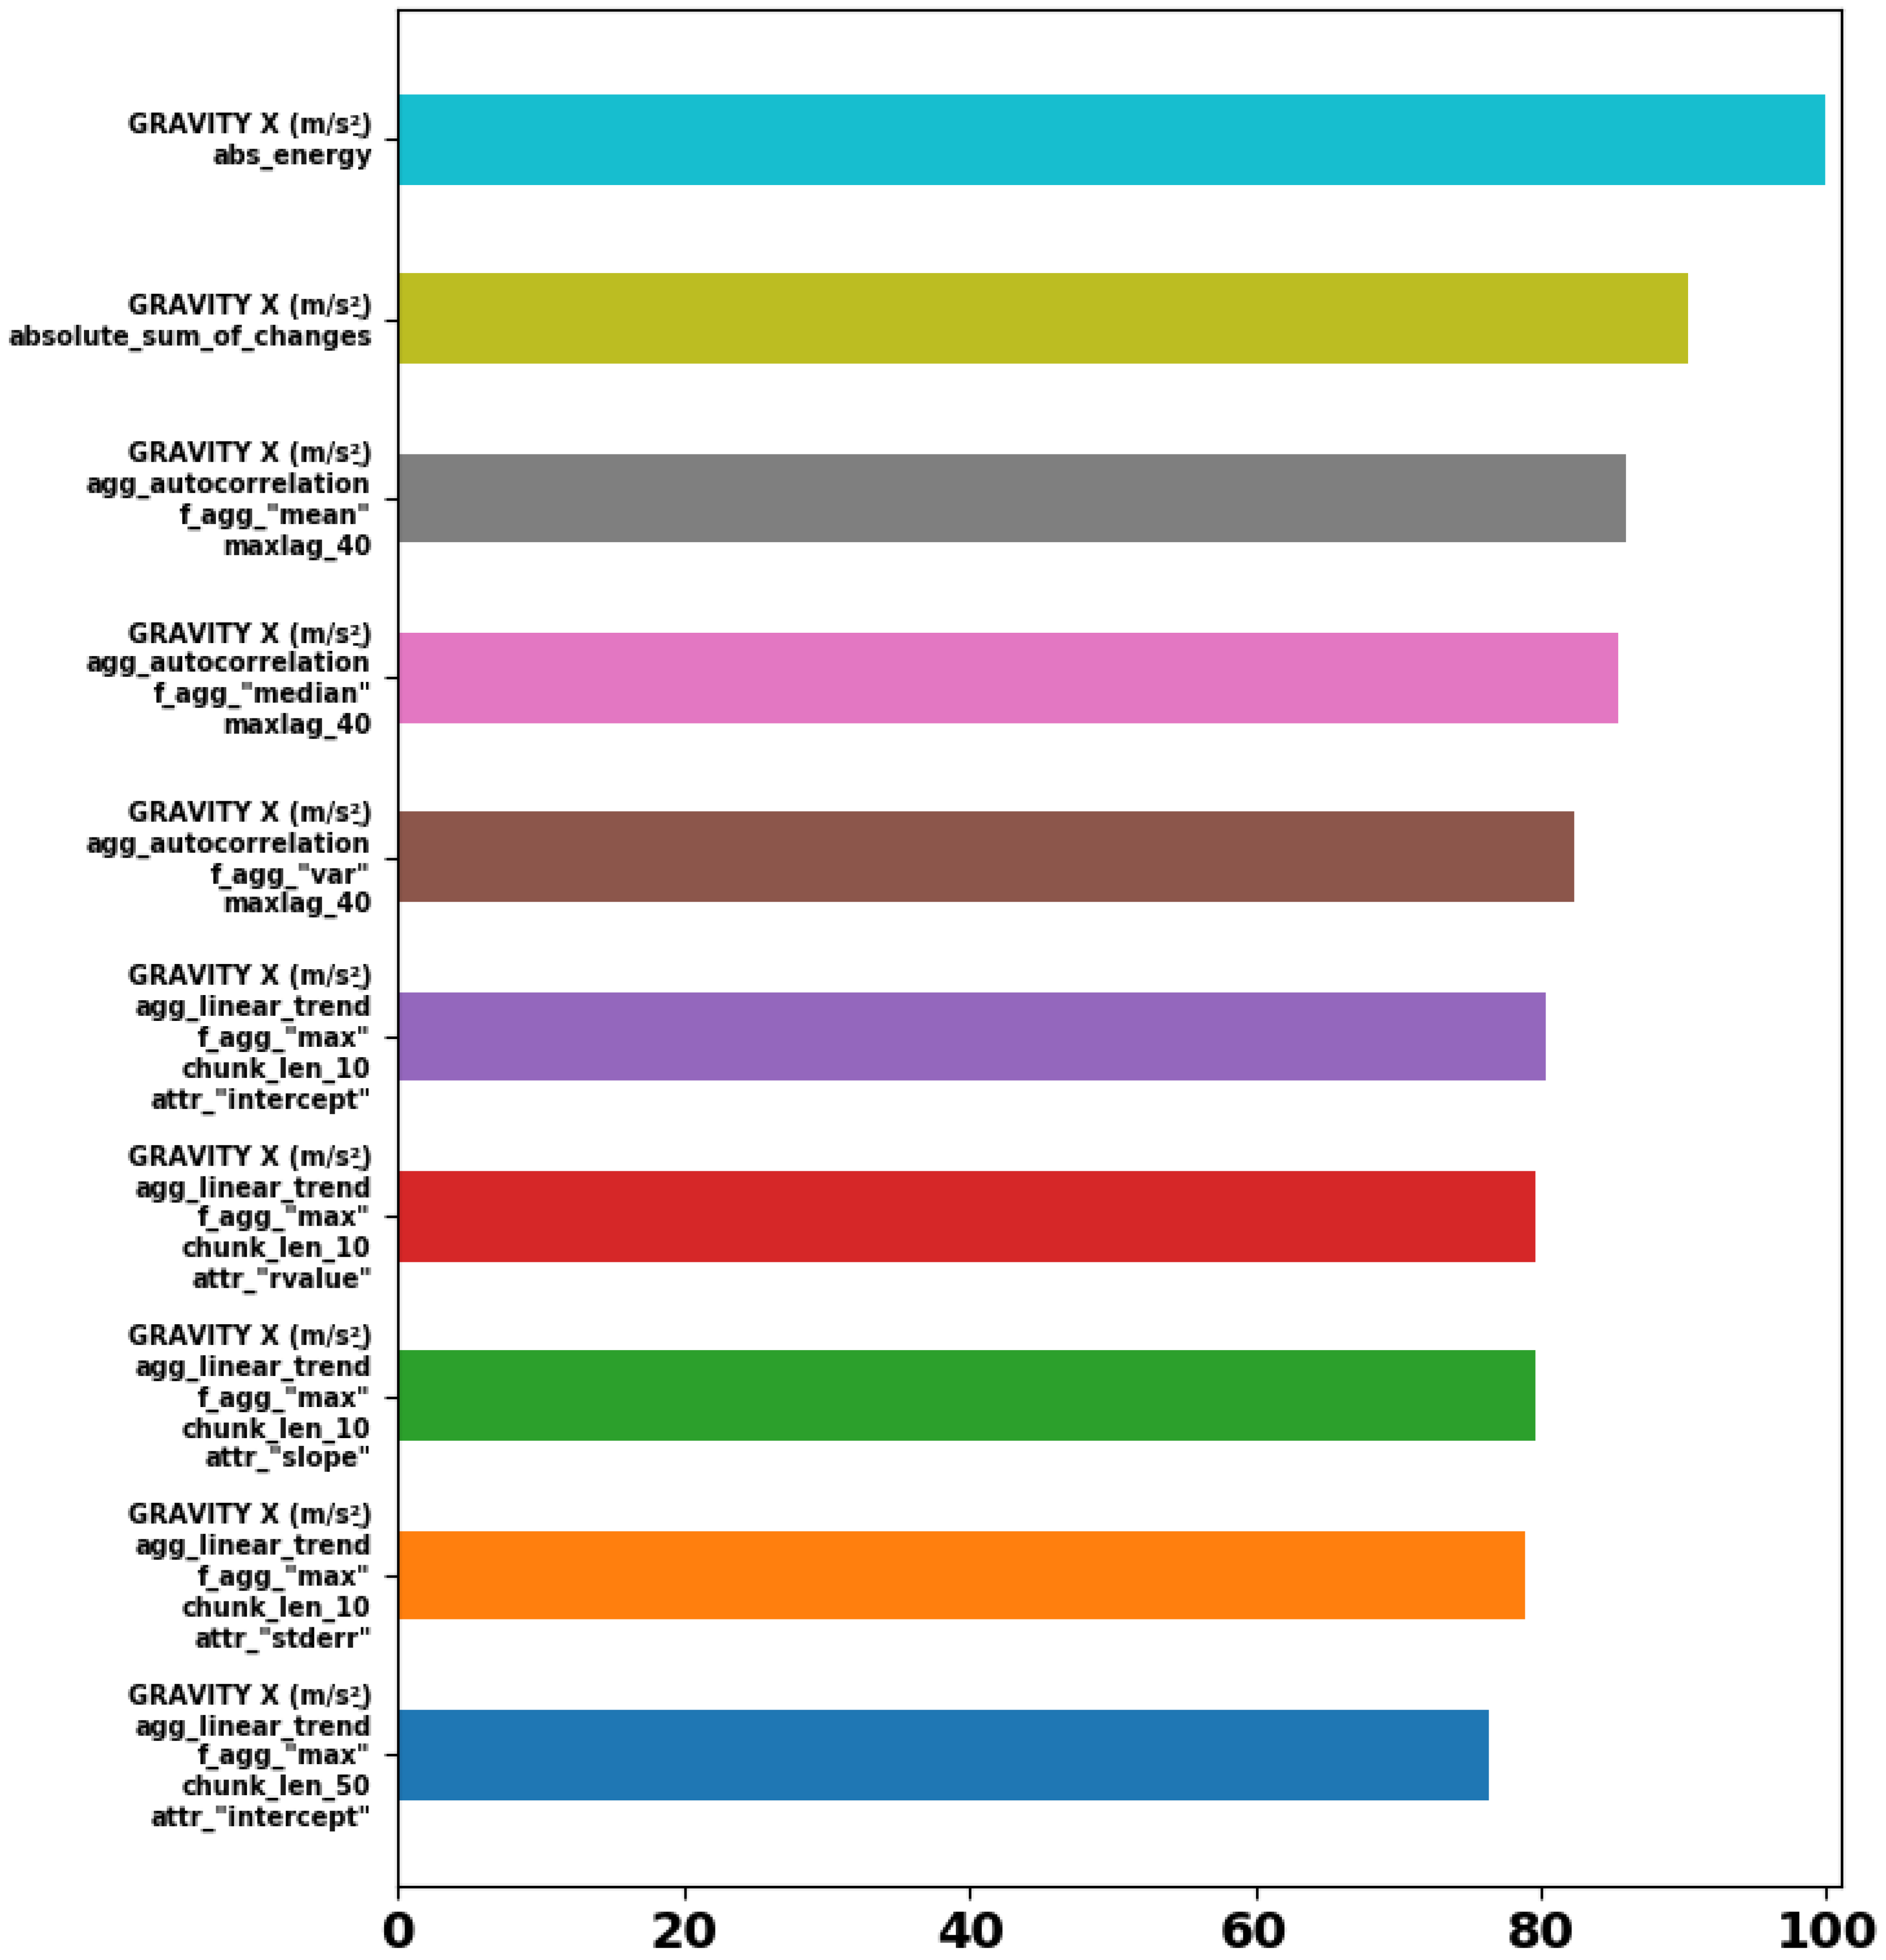
2.2. Feature Extraction
- Statistical features: Will be calculated by executing statistic analysis on each vector. Examples: Mean, standard deviation, median, max, min, bias, etc.
- Time features: Will be calculated by counting and searching for specific conditions on the data points in the vector. Examples: Peaks count, mean/median crossing, amount of similar argument, zeros count, etc.
- Frequency features: Statistical and counting features above calculating the absolute value and the angle of a Fourier transform that been executed in each time window.
- Cross measurements features: Statistical and counting features above calculating the magnitude () of three axes measurements, i.e., acceleration measurements, gyroscope measurements, and magnetic field measurements.
2.3. Classification
3. Setup and Results
3.1. Data Collection and Processing
3.2. Classification Process
4. Conclusions
Funding
Conflicts of Interest
References
- Klein, I.; Solaz, Y.; Ohayon, G. Pedestrian Dead Reckoning with Smartphone Mode Recognition. IEEE Sensors J. 2018, 18, 7577–7584. [Google Scholar] [CrossRef]
- Klein, I.; Solaz, Y.; Ohayon, G. Smartphone Motion Mode Recognition. Proceedings 2017, 2, 145. [Google Scholar]
- Rinaldi, S.; Depari, A.; Flammini, A.; Vezzoli, A. Integrating Remote Sensors in a Smartphone: The project `Sensors for ANDROID in Embedded systems’. In Proceedings of the 2016 IEEE Sensors Applications Symposium, Catania, Italy, 20–22 April 2016; pp. 1–6. [Google Scholar]
- Christ, M.; Braun, N.; Neuffer, J.; Kempa-liehr, A.W. Neurocomputing Time Series FeatuRe Extraction on basis of Scalable Hypothesis tests (tsfresh—A Python package). Neurocomputing 2018, 307, 72–77. [Google Scholar] [CrossRef]
- Guyon, I. An Introduction to Variable and Feature Selection 1 Introduction. J. Mach. Learn. Res. 2003, 3, 1157–1182. [Google Scholar]
- Zeng, Y.; Wang, B.; Zhao, L.; Yang, Y. The extended nearest neighbor classification. In Proceedings of the 27th Chinese Control Conference (CCC), Kunming, China, 16–18 July 2008; pp. 559–563. [Google Scholar]
- Kamiński, B.; Jakubczyk, M.; Szufel, P. A framework for sensitivity analysis of decision trees. Cent. Eur. J. Oper. Res. 2018, 26, 135–159. [Google Scholar] [CrossRef] [PubMed]
- Liaw, A.; Wiener, M. Classification and Regression by randomForest. R News 2002, 2, 18–22. [Google Scholar]
- Chen, T.; Guestrin, C. Diagnosis of tuberculosis–newer tests. XGBoost: A Scalable Tree Boosting System; ACM: New York, NY, USA, 2016; p. 10. [Google Scholar]
- Khan, I.; Khusro, S.; Ali, S.; Ahmad, J. Sensors are Power Hungry: An Investigation of Smartphone Sensors Impact on Battery Power from Lifelogging Perspective. Bahria Univ. J. Inf. Commun. Technol. 2016, 9. [Google Scholar]
- Horvath, Z.; Jenak, H. Battery consumption of smartphone sensors. In Proceedings of the 11th International Conference on Signal-Image Technology & Internet-Based Systems (SITIS), Bangkok, Thailand, 23–27 November 2015; pp. 48–52. [Google Scholar]


| Upstairs | Downstairs | |||||
|---|---|---|---|---|---|---|
| Description | Label | Minutes | Time Windows | Label | Minutes | Time Windows |
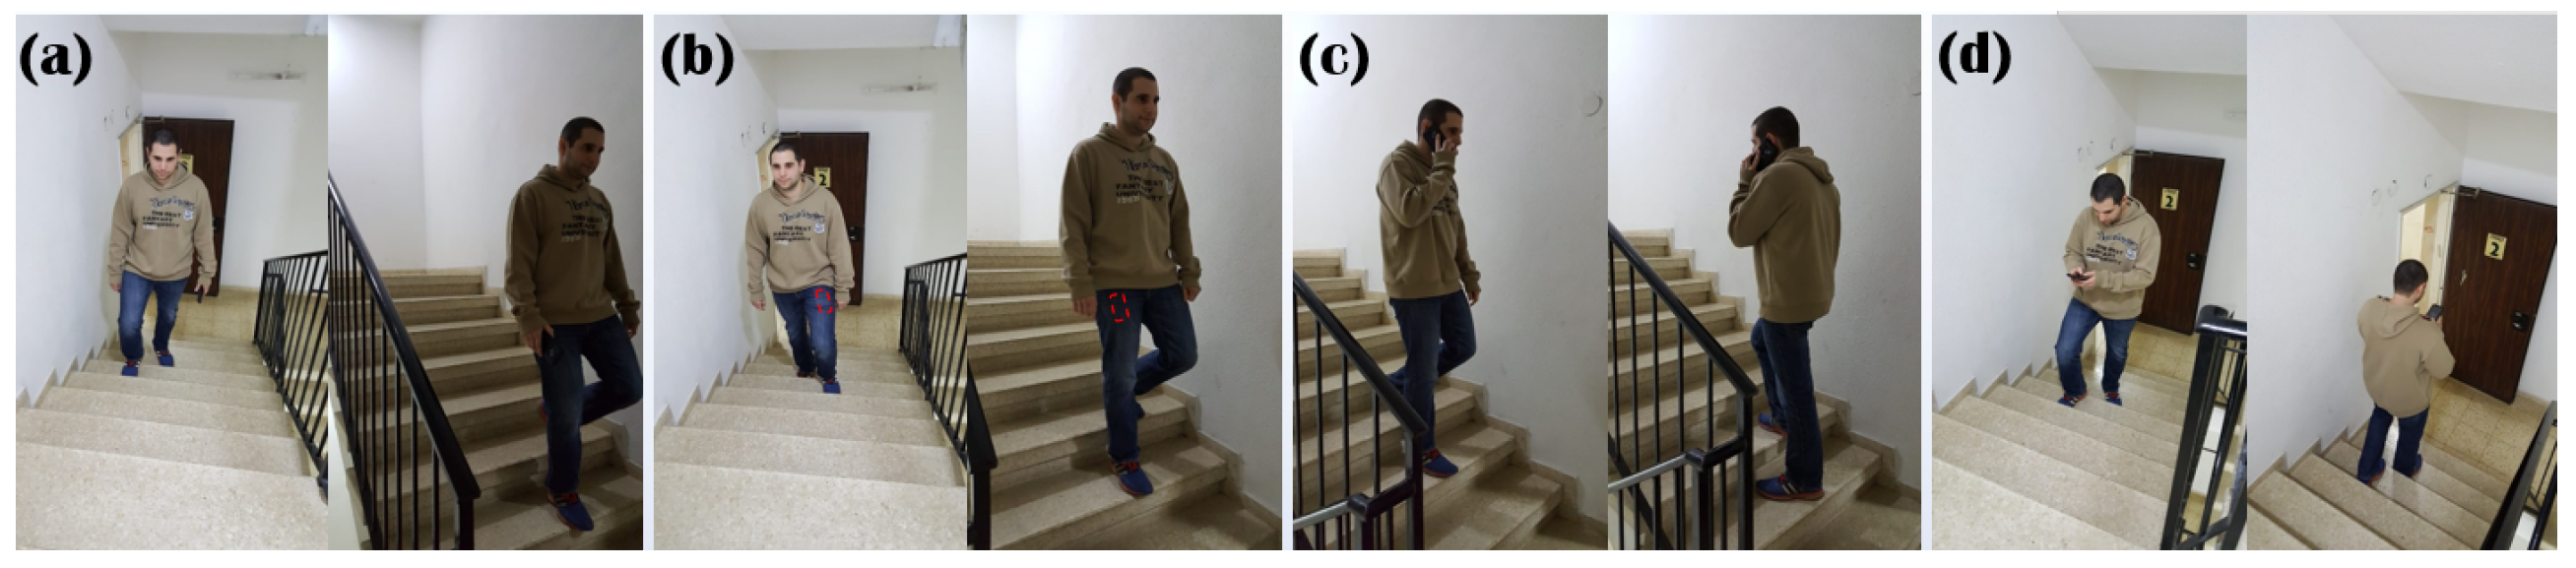
| Phone in hand | 1 | 896 | 2 | 669 | ||
| Phone in pocket | 3 | 736 | 4 | 652 | ||
| Talking on the phone | 5 | 580 | 6 | 653 | ||
| Texting | 7 | 768 | 8 | 668 | ||
| All labels | - | 2980 | - | 2642 | ||
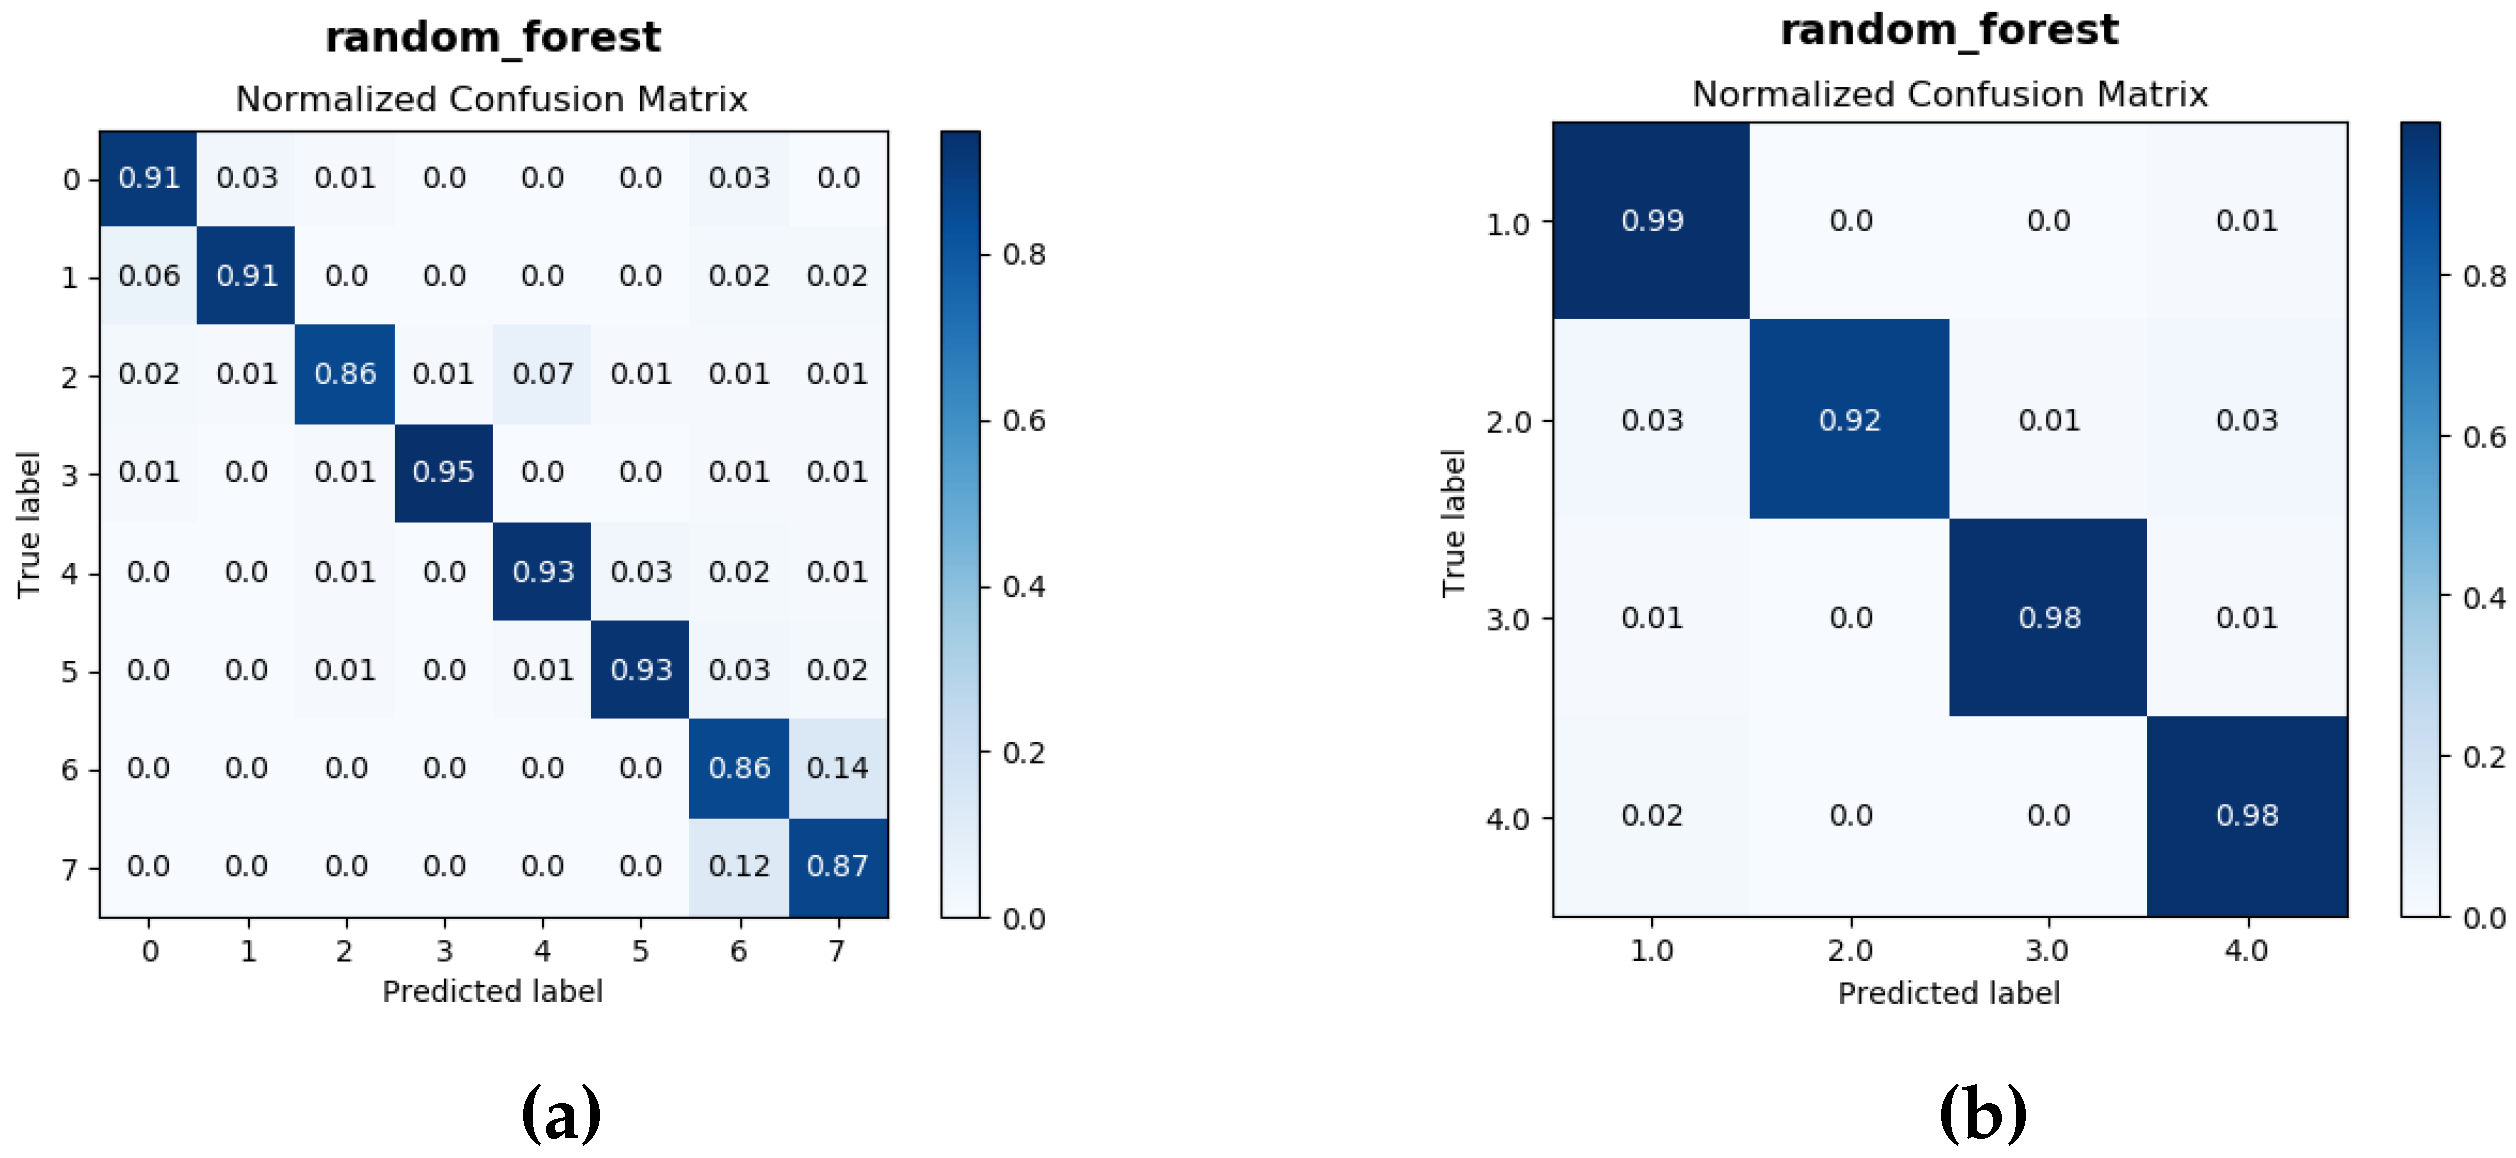
| Classifier | Accuracy [%] - with Up Down Division (8 labels) | Accuracy [%] - Main Modes (4 labels) |
|---|---|---|
| KNN | 74.83 | 92.16 |
| Decision Tree | 78.61 | 90.90 |
| Random Forest | 90.25 | 96.75 |
| XGBoost | 90.22 | 95.74 |
Publisher’s Note: MDPI stays neutral with regard to jurisdictional claims in published maps and institutional affiliations. |
© 2019 by the authors. Licensee MDPI, Basel, Switzerland. This article is an open access article distributed under the terms and conditions of the Creative Commons Attribution (CC BY) license (https://creativecommons.org/licenses/by/4.0/).
Share and Cite
Noy, L.; Bernard, N.; Klein, I. Smartphone Mode Recognition During Stairs Motion. Proceedings 2020, 42, 65. https://doi.org/10.3390/ecsa-6-06572
Noy L, Bernard N, Klein I. Smartphone Mode Recognition During Stairs Motion. Proceedings. 2020; 42(1):65. https://doi.org/10.3390/ecsa-6-06572
Chicago/Turabian StyleNoy, Lioz, Nir Bernard, and Itzik Klein. 2020. "Smartphone Mode Recognition During Stairs Motion" Proceedings 42, no. 1: 65. https://doi.org/10.3390/ecsa-6-06572
APA StyleNoy, L., Bernard, N., & Klein, I. (2020). Smartphone Mode Recognition During Stairs Motion. Proceedings, 42(1), 65. https://doi.org/10.3390/ecsa-6-06572