Proceeding Paper

Characterization of a WASN-Based Urban Acoustic Dataset for the Dynamic Mapping of Road Traffic Noise †

GTM—Grup de Recerca en Tecnologies Mèdia, La Salle—Universitat Ramon Llull, Quatre Camins, 30, 08022 Barcelona, Spain
*
Author to whom correspondence should be addressed.
Presented at the 6th International Electronic Conference on Sensors and Applications, 15–30 November 2019; Available online:https://ecsa-6.sciforum.net/
Proceedings 2020, 42(1), 60; https://doi.org/10.3390/ecsa-6-06637
Published: 21 April 2020

Abstract

:
Road Traffic Noise (RTN) is one of the main pollutants in urban and suburban areas, negatively affecting the quality of life of their inhabitants. In the context of the European LIFE DYNAMAP project, two Wireless Acoustic Sensor Networks (WASN) have been deployed to monitor RTN: one in District 9 of Milan, and another along the A90 motorway of Rome. Since the dynamic mapping system should be able to identify and remove those Anomalous Noise Events (ANEs) unrelated to regular road traffic (e.g., sirens, horns, speech, and doors), an Anomalous Noise Event Detector (ANED) has been included in the dynamic noise mapping pipeline to avoid biasing the computation of the equivalent RTN levels. After deploying the 24 low-cost acoustic sensor networks in both pilot areas, WASN-based acoustic datasets were built to adapt the previous version of the ANED algorithm to run in real-operation conditions. In this work, we describe the preliminary results of the analysis of the 154 h WASN-based urban acoustic dataset obtained from the Milan city in terms of the main characteristics of ANEs. The results confirm the unbalanced nature of the problem (83.7% of the data corresponds to RTN), showing the urban WASN-based dataset a larger number of ANEs with higher local predominance than what was observed in the previous expert-based recording campaign, which underlines the importance of the accurate modeling of the urban acoustic environment to train the ANED properly.

1. Introduction

It has been stated that noise pollution, mostly caused by traffic, is one of the main environmental pollutants in urban and suburban areas [1,2]. Road Traffic Noise (RTN) affects the quality of life of citizens negatively, provoking several health-related problems (e.g., see [3,4,5]). The European Noise Directive 2002/49/EC (END) [6] and the consequent definition of the Common Noise Assessment Methods in Europe (CNOSSOS-EU) [7,8] were defined in order to address this issue in an harmonized manner at the European level. Among the different requirements embodied in these regulations, the European member states are asked to tailor noise maps of specific areas of interest (e.g., agglomerations with +100.000 inhabitants and major infrastructures) every five years. The generation of noise maps has been typically tackled by means of precomputed acoustic models fed by representative acoustic data collected using certified sound level meters handled by experts [9]. However, some recent technological advances have allowed for the development of alternative approaches. The combination of the Internet of Things (IoT) paradigm together with the development of low-cost acoustic sensors has led to the rise of the so-called Wireless Acoustic Sensor Networks (WASNs), enabling the setting up IoT-based ubiquitous environmental noise monitoring in urban and suburban areas (see [10] for a recent review of the state-of-the art about this topic of research).
In the context of the European LIFE DYNAMAP project [11], a WASN-based dynamic noise mapping system has been designed and developed to determine the acoustic impact of road infrastructures. To this aim, the project has recently deployed two low-cost WASNs in the following pilot areas [12,13]: one in District 9 of Milan as an urban area, and another in the A90 motorway surrounding Rome as a suburban area. Since the goal of the project is to monitor only RTN levels in real time, the system is asked to automatically identify and remove those Anomalous Noise Events (ANEs) unrelated to regular road traffic (e.g., sirens, horns, speech, and doors) from the noise levels computation, following the specifications of the END [6]. For that purpose, an Anomalous Noise Event Detector (ANED) [14] has been included in the dynamic noise monitoring pipeline to avoid biasing the computation of the A-weighted equivalent road traffic noise levels ( L A e q ) of the area of interest due to the presence of ANEs. The ANED has been designed as a two-class classifier (RTN vs. ANE) to run in real time in the low-cost acoustic sensors of both WASNs.
Although the ANED algorithm has been trained and improved several times with different types of representative acoustic data [15], the recent deployment of the WASNs in the pilot areas has provided the possibility to collect acoustic data through the 24 low-cost acoustic sensors installed in their final locations. Taking advantage of this fact, a new dataset has been built so as to improve the ANED algorithm with respect to the previous implementation based on preliminary manual recordings [14]. As in the WASN-based suburban dataset (see [16] for further details), the WASN-based urban dataset includes data from weekdays and weekends, and environmental noise samples from the definitive location of the sensors in real-operation. In the previous recordings in District 9 of Milan [17], the audio was recorded using a tripod placed on the street instead of the façades, where the low-cost sensors have been finally placed (see Figure 1). In this work, we describe the preliminary results of the analysis of the 154 h WASN-based urban acoustic dataset from the Milan area in terms of the main characteristics of the collected ANEs, comparing them to what was observed in the previous manual-based recording campaign.
Section 2 is devoted to describe the WASN-based urban acoustic dataset, including the WASN configuration, the recording and labeling processes, and the description of the main characteristics of the collected ANEs. In Section 3, several relevant aspects of the generated database are discussed, before describing main conclusions of this work together with the future research goals.

2. Development of the WASN-Based Urban Acoustic Dataset

In this section, we describe the process followed to create the urban acoustic dataset using the low-cost acoustic sensors of the WASN in Milan, together with the analysis of its main characteristics.

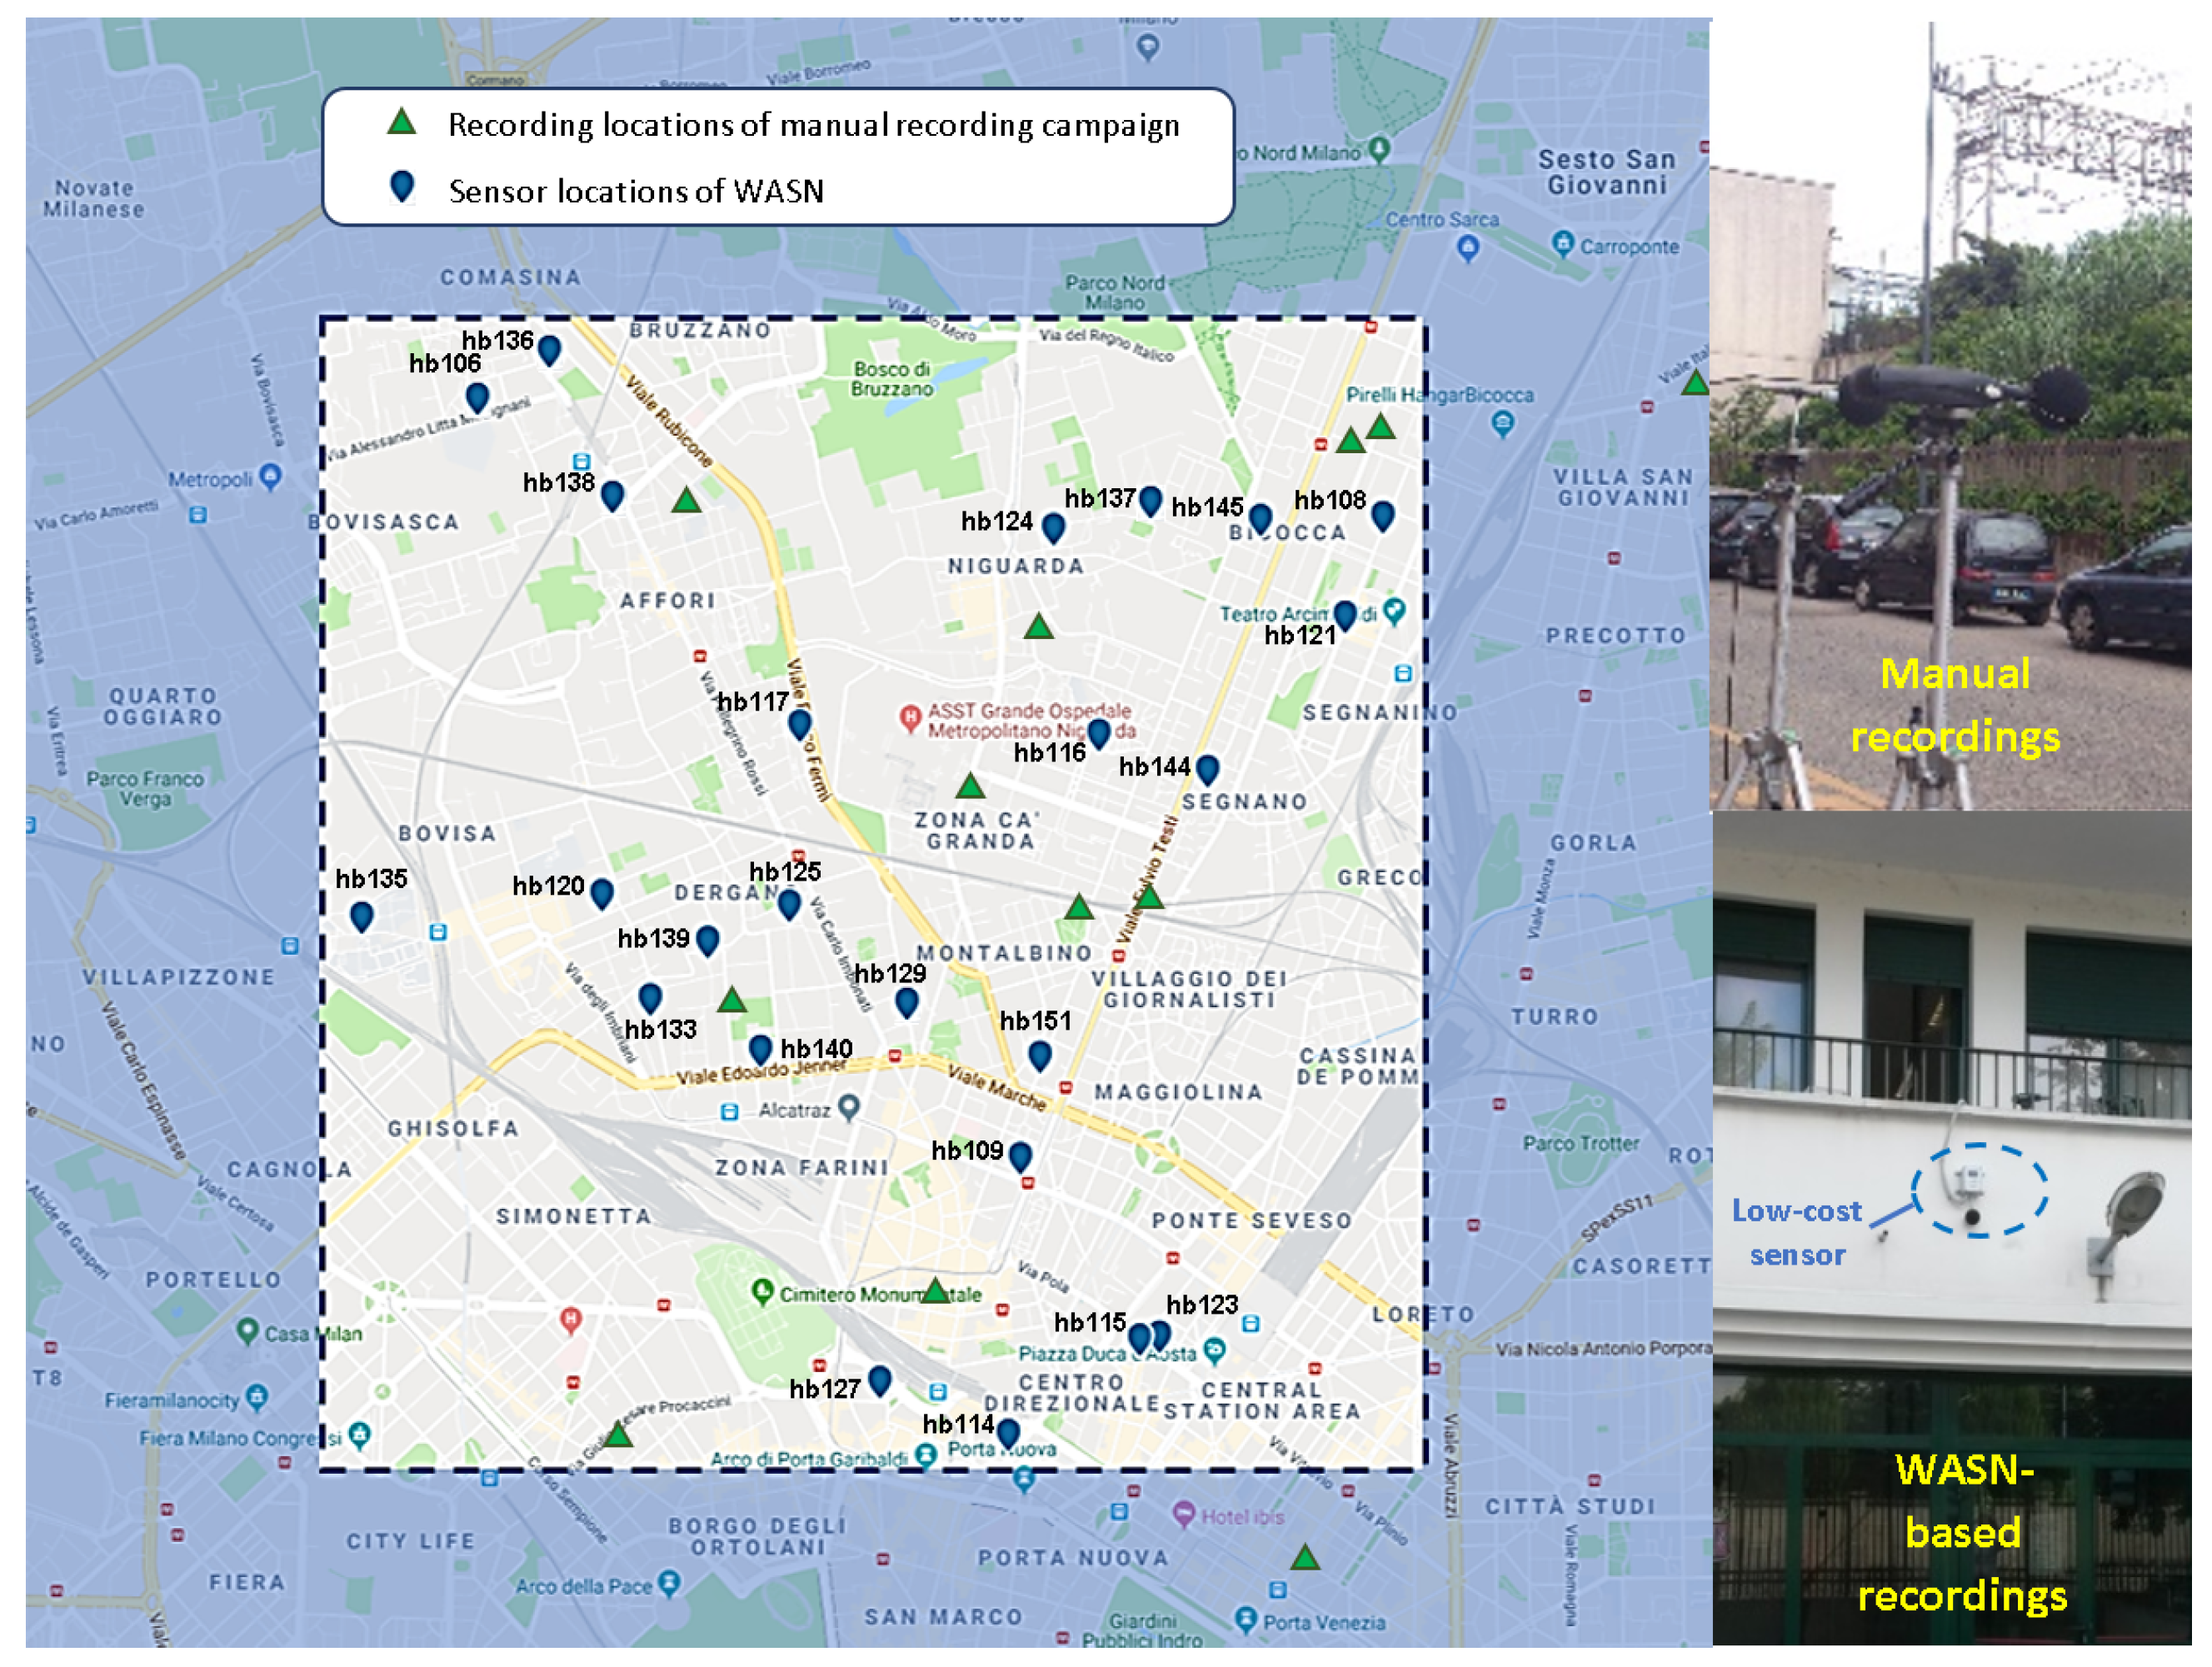
2.1. WASN Configuration and Recordings Methodology

Figure 1 shows the location of the 24 low-cost sensors of the WASN deployed in the urban area of Milan (District 9) together with locations considered for the previous manual recording campaign, which did not coincide in the final sensors positions since they were not planned during early stages of the DYNAMAP project.
Two days of the same week were sensed through the urban WASN, in order to capture traffic noise and anomalous noise examples in two different traffic conditions: one week day (Tuesday, November 28, 2017) and one weekend day (Saturday, December 2, 2017). The acoustic data were recorded in continuous audio clips from the first 20 min of each hour (considering a sampling frequency of 48 kHz), during 11 pre-selected hours in the week day (02:00, 03:00, 05:00, 08:00, 09:00, 11:00, 14:00, 15:00, 17:00, 20:00, and 23:00) and at 9 different hours in the weekend day (02:00, 05:00, 08:00, 11:00, 14:00, 17:00, 20:00, 21:00, and 23:00). The recordings were obtained from all 24 sensors of the network. However, 4 out of the 24 sensors gathered a different amount from what was initially expected due to some operational problems. In this sense, it is worth mentioning that (i) Sensor hb114 registered only 7 periods (03:00, 05:00, 06:00, 08:00, 11:00, 15:00, and 18:00); (ii) Sensor hb116 did not record hours 02:00 and 03:00 during the weekend; (iii) Sensor hb117 did not record Hour 23:00 of the weekend; and (iv) two weekday hours (15:00 and 23:00) and one weekend hour (14:00) were not observed by Sensor hb138. All the recordings were subsequently organized in separated WAV files of raw audio (one for each 20 min audio clip) and were labeled with information describing the sensor, the day and the initial time of the recording. A total of 463 files were obtained from the recording campaign, which encompasses 154 h and 20 min of audio.

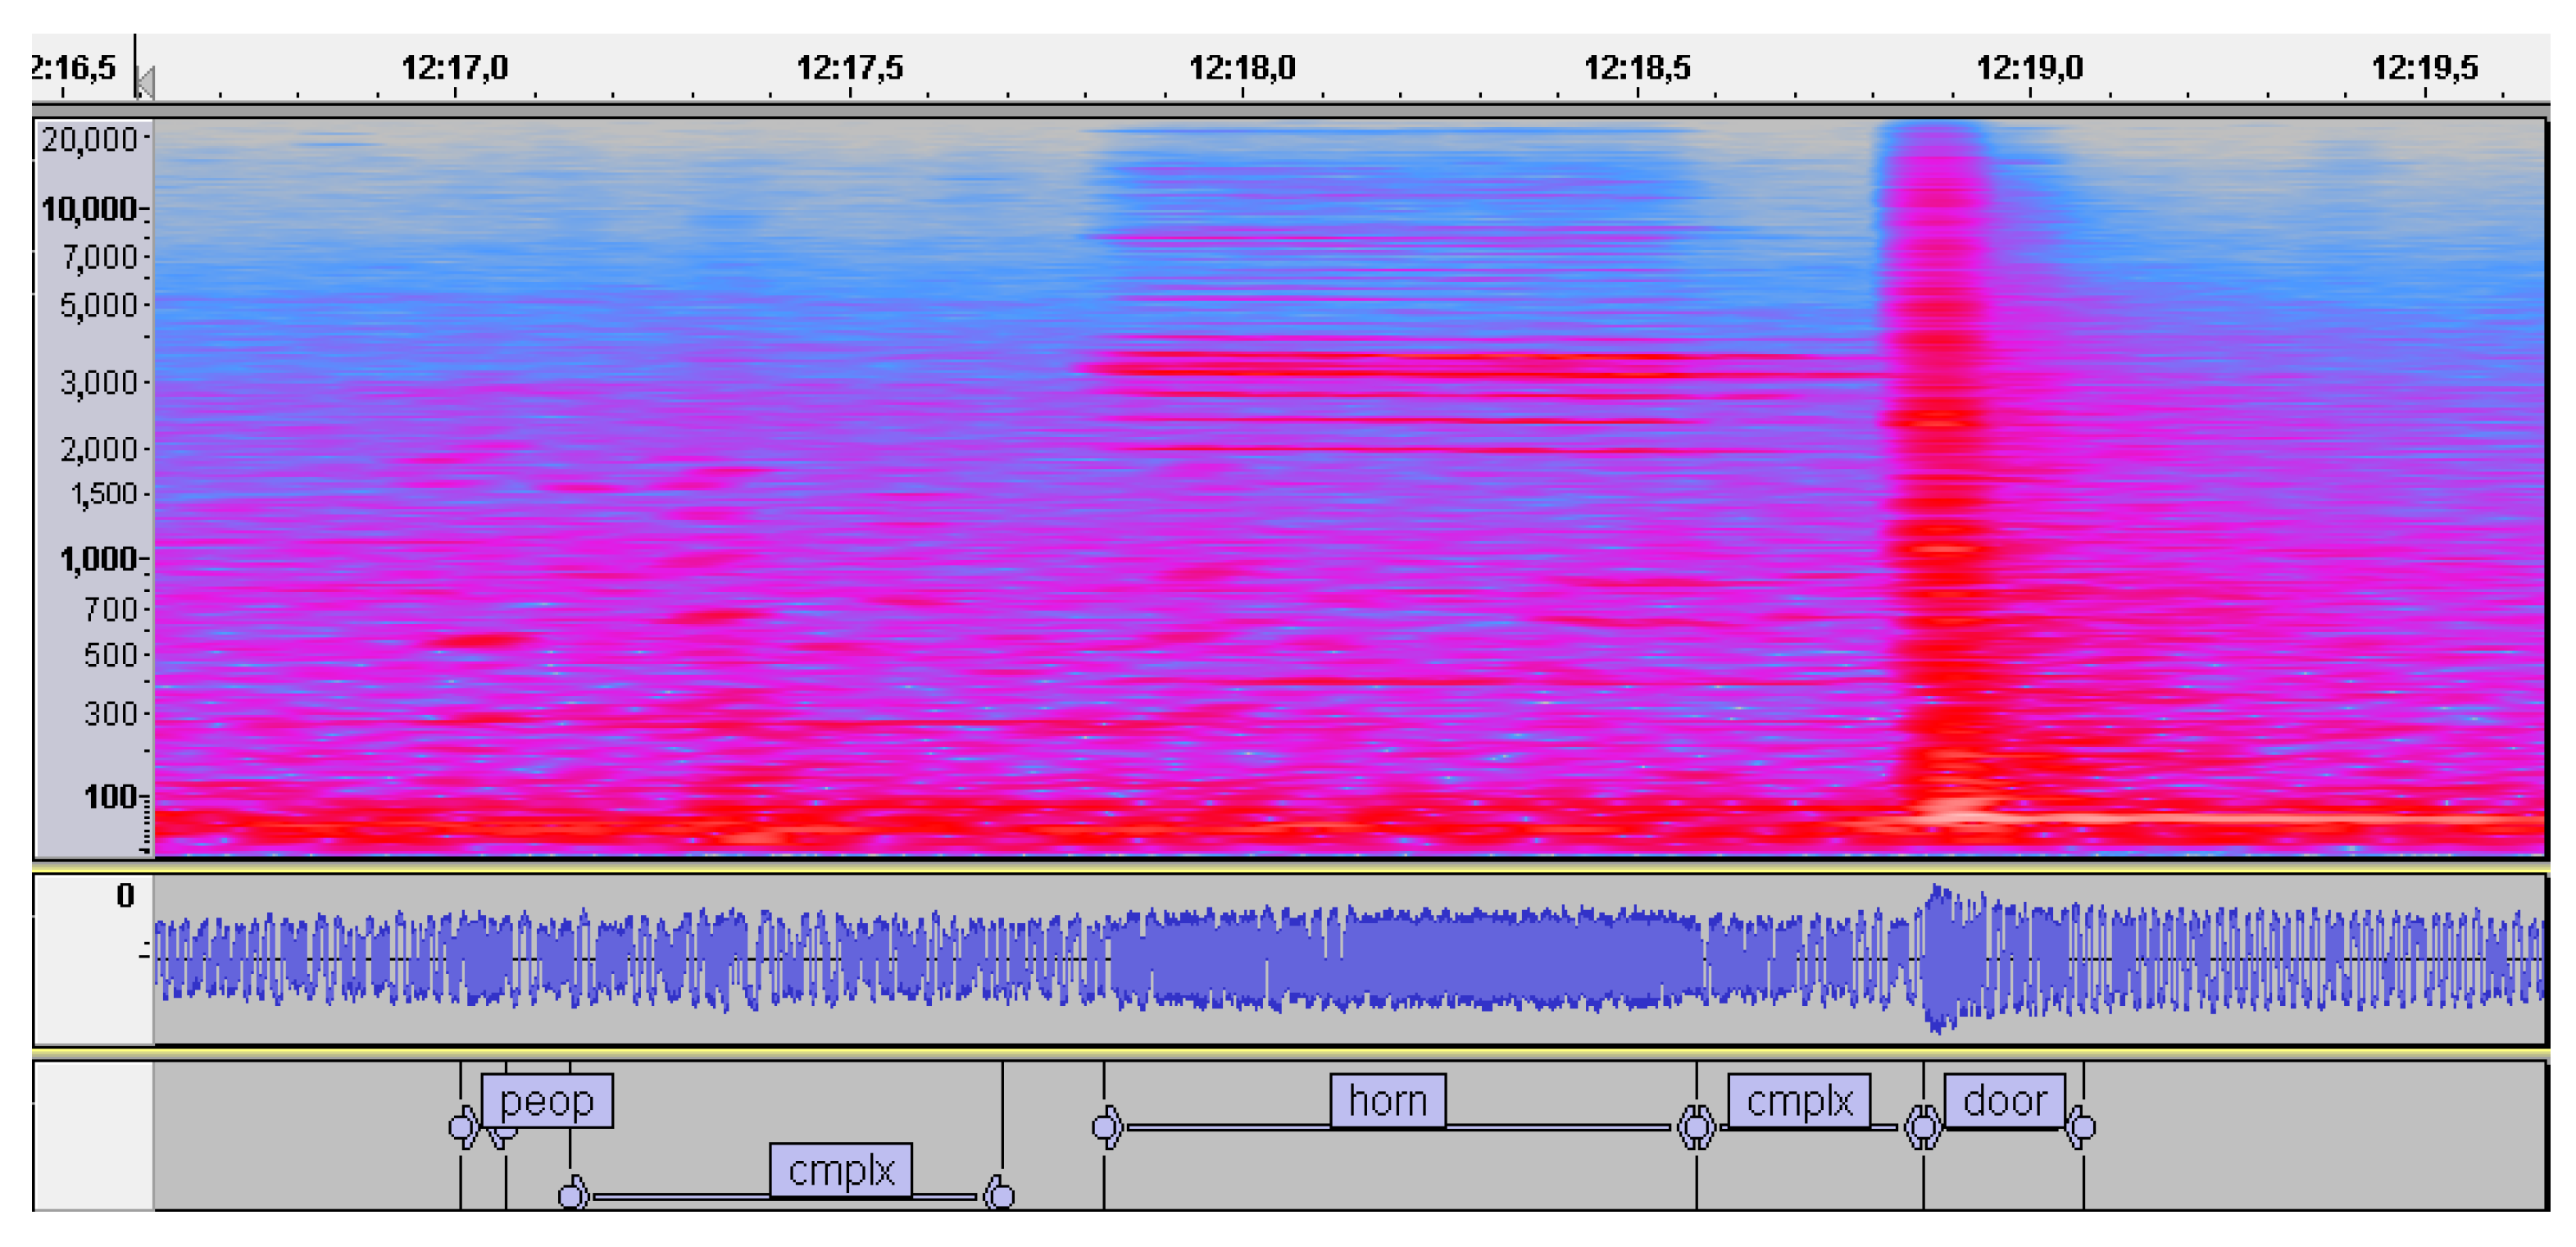
2.2. Labeling Process and ANE Subcategories

The acoustic dataset was manually labeled by 5 experts in audio signal processing, who used Audacity software to perform the labeling process with the aid of visual information (waveform and spectrogram in dB) while listening to the recorded signals. The labeling process follows the methodology described in [16], asking the experts to classify each portion of the audio signal according to THE following criteria: (i) Those audio clips containing road-traffic noise should be labeled as RTN. They may contain all kinds of sounds coming from vehicle engines and tires even if they are distant or practically nonexistent, if any other sound prevails. (ii) Those sounds unrelated to regular RTN should be labeled as ANEs (several subcategories are identified by the experts during the labeling process). (iii) Those audio passages containing a high diversity of sound sources should be labeled as complex sound mixtures (CMPLX).
During the labeling process of the WASN-based urban acoustic database, up to 26 urban-like sound subcategories (plus RTN and CMPLX) were identified and agreed by the experts (see an example in Figure 2). Among the different ANE subcategories listed in Table 1, it can be observed that most of them belong to man-made sounds, mainly originating from means of transport (airp, alrm, bike, brak, busd, horn, rubb, sire, tram, and tran), but also other generated by electrical or mechanical sound sources (bell, blin, door, glas, inte, musi, sqck, trll, and wrks). Moreover, some of them were due to meteorological phenomena (rain, thun, and wind). Finally, sounds produced by people (peop and step) or animals (dog and bird) were also observed, being among the most present ANEs in the urban environment.

2.3. Characteristics of the Urban ANEs Collected by the WASN Sensors

After the experts finished the labeling process, several analyses were conducted on the audio passages labeled as ANEs to determine the main characteristics of the collected ANEs in terms of the number of occurrences, their duration, and the acoustic salience—computed as the signal-to-noise ratio (SNR) with respect to the background traffic noise.
Regarding the occurrences of ANEs, the most frequently observed ones were those of a short nature, usually attributed to urban environments, including peop (22.2 %), bird (14.7%), door (14.7 %), step (13.7 %), and brak (12.7 %). Moreover, some events with a moderate presence were found, such as wrks (4.1%), horn (3.7 %), bike (3.7 %), dog (2.5 %), bell (1.2 %), and busd (1.1 %). The remaining ANE subcategories were observed with low probabilities (less than 1 %), with wind, blin, and tran being rarely found in the recordings (less than 0.05 %). Finally, thun was only identified once.
In what concerns the duration of the ANEs, events with the largest duration were inte (mean length: 20.9 s), followed by sirens and airplanes (with median lengths between 8 and 21 s). Sounds of trains, tramways, rain, and rubbish services show median length values between 5 and 8 s. Regarding the events that show a rather short duration, we found blin, alrm, wind, trll, musi, wrks, and brak as sounds with median durations between 1 and 3 s, while the rest of the observed ANE subcategories present a median length shorter than 1 s.
Another interesting question to consider beyond the mere presence of ANEs is the analysis of their potential impact on the acoustic environment. To this end, the duration and SNR of the ANEs have been studied, together with the total amount of time they appear in the WASN-based dataset. In order to determine the ANEs’ acoustic salience with respect to the background traffic noise, the SNR of each ANE was computed following the procedure described in [18]. The ANE subcategories presenting the highest SNRs (median values between 4 and 7 dB) are blin and dog, which were usually detected in streets with very low traffic conditions. Moreover, glas also presented quite high SNR values, followed by tran, tram, bell, horn, door, and rubb (median SNR values between 2 and 4 dB). The ANE subcategories inte, rain and wind presented very low SNR values, most of them being below 0 dB. The rest of the anomalous noise events presented quite balanced positive and negative SNR values, since some of them presented salient values with respect to the surrounding background noise, while the others remained under the level of the recorded background, thus potentially having no effect on the computation of the RTN levels due its self-compensation.
Finally, if we take into account both the total recording duration of ANEs together with their SNR, tramways, door sounds, street works, and people-related sounds contribute the most to the noise levels, resulting in a potential higher impact on the L A e q . In contrast, wind, glas, tran, and busd are the anomalous events with the lowest combined values of SNR and total recorded duration. Finally, sounds that show high SNR values but with a moderate duration are dogs barking, alarms, bells, and vehicle horns. Nevertheless, the computation of the real impact of these audio events on the equivalent noise levels for the generation of road traffic noise maps is left for future work.

3. Discussion and Conclusions

In this work, a first analysis of the 154 h WASN-based urban acoustic dataset recorded during two days (one labour day and one weekend day) in District 9 of Milan has been presented. As a result of the labeling process of the audio dataset, up to 129 h, 12 min, and 35 s were classified as RTN (83.7 %), 13 h, 16 min, and 1 s were tagged with one of the ANEs subcategories (8.6 %), and the remaining 11 h, 51 min, and 25 s were labeled as CMPLX (7.7 %).
After comparing the WASN-derived acoustic dataset with the previous one obtained from the manual recording campaign [17], substantial differences were found. Firstly, it must be pointed out that the WASN-based recording campaign was conducted during entire days on 24 locations (totaling 154 h of data). In contrast, during the manual recordings only up to 20 min of continuous audio were gathered at certain time periods in only 12 city locations (totaling 4 h and 24 min of data). Moreover, most locations were sensed only during the day (having only one location with acoustic data from the night period). A low-cost microphone connected to a ZOOM H4n digital recorder and a Brüel&Kjær sonometer were used at the street level, instead of the low-cost sensor installed in the façades, as it was still under development. Furthermore, it is to note that up to 11 new ANE subcategories have been identified across the WASN-based recordings (subcategories alrm, bell, blin, glas, inte, rain, rubb, sqck, step, trll, and wrks), some of them being quite predominant in several of the sensors’ locations. Finally, it is important to remark that, in the WASN-based recordings, the total amount of labeled ANEs (8.6%) is quite lower than the manual dataset (12.2%). This result confirms the unbalanced nature of the problem, besides the need for extensive recordings to characterize the urban environment properly.
Future work will be focused on adapting the ANED algorithm to run in real operation conditions by training it with the built WASN-based acoustic dataset. Moreover, we will keep analyzing the database contents, paying special attention to the complex passages and their potential impact on the algorithm’s performance.

Funding

The research presented in this work has been partially supported by the LIFE DYNAMAP project (LIFE13 ENV/IT/001254). Joan Claudi Socoró acknowledges the support from the Obra Social “La Caixa” under grant ref. 2019-URL-IR1rQ-053. Ferran Orga thanks the support of the European Social Fund and the Secretaria d’Universitats i Recerca del Departament d’Economia i Coneixement of the Catalan Government for the pre-doctoral FI grant No. 2019_FI_B2_00168.

Acknowledgments

The authors would like to thank Marc Hermosilla, Ester Vidaña, Alejandro González, and Sergi Barqué for helping in the audio labeling. The authors would like to thank Bluewave for the recording of the audio files in the sensors of the WASN.

Conflicts of Interest

The authors declare that there is no conflict of interest.

References

  1. Botteldooren, D.; Dekoninck, L.; Gillis, D. The influence of traffic noise on appreciation of the living quality of a neighborhood. Int. J. Environ. Res. Publ. Health 2011, 8, 777–798. [Google Scholar] [CrossRef] [PubMed]
  2. Alberts, W.; Roebben, M. Road Traffic Noise Exposure in Europe in 2012 based on END data. In Proceedings of the 45th International Congress and Exposition on Noise Control Engineering (INTER-NOISE 2016), Institute of Noise Control Engineering, Hamburg, Germany, 21–24 August 2016; pp. 1236–1247. [Google Scholar]
  3. Babisch, W. Transportation noise and cardiovascular risk. Noise&Health 2008, 10, 27–33. [Google Scholar]
  4. Sørensen, M.; Andersen, Z.J.; Nordsborg, R.B.; Becker, T.; Tjønneland, A.; Overvad, K.; Raaschou-Nielsen, O. Long-term exposure to road traffic noise and incident diabetes: A cohort study. Environ. Health Perspect. 2013, 121, 217–222. [Google Scholar] [CrossRef] [PubMed]
  5. Kim, M.; Chang, S.I.; Seong, J.C.; Holt, J.B.; Park, T.H.; Ko, J.H.; Croft, J.B. Road traffic noise: Annoyance, sleep disturbance, and public health implications. Am. J. Prev. Med. 2012, 43, 353–360. [Google Scholar] [CrossRef] [PubMed]
  6. EU. Directive 2002/49/EC of the European Parliament and the Council of 25 June 2002 relating to the assessment and management of environmental noise. Off. J. Eur. Communities 2002, L189/12. [Google Scholar]
  7. Kephalopoulos, S.; Paviotti, M.; Anfosso-Lédée, F. Common Noise Assessment Methods in Europe (CNOSSOS-EU); Report EUR 25379 EN; Publications Office of the European Union: Brussels, Belgium, 2002; pp. 1–180. [Google Scholar]
  8. Licitra, G.; Ascari, E. Noise Mapping in the EU: State of Art and 2018 Challenges. In Proceedings of the 47th International Congress and Exposition on Noise Control Engineering (INTER-NOISE 2018), Chicago, IL, USA, 26–29 August 2018; pp. 2486–2490. [Google Scholar]
  9. Cerniglia, A. Development of a GIS based software for real time noise maps update. In Proceedings of the 45th International Congress and Exposition on Noise Control Engineering (INTER-NOISE 2016), Hamburg, Germany, 21–24 August 2016; pp. 6380–6386. [Google Scholar]
  10. Alías, F.; Alsina-Pagès, R.M. Review of Wireless Acoustic Sensor Networks for Environmental Noise Monitoring in Smart Cities. Sensors 2019, 2019, 13. [Google Scholar] [CrossRef]
  11. Sevillano, X.; Socoró, J.C.; Alías, F.; Bellucci, P.; Peruzzi, L.; Radaelli, S.; Coppi, P.; Nencini, L.; Cerniglia, A.; Bisceglie, A.; et al. DYNAMAP—Development of low cost sensors networks for real time noise mapping. Noise Mapp. 2016, 3, 172–189. [Google Scholar] [CrossRef]
  12. Zambon, G.; Benocci, R.; Bisceglie, A. Development of optimized algorithms for the classification of networks of road stretches into homogeneous clusters in urban area. In Proceedings of the 22nd International Congress on Sound and Vibration (ICSV), Florence, Italy, 12–16 July 2015; pp. 1–8. [Google Scholar]
  13. Bellucci, P.; Peruzzi, L.; Zambon, G. LIFE DYNAMAP project: The case study of Rome. Appl. Acoust. 2017, 117, 193–206. [Google Scholar] [CrossRef]
  14. Socoró, J.C.; Alías, F.; Alsina-Pagès, R.M. An Anomalous Noise Events Detector for Dynamic Road Traffic Noise Mapping in Real-Life Urban and Suburban Environments. Sensors 2017, 17, 2323. [Google Scholar] [CrossRef] [PubMed]
  15. Alías, F.; Alsina-Pagès, R.M.; Orga, F.; Socoró, J.C. Detection of Anomalous Noise Events for Real-Time Road-Traffic Noise Mapping: The Dynamap’s project case study. Noise Mapp. 2018, 5, 71–85. [Google Scholar] [CrossRef]
  16. Alsina-Pagès, R.M.; Orga, F.; Alías, F.; Socoró, J.C. A WASN-Based Suburban Dataset for Anomalous Noise Event Detection on Dynamic Road-Traffic Noise Mapping. Sensors 2019, 19, 2480. [Google Scholar] [CrossRef] [PubMed]
  17. Alías, F.; Socoró, J.C. Description of anomalous noise events for reliable dynamic traffic noise mapping in real-life urban and suburban soundscapes. Appl. Sci. 2017, 7, 146. [Google Scholar] [CrossRef]
  18. Orga, F.; Alías, F.; Alsina-Pagès, R.M. On the Impact of Anomalous Noise Events on Road Traffic Noise Mapping in Urban and Suburban Environments. Intl. J. Environ. Res. Publ. Health 2017, 15, 13. [Google Scholar] [CrossRef] [PubMed]
Figure 1. Map of the recording locations during the manual campaign [17], and location of the DYNAMAP’s WASN sensors in Milan, including examples of each recording position on the right.
Proceedings 42 00060 g001
Figure 2. Excerpt of a WASN-based recorded audio containing 3 ANEs with different durations (D) and signal-to-noise ratios (SNR): peop with D = 0.06 s and SNR = 5.2 dB, horn with D = 0.75 s and SNR = 11.62 dB, and door with D = 0.21 s and SNR = 7.55 dB. From top to bottom: the spectrogram, the waveform in dB, and the labels.
Proceedings 42 00060 g002
Table 1. Description of the 26 sound subcategories attributed to anomalous noise events found throughout the manual labeling process of the WASN-based urban acoustic database.
LabelDescriptionLabelDescription
airpNoise of airplanes and helicoptersmusiMusic in car or in the street
alrmSound of an alarm or a vehicle
beep moving backwards
peopSounds of people chatting, laughing,
coughing, sneezing, etc.
bellChurch bellsrainSound of heavy rain
bikeSound of bikes and bike chainsrubbRubbish service, sound of engine taking the
container, emptying it and dropping it down
birdBirdsongsireSirens (ambulances, police, etc.)
blinOpening and closing of a blindsqckSquick sound of door hinges
brakBrakes and conveyor beltsstepSounds of steps
busdOpening bus door (or
tramway), depressurized air
thunThunderstorm
dogBarking of dogstramStop, start and pass by sounds of tramways
doorClosing doors (vehicle or house)tranSound of trains
glasSound of glass crashingtrllSound of wheels of suitcases (trolley)
hornHorns of vehicles (cars, motorbikes,
trucks, etc.)
windNoise of wind (movement
of the leaves of trees, ...)
inteInterfering signal from an industry
or human machine
wrksWorks in the street (e.g. saws, hammer
drills, etc.)
Publisher’s Note: MDPI stays neutral with regard to jurisdictional claims in published maps and institutional affiliations.

