Abstract
Epilepsy affects approximately 67 million people worldwide with up to 75% from developing countries. Diagnosing epilepsy using electroencephalogram (EEG) is complicated due to its poor signal-to-noise ratio, high sensitivity to various forms of artifacts, and low spatial resolution. Laplacian EEG signal via novel and noninvasive tripolar concentric ring electrodes (tEEG) is superior to EEG via conventional disc electrodes due to its unique capabilities, which allow automatic attenuation of common movement and muscle artifacts. In this work, we apply exponentially embedded family (EEF) to show feasibility of automatic detection of gamma band high-frequency oscillations (HFOs) in tEEG data from two human patients with epilepsy as a step toward the ultimate goal of using the automatically detected HFOs as auxiliary features for seizure onset detection to improve diagnostic yield of tEEG for epilepsy. Obtained preliminary results suggest the potential of the approach and feasibility of detecting HFOs in tEEG data using the EEF based detector with high accuracy. Further investigation on a larger dataset is needed for a conclusive proof.
1. Introduction
Epilepsy affects approximately 67 million people worldwide with up to 75% from developing countries. Diagnosing epilepsy using electroencephalogram (EEG) is complicated due to its poor signal-to-noise ratio, high sensitivity to various forms of artifacts, and low spatial resolution. Laplacian EEG signal (tEEG) via novel and noninvasive tripolar concentric ring electrodes (TCREs) is superior to EEG via conventional disc electrodes due to its unique capabilities, which allow automatic attenuation of common movement and muscle artifacts in applications including detection of high-frequency oscillations (HFOs) and seizure onset zones [1] and seizure onset detection [2]. In [1], detection of HFOs, a promising bio-marker of epileptogenesis and ictogenesis [3], was performed manually exposing HFOs in tEEG preceding 100% of seizures. In [2], an exponentially embedded family (EEF)-based detector was used for automatic detection of seizure onset with 100% accuracy on human tEEG data. A detailed review of recent advances in HFO and seizure onset detection based on tEEG via TCREs (including detectors based on EEF) on animal model and human data is available in [4].
In this work, we apply EEF to automatically detect HFOs in tEEG data from two human patients with epilepsy. This preliminary research is important because it allows assessing the potential of automatically detecting HFOs in tEEG with the ultimate goal of using them as auxiliary features for seizure onset detection to improve diagnostic yield of tEEG for epilepsy. Further investigation on a larger dataset is needed for a conclusive proof.
2. Materials and Methods
2.1. Patient Recruitment
Both patients were recruited from the National Institute of Neurology and Neurosurgery (NINN), Mexico City, Mexico. Patients have been referred by the epilepsy clinic with the diagnosis of drug resistant epilepsy. The recording protocols were approved by the NINN’s Institutional Review Board.
2.2. EEG and tEEG Recording
The recording protocol was designed to avoid possible interference with the clinical EEG recording. To attach conventional disc electrodes, the patient’s scalp was cleaned with Nuprep and EEG electrodes were placed at the 10–20 International Electrode System locations using Ten-20 paste. Collodion was used to hold all the EEG electrodes in place. To record tEEG simultaneously with the EEG, TCREs were placed behind the conventional disc electrodes in locations close to the 10-10 sites using Ten-20 paste. The ground was placed on the forehead and the reference was placed at the Oz location. EEG was recorded with the Comet AS40 system (Grass Technologies, West Warwick, RI, USA) at 200 samples per second with the 70 Hz low-pass filter and 60 Hz notch filter active. The tEEG data were pre-amplified with the gain equal to 6, amplified, band-pass filtered 1–100 Hz with 60 Hz notch filter active, and digitized with an Aura LTM-64 system (Grass Technologies, West Warwick, RI, USA) at 200 samples per second. Recording sessions for both patients lasted for about six hours and took place around 7:00 a.m. to 1:00 p.m. According to the NINN recording protocol patients were sleep deprived the night before recording and signed an additional informed consent form for the antiepileptic drugs dosage to be reduced by half the day before the recording. Board-certified neurologists reviewed the recorded data determining the seizure onset time and duration for each seizure.
2.3. HFO Detection Using EEF Test Statistic
EEG and tEEG data were exported from Twin (Grass Technologies, West Warwick, RI, USA) into ASCII text files, imported to Matlab (Mathworks, Natick, MA, USA), and converted to .mat files. For tEEG, two bipolar signals recorded for each TCRE were linearly combined into a Laplacian estimate [5]. To create an automatic HFO detector, EEF was applied to power in individual HFO frequency bands (e.g., 60–80 Hz for high gamma HFOs) for individual tEEG channels rather than to power across the spectrum and across all the data channels as was done for seizure onset detection in [2,6]. These frequency bands were limited in two patients included in this study by the lower bound of the high gamma HFOs (>60 Hz) and the upper bound of the band-pass filter (100 Hz). Otherwise, EEF implementation is consistent with [2,6]. This included using approximately 10 min of the earliest artifact free tEEG data as baseline to calculate the EEF test statistic for the remainder of the patient’s recording. EEF test statistic was calculated in increments of data window size equal to 0.2 s. Simple threshold was used to detect HFO events where EEF test statistic values were significantly larger than those corresponding to interictal background tEEG. First, arithmetic mean and standard deviation were calculated for normalized EEF test statistic. Next, time periods where the EEF test statistic was exceeding its mean plus standard deviation were identified as detected HFOs.
3. Results
Representative examples of tEEG recordings obtained in parallel with the clinical EEG for two patients are shown in Figure 1 and Figure 2, respectively. Patient in Figure 1 is a 42-year-old woman with onset of epilepsy at the age of 9. Having been diagnosed with right temporal lobe epilepsy, she underwent right temporal lobectomy, but seizures persisted. At the time of the study, she was on clonazepam, lamotrigine, and phenytoin. In Figure 1, conventional EEG data (from the bipolar montage F8-F4) are on panel A while tEEE data (from TCRE placed directly behind the F8) are on panels B through E. Seizure onset for a generalized seizure is around 610 s for panels A–E in Figure 1 as evidenced by a marked increase in EEG and tEEG power across the frequency spectrum. A series of HFOs in high-gamma band starting approximately 10 min before the seizure onset are clearly visible in tEEG but not in EEG. Panels C–E are for the same tEEG segment of 11 s marked by a black line segment in panel B at higher temporal resolution. Panel E is an illustration of automatic HFO detection with normalized EEF test statistic within the 60–80 Hz frequency band (blue) and mean plus standard deviation HFO detection threshold (dotted red). All five HFOs are detected as sharp increases in EEF test statistic exceeding the detection threshold.
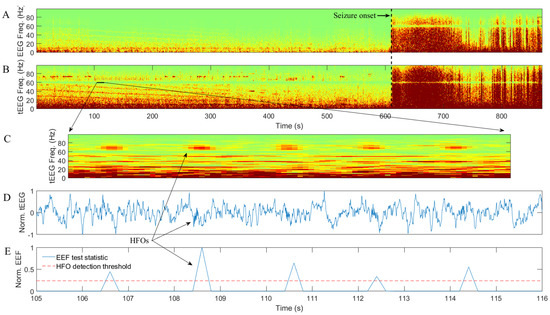
Figure 1.
Example of conventional electroencephalogram (EEG) data (A) and Laplacian EEG (tEEG) data via tripolar concentric ring electrodes (TCRE) (B–E) for 42-year-old female epilepsy patient: (A) and (B) are time-frequency spectrograms for EEG and tEEG data, respectively; (C–E) are zoom-in spectrogram, normalized (to [−1, 1]) waveform, and normalized (to [0, 1]) exponentially embedded family (EEF) test statistic with mean plus standard deviation high-frequency oscillation (HFO) detection threshold respectively for the same tEEG segment of 11 s.
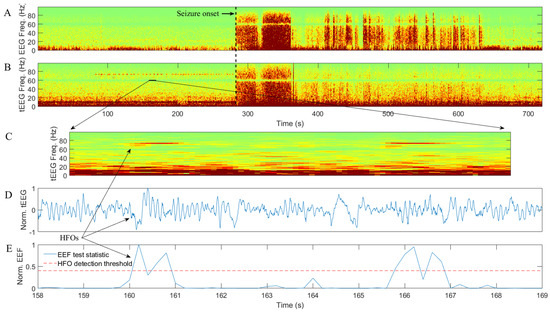
Figure 2.
Example of conventional EEG data (A) and tEEG data via TCRE (B–E) for 45-year-old male epilepsy patient: (A,B) are time-frequency spectrograms for EEG and tEEG data, respectively; (C–E) are zoom-in spectrogram, normalized (to [−1, 1]) waveform, and normalized (to [0, 1]) EEF test statistic with mean plus standard deviation HFO detection threshold respectively for the same tEEG segment of 11 s.
Patient in Figure 2 is a 45-year-old male with onset of epilepsy at the age of 22. Magnetic resonance imaging for this patient revealed left mesial temporal sclerosis and right frontal venous angioma. At the time of the recording, he was on carbamazepine and lamotrigine. Similar to Figure 1, in Figure 2 conventional EEG data (from the bipolar montage Fp2-F4) are on panel A while tEEE data (from TCRE placed directly behind the Fp2) are on panels B through E. Seizure onset is around 280 s for panels A–E in Figure 1 as evidenced by a marked increase in EEG and tEEG power across the frequency spectrum. A series of HFOs in high-gamma band starting approximately 3 min before the seizure onset are clearly visible in tEEG but not in EEG. Panels C–E are for the same tEEG segment of 11 s marked by a black line segment in panel B at higher temporal resolution. Panel E is an illustration of automatic HFO detection with normalized EEF test statistic within the 60–80 Hz frequency band (blue) and mean plus standard deviation HFO detection threshold (dotted red). Both HFOs are detected as sharp increases in EEF test statistic exceeding the detection threshold.
4. Discussion
Preliminary results suggest the potential of the proposed approach and feasibility of detecting HFOs in tEEG data using the EEF-based detector. In the representative examples for two epilepsy patients from Figure 1 and Figure 2, 100% of HFOs (seven out of seven) are detected correctly i.e., there are no false negative detections. Figure 2 suggests the possibility of false positive detections with detection threshold being exceeded twice for each HFO. Application of the smoothing algorithm similar to the one from [2] where automatic detections separated by less than, for example, the average duration of an HFO are counted as a single detection may alleviate this issue. It should also be noted that a very simple decision threshold (mean plus standard deviation) has been used in this study. While it may be sufficient to achieve 100% accuracy of HFO detection in a couple of representative examples provided, a more comprehensive thresholding approach may be needed for a larger dataset. Examples for such an approach include an asymptotic threshold based on the assumption of the distribution under the null hypothesis being a chi-squared distribution with the number of degrees of freedom equal to the number of tEEG channels to integrate used in [6] or an adaptive threshold based on the empirical EEF test statistic and given probability of false alarm used in [2]. Finally, in both patients, HFOs were clearly visible in tEEG but not in EEG (Figure 1 and Figure 2, panels B and A, respectively), which is consistent with what was reported in [1].
Needless to say, further investigation on a larger dataset is needed for a conclusive proof. To fully assess the potential of automatic HFO detection using EEF, it is to be performed not just prior to clinical seizures but for extended periods of time for epilepsy patients with clinical seizures, patients with epileptiform activity but no seizures, and patients with neither epileptiform activity nor seizures using non patient-specific model. Other potential directions of future work include applying EEF to integrate multiple tEEG channels as was done, for example, for 3 channels in [6] and for 19 channels in [2]. However, in [1], for five epilepsy patients, HFOs were present, on average, only in 35.5% of the patient’s tEEG channels. This percentage may be insufficient for HFOs to be reflected in the EEF statistic integrating all of the patients tEEG channels. The same argument can be made for the case of applying EEF to power across the frequency spectrum rather than to individual HFO frequency bands as was done in this study where detection of high-gamma band HFOs was performed in the frequency band of 60–80 Hz. Finally, drawing a comparison between detections based on EEF test statistic as opposed to different signal power metrics could be beneficial.
Author Contributions
Conceptualization, O.M.; methodology, O.M., F.L., and M.M.; software, O.M.; validation, O.M., F.L., and M.M.; writing—original draft preparation, O.M., F.L., and M.M.; writing—review and editing, O.M.; supervision, O.M.; project administration, O.M.; funding acquisition, O.M.
Funding
This research was funded by the National Science Foundation (NSF) Division of Human Resource Development (HRD) Tribal Colleges and Universities Program (TCUP), grant number 1622481 to Oleksandr Makeyev.
Acknowledgments
The authors thank the patients and their relatives for taking part in this research. We also thank Walter G. Besio from the University of Rhode Island for the constructive discussions and helpful comments related to this research as well as Iris E. Martínez-Juárez, Marycarmen Fernández González-Aragón, Álvaro Moreno Avellán, and technologists from the NINN for their support while using the video-EEG lab and their help with the data collection.
Conflicts of Interest
The authors declare no conflict of interest. The funders had no role in the design of the study; in the collection, analyses, or interpretation of data; in the writing of the manuscript, and in the decision to publish the results.
References
- Besio, W.G.; Martinez-Juarez, I.E.; Makeyev, O.; Gaitanis, J.N.; Blum, A.S.; Fisher, R.S.; Medvedev, A.V. High-Frequency Oscillations Recorded on the Scalp of Patients With Epilepsy Using Tripolar Concentric Ring Electrodes. IEEE J. Transl. Eng. Health Med. 2014, 2, 1–11. [Google Scholar] [CrossRef] [PubMed]
- Makeyev, O.; Ding, Q.; Martínez-Juárez, I.E.; Gaitanis, J.; Kay, S.M.; Besio, W.G. Multiple sensor integration for seizure onset detection in human patients comparing conventional disc versus novel tripolar concentric ring electrodes. In Proceedings of the 2013 35th Annual International Conference of the IEEE Engineering in Medicine and Biology Society (EMBC), Osaka, Japan, 3–7 July 2013. [Google Scholar]
- Zijlmans, M.; Worrell, G.A.; Dümpelmann, M.; Stieglitz, T.; Barborica, A.; Heers, M.; Ikeda, A.; Usui, N.; Le Van Quyen, M. How to record high-frequency oscillations in epilepsy: A practical guideline. Epilepsia 2017, 58, 1305–1315. [Google Scholar] [CrossRef] [PubMed]
- Makeyev, O.; Musngi, M.; Lee, F.; Tamayo, M. Recent Advances in High-Frequency Oscillations and Seizure Onset Detection Using Laplacian Electroencephalography via Tripolar Concentric Ring Electrodes. Proceedings 2017, 2, 117. [Google Scholar]
- Besio, W.G.; Koka, K.; Aakula, R.; Dai, W. Tri-polar concentric ring electrode development for Laplacian electroencephalography. IEEE Trans. Biomed. Eng. 2006, 53, 926–933. [Google Scholar] [CrossRef] [PubMed]
- Makeyev, O.; Ding, Q.; Kay, S.M.; Besio, W.G. Sensor integration of multiple tripolar concentric ring electrodes improves pentylenetetrazole-induced seizure onset detection in rats. In Proceedings of the 2012 Annual International Conference of the IEEE Engineering in Medicine and Biology Society, San Diego, CA, USA, 28 August–1 September 2012; pp. 5154–5157. [Google Scholar]
Publisher’s Note: MDPI stays neutral with regard to jurisdictional claims in published maps and institutional affiliations. |
© 2019 by the authors. Licensee MDPI, Basel, Switzerland. This article is an open access article distributed under the terms and conditions of the Creative Commons Attribution (CC BY) license (https://creativecommons.org/licenses/by/4.0/).