1. Introduction
Crack initiation and propagation vary the mechanical properties of the pavement and further alter its designed function [
1]. To date, optical fibers [
2], conventional strain gauges [
3], and sometimes metal-foil-type gauges [
4], are commonly used for Structural Health Monitoring (SHM) applications. Although conventional strain gauges show good reliability, they are rarely used in asphalt materials, due to the challenges of harsh installation conditions, high temperatures (up to 164 °C), and pressure (around 290 ksi) [
5,
6]. Optical fibers are relatively expensive.
Piezoelectric materials are materials that can generate electrical charges when they are mechanically deformed. To date, piezoelectric materials, such as piezoceramic material (Lead Ziroconate Titanate, PZT) and piezoelectric plastic material (PVDF), have been widely used in research and in practice as sensors for dynamic applications in SHM and energy harvest [
7,
8,
9,
10], since piezoelectric-based sensors have strong piezoelectric effects and wide bandwidth. However, piezoceramic material always suffers from saturation due to its high piezoelectric coefficient, and is also far too brittle to sustain high strain. Piezoelectric plastic materials, such as PVDF, offer the advantages of high sensitivity, good flexibility, good manufacturability, small distortion, low thermal conductivity, high chemical corrosion resistance, and heat resistance [
11,
12]. As such, PVDF was chosen as the key sensing material for this multi-layered strain sensor. However, due to the harsh installation conditions of the asphalt pavement, particularly the high temperature (up to 164 °C) and pressure (around 290 ksi), specific packaging would need to be designed for the PVDF thin film to survive during the construction.
To this end, this work proposes to use a multi-layered strain sensor to overcome the installation challenges in asphalt pavement and to provide a reliable SHM approach of asphalt pavement. The core of the sensor is an H-shaped Araldite GY-6010 epoxy structure with a set of PVDF piezoelectric transducers in its center beam and a polyurethane foam layer at its external surface. A thin layer of a cast urethane resin coating and Araldite GY-6010 epoxy frameset are added to enhance the overall sensor stiffness and to prevent the sensor’s being damaged in the field by compaction. The H-shape is adopted from the conventional strain gauge [
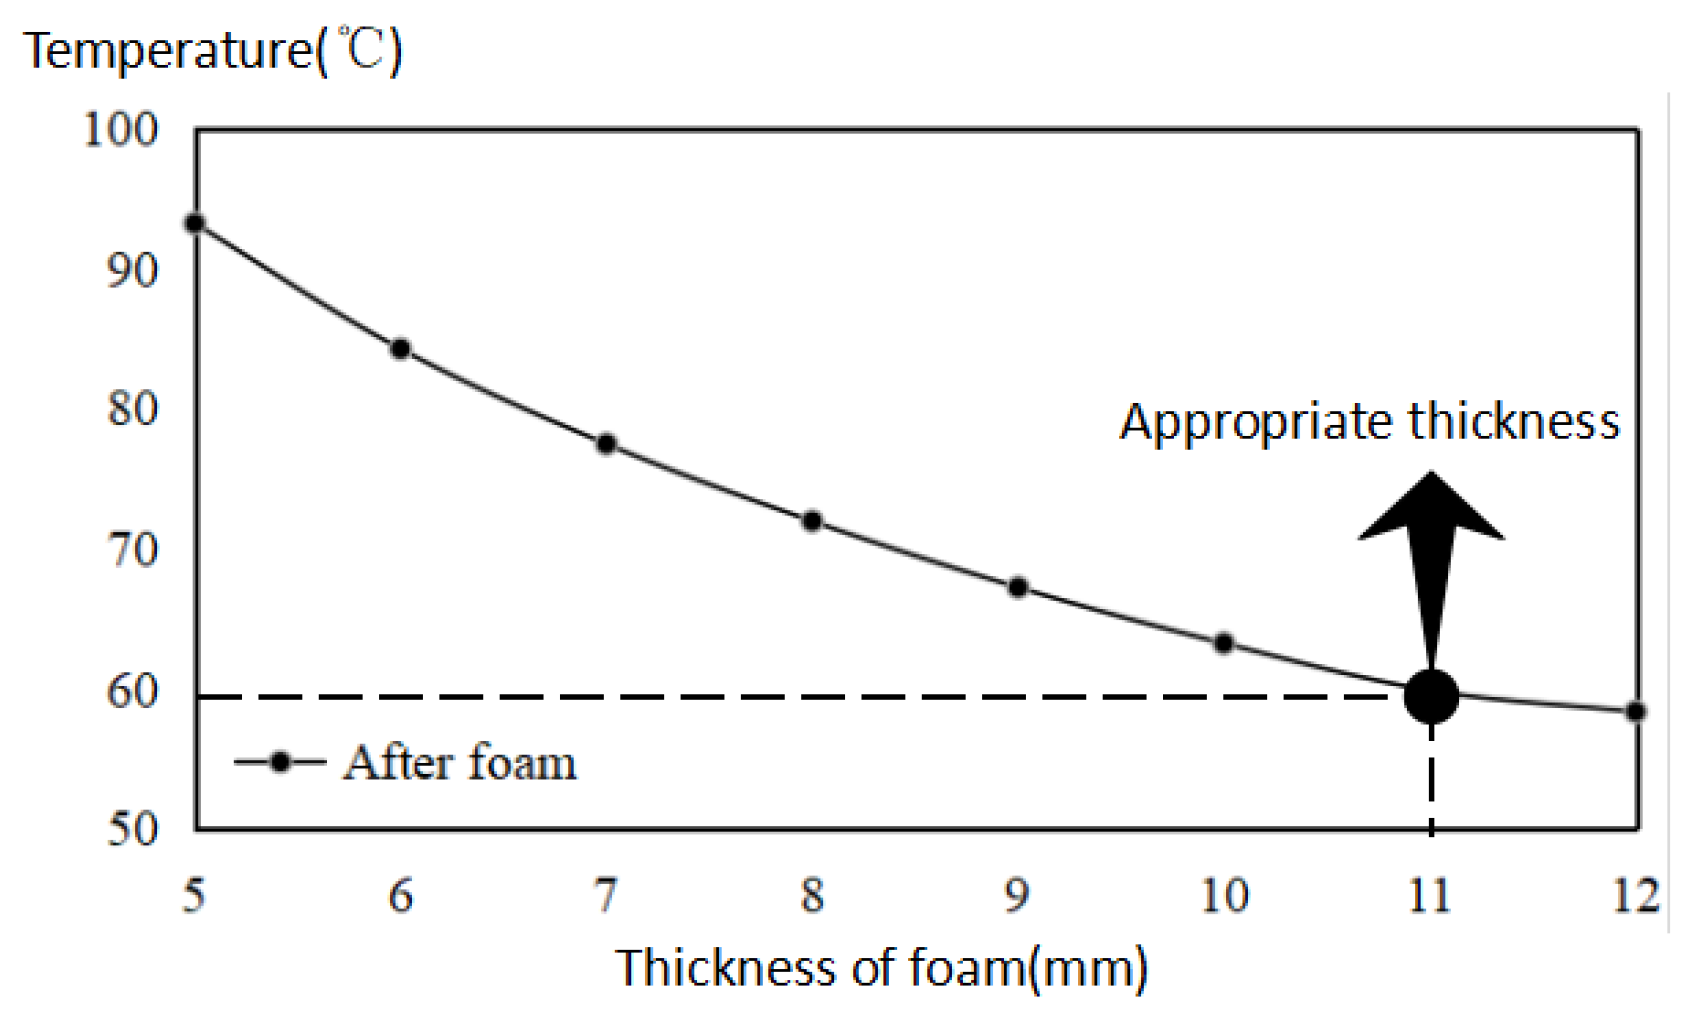
13]. As a proof-of-concept study, a numerical stress deflection model was created to simulate the pavement-sensor interaction for the design of the strain sensor for monitoring the SHM of asphalt pavement. Simulation of heat transfer is conducted in COMSOL to determine the thickness of each layer. As a result, the chosen thickness of the middle foam layer is 11 mm. Another finite element analysis was conducted to study the center beam length/wing length ratio and to validate the sensor’s capability of capturing the crack initiation after packaging.
2. Sensor Configuration
Figure 1 depicts the multi-layered strains sensor used in this work for the SHM of asphalt pavement. The key sensing unit is an 80 mm × 18 mm × 1.55 mm PVDF piezoelectric thin film [
13]. To better protect the PVDF thin film, three layers of protection, which respectively are the internal mechanical protection layer, the middle thermal insulation layer, and the outmost corrosion protection layer made by urethane casting resin, are built on the external surface of the PVDF thin film. Regarding the internal mechanical protection layer, the packaging material chosen is Araldite GY-6010 epoxy [
5]. According to the material parameter sheet of Araldite GY-6010 epoxy, it has a tensile modulus around 2.67 GPa and high tensile and flexural strengths above 27.56 MPa, which are similar to other epoxies. Its thermal conductivity is relatively lower, generally only 0.2 W·m
−1·K
−1. In addition, polyurethane foam is chosen as the material for the middle thermal insulation layer due to its excellent thermal insulation performance. The thermal conductivity of polyurethane foam is only 0.022 W·m
−1·K
−1 [
14]. Considering the stress distribution of the sensor embedded underneath the pavement, the H-shape has been adopted in this paper. The thickness of the outer corrosion protection layer is less than 1 mm, which is negligible as compared with the thickness of the other two layers, and it will not be discussed in this paper. The substitute was not included in the analysis.
As mentioned above, the thermal insulation material used in this study is polyurethane foam, which has a thermal conductivity of 0.022 W·m
−1·K
−1 [
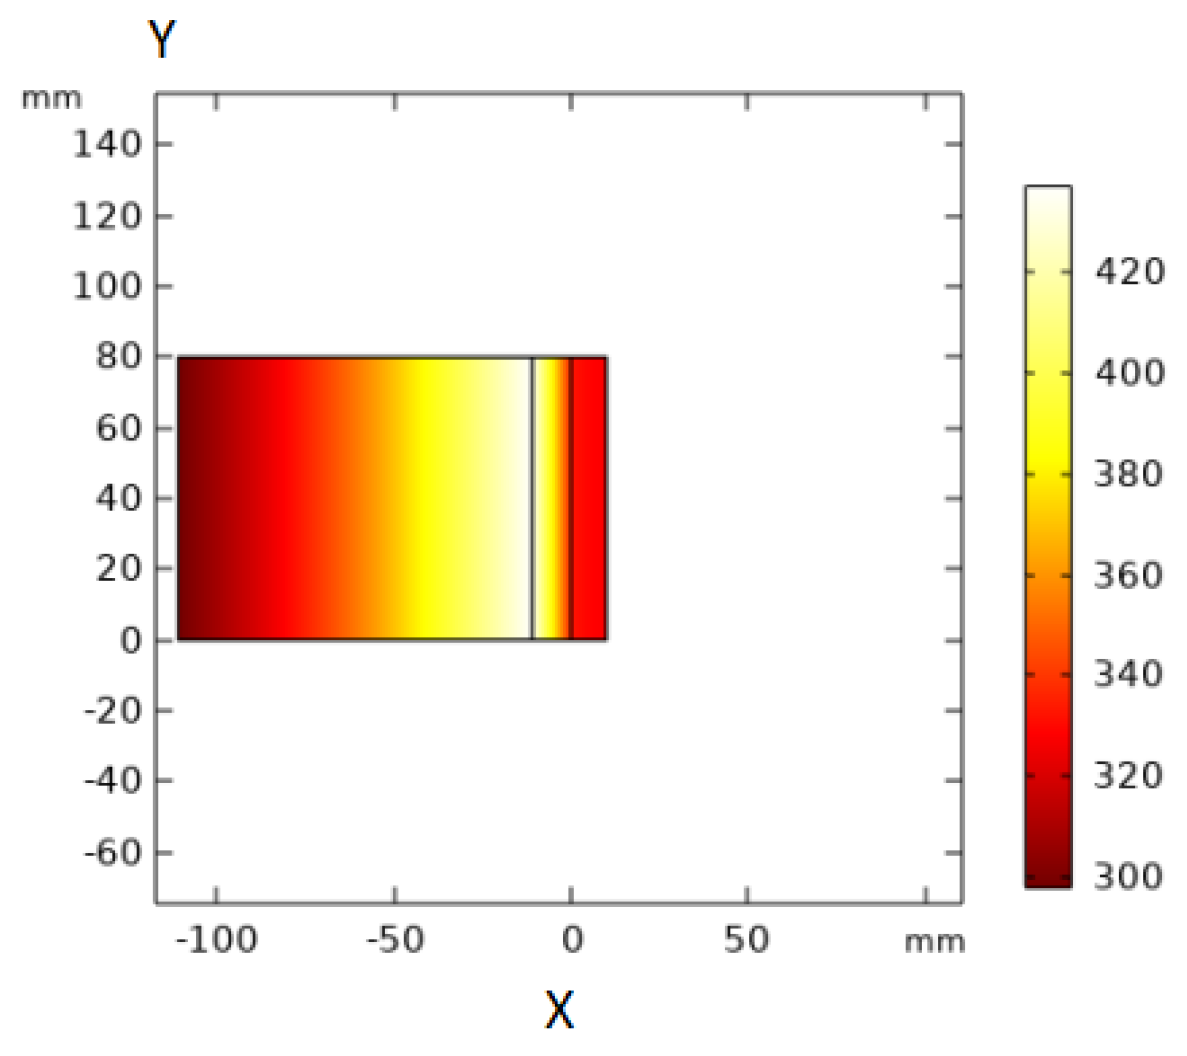
14]. Several heat conduction simulations are conducted to determine the thickness of the foam. To simply the finite element model (FEM), a two- dimensional FEM is created in COMSOL Multiphysics, as shown in
Figure 2b according to the conduction Equations (1) and (2).
where
Q is the heat content in Joules,
k represents the conductivity of materials which used in the simulation,
q is the local heat flux density, W·m
−2, and
ρ is the density of each material, kg·m
−3.
Cp is each material’s specific heat capacity, J·kg
−1·K
−1. ∇
T is the temperature gradient, K·m
−1·T, t represents the temperature and the time, respectively.
In the FEM, the thickness of the polyurethane foam is simulated in the range of 5 mm to 12 mm with a 1 mm increment. Meanwhile, the thicknesses of the asphalt concrete and the internal mechanical protection layer (Araldite GY-6010 epoxy layer) are set as 100 mm and 10 mm, respectively. The thickness of the internal mechanical protection layer is an estimate value based on the desired mechanical strength of the sensor. The boundary condition of the model is set as shown in
Figure 2a. The left boundary of the asphalt is directly in contact with air, whose temperature is set as constant room temperature: 298.15 K. Meanwhile, the right boundary of the asphalt is in contact with the strain sensor, whose temperature should initiate at 437.15 K [
15]. Finally, according to the literature, the average cooling time of the asphalt pavement is 39 mins [
15]. As such, the heat transfer time in this study is set as 39 mins. As a result, the maximum output temperature (the temperature between the middle mechanical protection layer and PVDF thin film) should be no more than 333.15 K (the item labeled in red in
Figure 2a). In
Figure 2a,b and
Figure 3, the X axis and Y axis represent the directions along the sensor height and length, respectively.
As shown in
Figure 3, with the increase of the foam thickness, the output temperature drops correspondingly. If the desired output temperature is 333.15 K (60 °C), the minimum thickness of the foam should be 11 mm. It can be clearly seen from
Figure 4 that the output temperature decreases dramatically after the thermal insulation layer (foam layer).
3. Solid Mechanics Model
3.1. Finite Element Model
After the determination of the thickness of the middle thermal insulation layer, the next important task is to determine the optimal ratio of the wing length to the center beam length. With the optimal ratio, the sensor is expected to reach its highest sensitivity with the lowest material cost, in other words, the lowest cost. Considering the pressure on the road, the static performance of the sensor under the pressure of the car (4900 N) on the road is simulated and analyzed. In this simulation, the length of the center beam of the H-shape, LC, is first fixed as 160 mm, and the strain is observed by varying the wing length, LW, in the range of 20 mm to 50 mm with a 10 mm increment. After confirming the length of the wing, LW, another simulation is carried out to determine the final center beam length/wing length ratio by fixing the wing length at 50 mm and varying the center beam length in the range of 80 mm to 200 mm with a 20 mm increment.
3.2. Three-Point Bending Test
In this simulation, a three-point bending test is utilized to analyze the sensor design. As shown in
Figure 5, two concrete supports are used at both ends of the bottom of asphalt pavement beam. The size of the asphalt concrete is 300 mm × 130 mm × 100 mm. The thickness of the asphalt equals 100 mm, cited from Alavi, A.H.’s study [
16]. A force of 4.9 kN is applied to the middle region of the asphalt pavement beam’s top surface, with a contact area of 200 mm × 130 mm. In other words, the overall pressure applied on the top of the beam is about the pressure of a tire on the ground of an ordinary car.
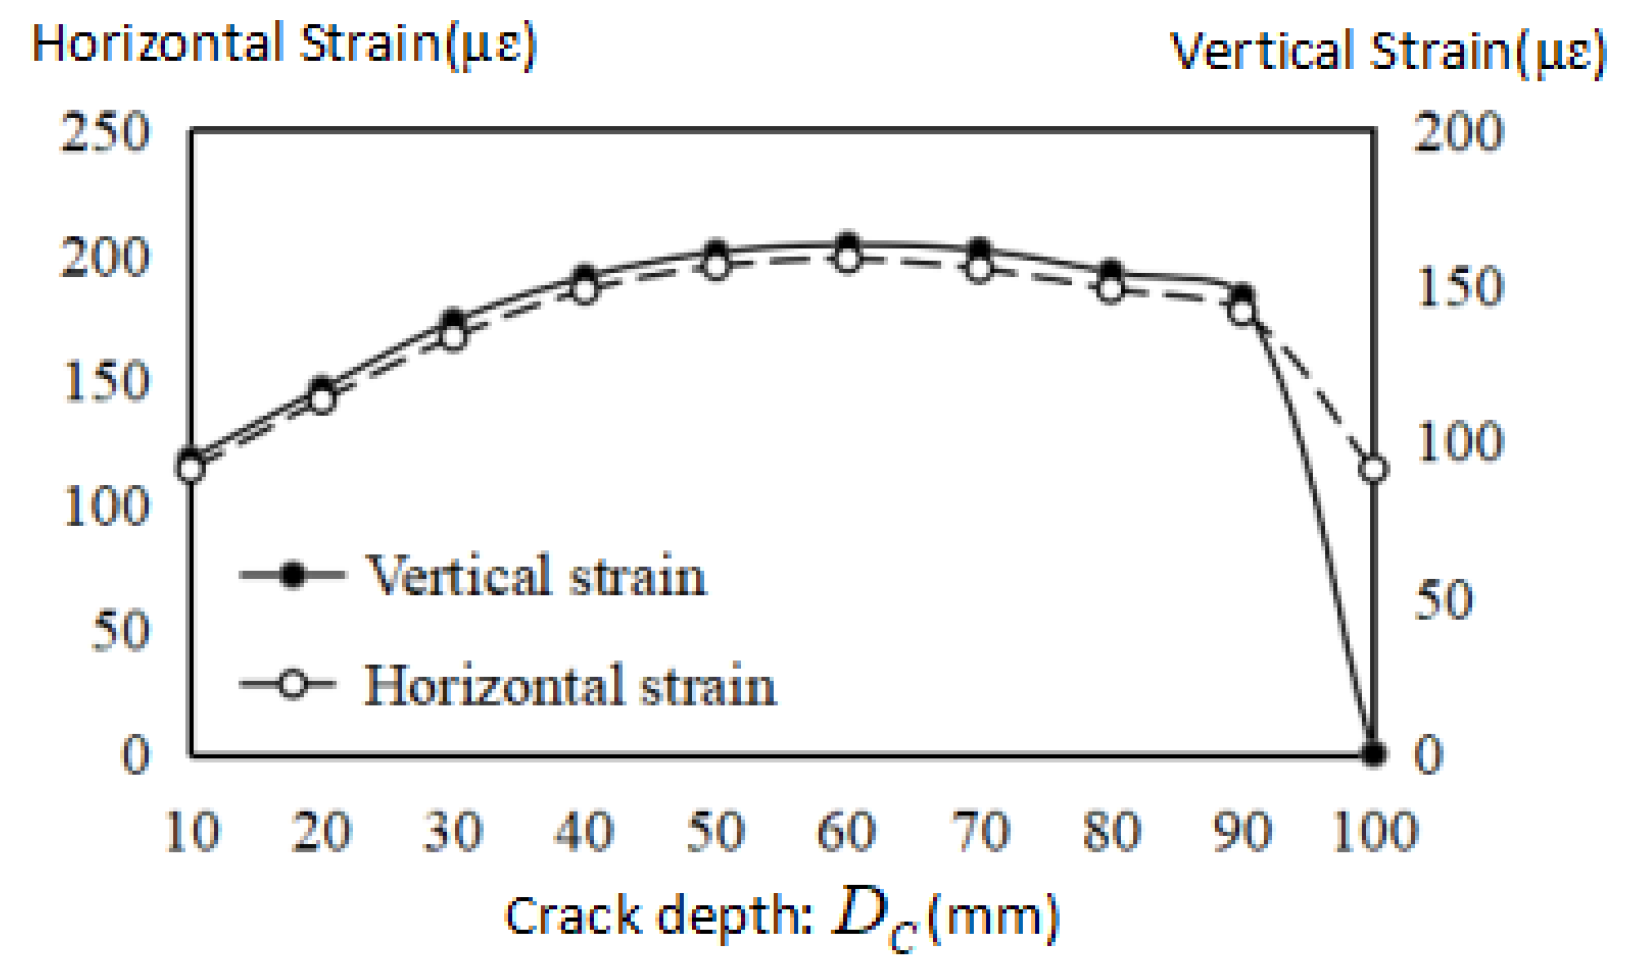
In addition, the same analysis is also used to validate the feasibility of using the sensor to detect the pavement crack. The damage was introduced by making a crack at the middle of the bottom of the asphalt pavement beam. To be consistent, the total height of the asphalt pavement beam is still 100 mm (D = 100 mm). By increasing the crack depth, DC, the measured sensor strain should change correspondingly. As such, the crack depth, DC, is chosen in the range of 0 mm to 100 mm with a 10 mm increment. In the FEM, the Elastic modulus, the density, and Poisson’s ratio of asphalt pavement beam used were 1200 MPa, 2.6 g·cm−3, and 0.35, respectively.
3.3. Result and Discussion
Figure 6 shows that with the increase of the wing length,
LW, both the vertical and the horizontal strain increases. However, when the wing length,
LW, increases to 50 mm, the vertical strain curve begins to flatten and it stabilizes at around 101 µε. Meanwhile, the horizontal strain first shows a gentle trend and then shows a sharp upward trend. Therefore, according to the variation trend of the water vertical strain curve, 50 mm can be determined as the suitable width of the wing. After determining the width of the wing, the simulation began to change the length of the center beam,
LC, with a fixed side wing length,
LW. The simulation results are shown in
Figure 7; by increasing the length of the center beam, the two strain curves increase gradually until the length of the center beam,
LC, reaches 160 mm. After 160 mm, the horizontal strain basically does not change, but the vertical strain curve drops slightly in the range of 160 mm to 180 mm. Then both the vertical strain and the horizontal strain show a peak at 190 mm. When the length reaches 200 mm, the two curves decrease sharply, indicating that the performance of the H-shape cannot be guaranteed. As such, the final decision is to use 160 mm as the length of the final center beam. In other words, the optimal ratio of the center beam length (160 mm) to wing length (50 mm) is
Section 3.2.
The simulation results of crack detection are shown in
Figure 8. It can be clearly seen from the figure that when the notch depth increases to 50 mm, the two strain curves reach their peaks. From 50–90 mm, these two curves drop slightly. After 90 mm, the strain value begins to decline. Therefore, it can be concluded that the H-shape can detect the state of the crack by observing the vertical strain or the horizontal strain.


