Proceeding Paper

Operational Amplifiers Revisited for Low Field Magnetic Resonance Relaxation Time Measurement Electronics †

by
Najlaa K. Almazrouei
,
Michael I. Newton
* and
Robert H. Morris
School of Science and Technology, Nottingham Trent University, Clifton Lane, Nottingham NG11 8NS, UK
*
Author to whom correspondence should be addressed.
Presented at the 6th International Electronic Conference on Sensors and Applications, 15–30 November 2019; Available online: https://ecsa-6.sciforum.net/.
Proceedings 2020, 42(1), 1; https://doi.org/10.3390/ecsa-6-06645
Published: 14 November 2019

Abstract

:
Advances in permanent magnet technology has seen more reports of sensor applications of low field magnetic resonance. Whilst most are either in the 10–20 MHz range or in the earth’s field, measurements at below 1 MHz are beginning to become more widespread. This range is below the need for careful radio frequency electronics design but above the audio domain and represents an interesting cross over. Many commercial spectrometers do not include the pulse power amplifier, duplexer and preamplifier as these depend on the frequency range used. In this work we demonstrate that, with the current specifications of the humble operational amplifier, the most simple form of an inverting design using only two resistors and decoupling, can effectively provide this ‘front end’ electronics. The low powers used mean crossed Ge diodes provide an excellent duplexer and it is suitable for battery powered applications.

1. Introduction

Nuclear magnetic resonance (NMR) finds many applications from the chemical finger prints of NMR spectroscopy [1] to the whole body magnetic resonance imaging (MRI) scanners found in many hospitals [2]. Two of the parameters that can be used in the production of MRI images are the spin-lattice (T1) and spin-spin (T2) relaxation times and measurements of these have been used in a wide variety of sensor applications that may use permanent magnets and less expensive electronics [3,4,5]. The electronics, commonly referred to as the console, for pulsed NMR systems are designed to be wide band and highly programmable spectrometers with only the power amplifier, duplexer and preamplifier specific to a narrow frequency range [6]. Off the shelf electronics for the power amplifier and preamplifier are often designed to be capable of handling much wider frequency ranges than are required for a specific application and for high power than required, which in turn requires more careful and expensive design of the duplexer. A typical system of off the shelf components may consist of a ZHL-3A+ power amplifier from Mini-Circuits (US$229) fed to the input to an nmr-service.de transcoupler (duplexer) that operates from 0.7 to 1 MHz (US$735) and the return signal amplified using a Mini-Circuits ZFL-500LN (US$93) giving a cost of more than US$1000. Advances in permanent magnet technology has seen report of applications of low field unilateral magnets below 20 mT corresponding to frequencies below 1 MHz [7]. In this work we demonstrate that the current generation of operational amplifiers, in the form of a simple inverting design, can effectively provide the power and preamplifiers in this frequency range and at a fraction of the cost of commercial components.

2. Materials and Methods
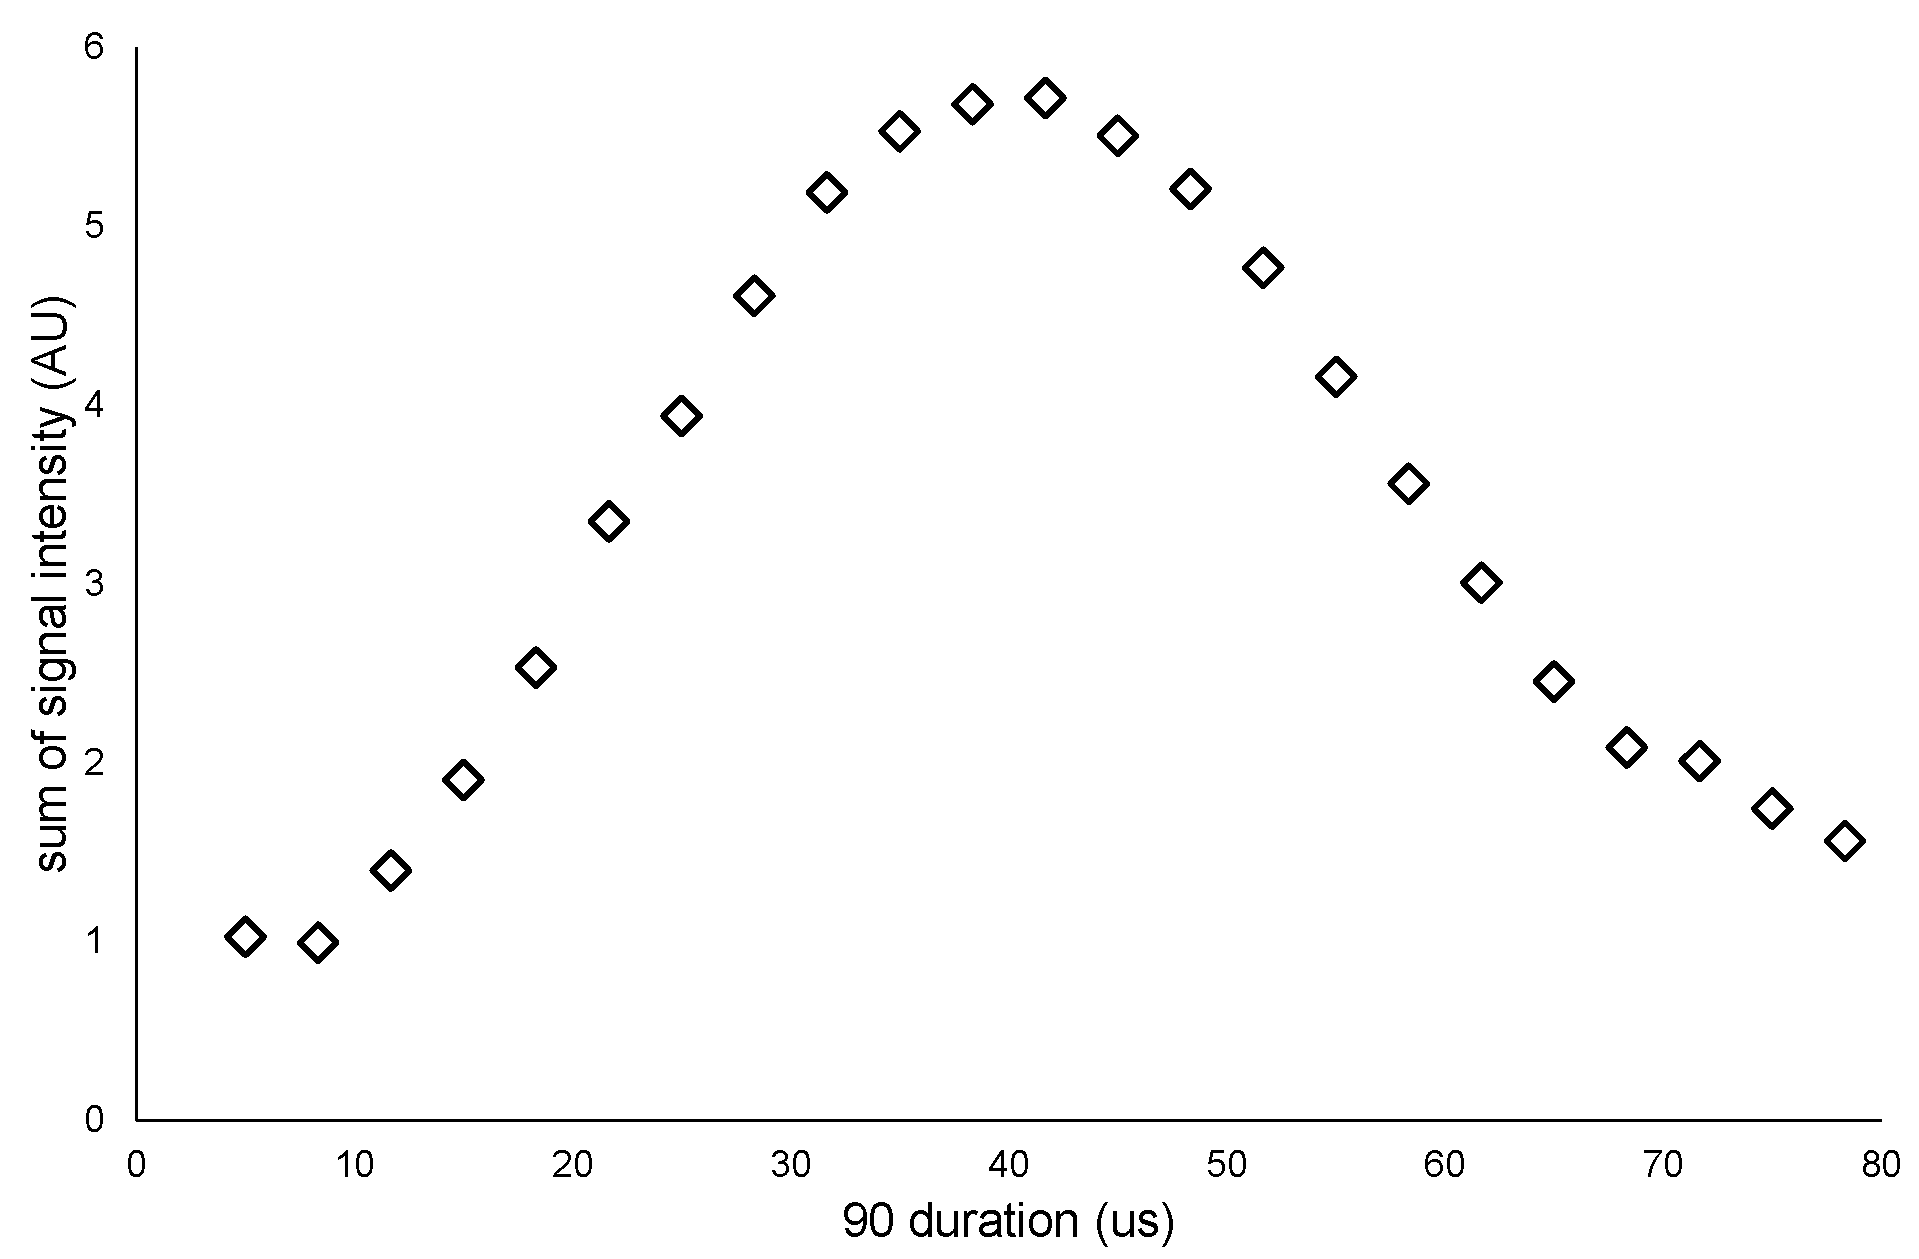
The schematic diagram of the power amplifier, duplexer and preamplifier circuits are shown in Figure 1. The signal produced by the Spincore RadioProcessor board [8] is fed via a decoupling capacitor to a simple inverting opamp circuit using a Linear Technology LT1363 [9]. This opamp has a 70 MHz gain bandwidth product and can operate from a +15 V to −15 V supply. To produce the supply voltages of both amplifiers we used a pair of TRACO POWER TSRN 1-24150 dc to dc converter/switching regulators. This allowed a single dc supply of between 16.5 V and 42 V to be used, making it suitable for battery power applications. The resistors used in the amplifier gave a gain of around 12 and a bandwidth of 5.7 MHz. The output of the amplifier was decoupled and fed to a pair of back to back Ge diodes, forming part of the duplexer, which effectively disconnects the transmitter output from the tuned circuit and preamplifier during the receive part of the sequence to prevent leakage signal from the rf output of the SpinCore entering the detection circuit [6]. The sample was placed in a coil which formed part of a tuned circuit with a tuning and matching capacitor and set to give a resonant frequency of 0.808 MHz. The coil was placed in between the poles of an electromagnet that could have the field changed by means of a dc constant current power supply; the correct field for the resonant frequency used was generated by a current of 0.335 A.
The NMR signal returning from the coil is orders of magnitude smaller than the signal from the LT1363. To protect the preamp a pair of back to back Ge diodes were connected to ground so that the maximum input to the preamp was limited to 0.2 V; note that this is more effective protection than the 0.6 V offered by Si diodes. This was fed via a decoupling capacitor to a simple inverting opamp circuit using a Linear Technology LT1222 [10]. This has a 500 MHz gain bandwidth product and again can operate from a +15 V to −15 V supply however it has a smaller current sourcing capability than the LT1363. The resistors used in the amplifier gave a gain of around 340 and a bandwidth of 1.47 MHz which effectively acts like a low pass filter for reducing high frequency noise returning to the Spincore. The circuit was tested with ThorLabs EF508 1 MHz low pass filters on the input and output of the LT1222, these were found to make little difference.
The height and diameter of the coil were both 20 mm and made up of 3 layers of 30 turns of Litz wire. The Litz wire had 81 strands of 0.04 mm diameter copper wrapped in silk giving an overall wire diameter of 0.67 mm. A sample tube of 14 mm diameter was filled with olive oil as the test liquid used for all the measurements. For all measurement a CPMG sequence was used with the amplitude of the 180 pulses being twice the amplitude of the 90 pulse but of the same duration.

3. Results

Figure 2 shows an echo train of 32 spin echoes with TE of 3500 µs, TR of 312 ms, operating at 0.808 MHz with a CPMG sequence [11] and with 1024 averages. A fit to the echo peaks will give a value for T2 (effective) and a usable value for this could be achieved using an order of magnitude less averages than presented. Note that, as is often the case for low frequency pulsed NMR the initial Hahn echo is slightly smaller than the subsequent echo.
Figure 3 shows a find 90 optimization plot where the signal integral is measured over a range of time values for the pulse length. In this case the TE was 1500 µs, TR 248 ms and 128 averages for the 32 echoes. The peak represents the optimum value to be used for the pulse length and in this case is 40 µs. Initially we tried an LT1222 as the power amplifier from a +12 V and −12 V power supply and for this the optimum 90 was found to be 45 µs indicating that as expected when the power is increased, the required 90 is reduced. Using the optimum length for the 90 we can then provide an estimate to T1 by running an integral, like the find 90, but with changing repetition time TR and fitting an exponential to the data. In Figure 4 we show this with TR from 25 ms to 700 ms, again with 32 echoes and 128 averages per point.

4. Discussion

In the frequency range just below 1 MHz we have demonstrated that we can still get excellent results with much lower power, compared to commercial amplifiers, with the use of simple opamp circuits making it very applicable to battery powered applications. The data we have presented used a reasonably homogeneous magnetic field from a laboratory electromagnet. For fully battery operated applications this would need to use permanent magnets which may give less homogeneity and may then require greater power amplification that can currently be provided by the LT1363. The component cost of both amplifier circuits total less than US$20 compared to more than US$1000 for off the shelf radio frequency specified commercial components that also cover this frequency range. In addition, there is no requirement for additional low pass filtering as the bandwidth of the amplifier circuit itself excludes passing radio frequencies.

Author Contributions

Conceptualization and Methodology, M.I.N. and R.H.M.; Software, R.H.M.; Investigation, M.I.N. and N.K.A.; Writing-Original Draft Preparation, M.I.N.; Writing-Review & Editing, R.H.M. and N.K.A.

Funding

N.K.A. gratefully acknowledges the Ministry of Higher Education and Scientific Research (MOHESR) in the United Arab Emirates for funding and the Dubai Health Authority (DHA) for study leave.

Conflicts of Interest

The authors declare no conflict of interest.

References

  1. Weber, U.; Thiele, H. NMR Spectroscopy: Modern Spectral Analysis, 1st ed.; Wiley VCH: Weinheim, Germany, 1998. [Google Scholar]
  2. Dale, B.M.; Brown, M.A.; Semelka, R.C. MRI: Basic Principles and Applications; Wiley-Blackwell: Hoboken, NJ, USA, 2015. [Google Scholar]
  3. Blumich, B.; Perlo, J.; Casanova, F. Mobile single-sided NMR. Prog. Nucl. Magn. Reson. Spectrosc. 2008, 52, 197–269. [Google Scholar] [CrossRef]
  4. Blümich, B. Introduction to compact NMR: A review of methods. Trends Anal. Chem. 2016, 83, 2–11. [Google Scholar] [CrossRef]
  5. Kirtil, E.; Cikrikci, S.; McCarthy, M.J.; Oztop, M.H. Recent advances in time domain NMR & MRI sensors and their food applications. Curr. Opin. Food Sci. 2017, 17, 9–15. [Google Scholar] [CrossRef]
  6. Fukushima, E.; Roeder, S.B.W. Experimental Pulse NMR: A Nuts and Bolts Approach, 1st ed.; Westview Press: Boulder, CO, USA, 1981. [Google Scholar]
  7. Dabaghyana, M.; Muradyan, I.; Hrovat, A.; Butler, J.; Fredrick, E.; Zhou, F.; Kyriaziz, A.; Hardin, C.; Patz, S.; Hrovat, M. A portable single-sided magnet system for remote NMR measurements of pulmonary function. NMR Biomed. 2014, 27, 1479–1489. [Google Scholar] [CrossRef] [PubMed]
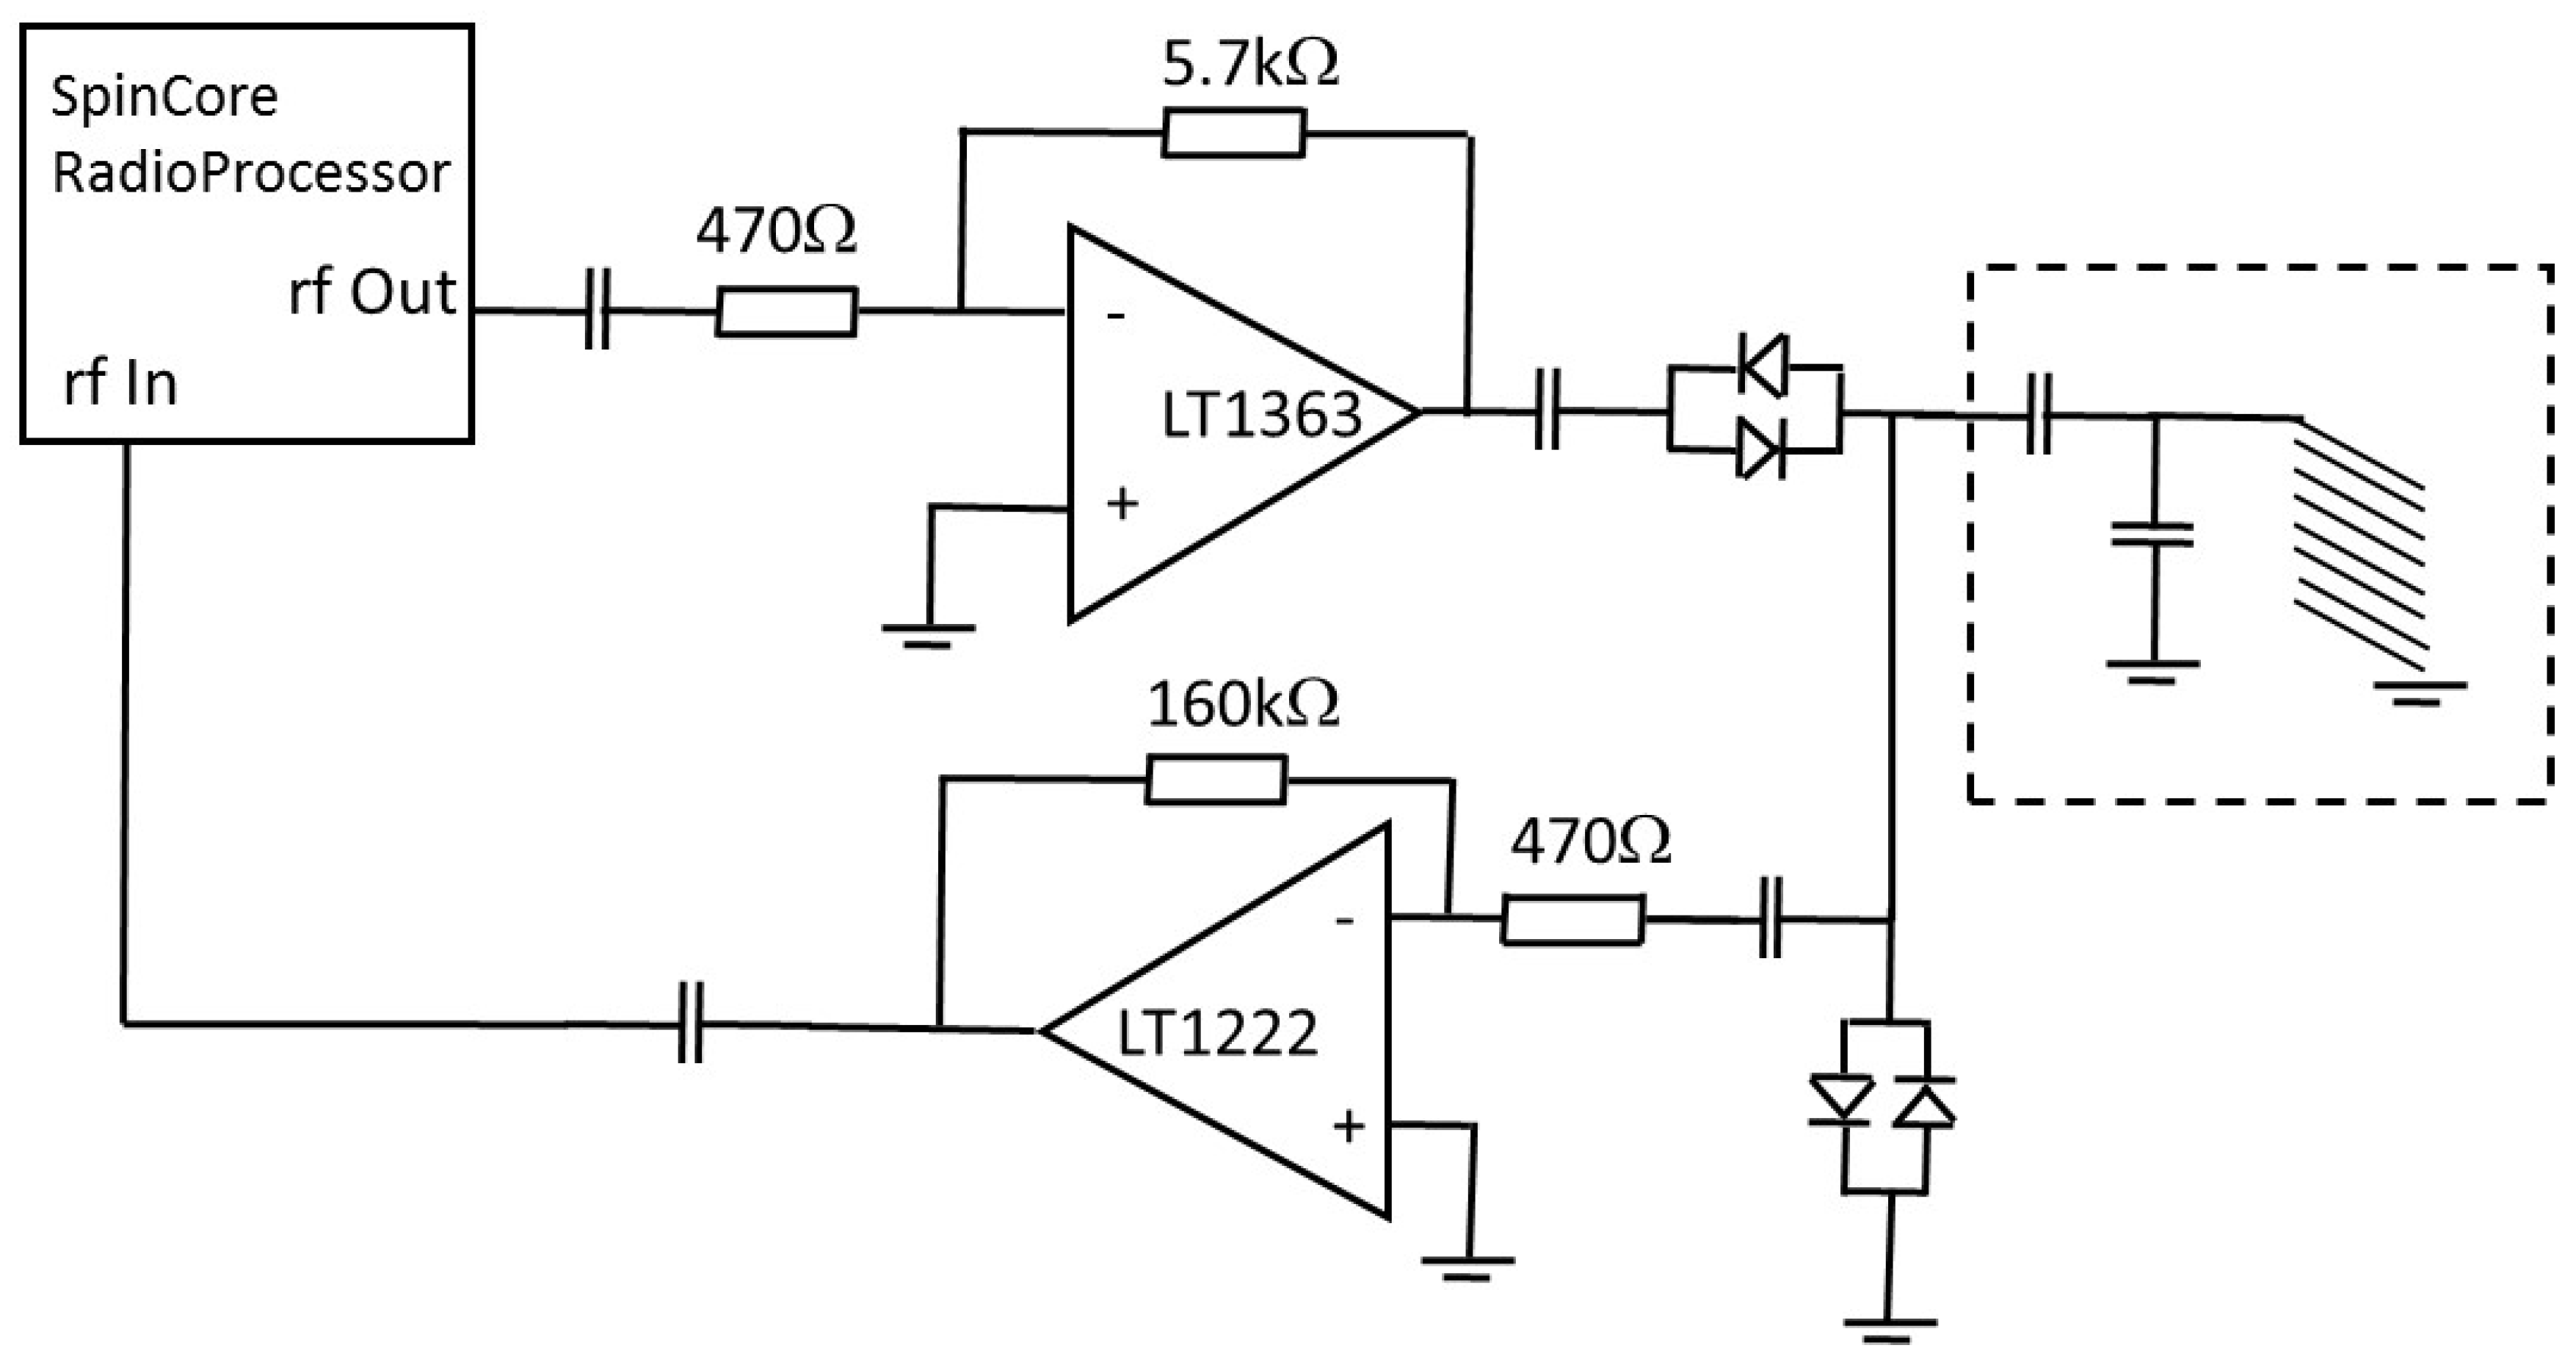
  8. SpinCore RadioProcessor Board. Available online: http://www.spincore.com/products/RadioProcessor/ (accessed on 27 February 2019).
  9. LT1363 Data Sheet. Available online: https://www.analog.com/media/en/technical-documentation/data-sheets/1363fa.pdf (accessed on 28 February 2019).
  10. LT1222 Data Sheet. Available online: https://www.analog.com/media/en/technical-documentation/data-sheets/1222fc.pdf (accessed on 28 February 2019).
  11. Meiboom, S.; Gill, D. Modified Spin-Echo Method for Measuring Nuclear Relaxation Times. Rev. Sci. Instrum. 1958, 29, 688. [Google Scholar] [CrossRef]
Figure 1. Schematic diagram of the power amplifier, duplexer and preamplifier circuits. All capacitors are 0.1 µF and the diodes are Ge. The dotted line marks the sample coil with the tuning and matching circuit. Both amplifiers are powered with +15 V and −15 V from dc-dc converters.
Proceedings 42 00001 g001
Figure 2. A series of spin echoes measured using the opamp electronics. A fit to the peaks provides an estimate for the value of T2 (effective).
Proceedings 42 00001 g002
Figure 3. A calibration of the duration of the 90 pulse length showing the optimum value at 40 µs.
Proceedings 42 00001 g003
Figure 4. The signal intensity as a function of repetition time. A fit to the data can be used to give an estimate for the spin lattice relaxation time T1.
Proceedings 42 00001 g004
Publisher’s Note: MDPI stays neutral with regard to jurisdictional claims in published maps and institutional affiliations.

