Proceeding Paper

Microwave Assisted Extraction, Fractionation, Total Phenolic and Flavanoid Estimation and Antioxidant Potential of Annona reticulate Leaves †

1
Konkan Gyanpeeth Rahul Dharkar College of Pharmacy and Research Institute, Karjat, Dist: Raigad, Maharashtra 410201, India
2
Hon’ble LoksevakMadhukarrao Chaudhari College of Pharmacy, Faizpur, Dist: Jalgaon, Maharashtra 425503, India
*
Author to whom correspondence should be addressed.
Presented at the 23rd International Electronic Conference on Synthetic Organic Chemistry, 15 November–15 December 2019; Available online: https://ecsoc-23.sciforum.net/.
Proceedings 2019, 41(1), 33; https://doi.org/10.3390/ecsoc-23-06608
Published: 14 November 2019

Abstract

:
The present study focuses on the microwave assisted extraction of Annona reticulata leaves in ethanol. The extract obtained was subjected to column chromatography and the fractionation was done to get different fractions. Preliminary phytochemical screening was done and the fractions were subjected to total phenolic and flavanoid content estimation. The crude extract contained 502 mg GAE/100 g of phenolic content and among the fractions AM8 contained the maximum amount of phenolic content that is 360 mg GAE/100 g. The flavanoid content present in the crude extract of the Annona reticulata was found to be 127 mg QE/100 g. Among all the tested fractions, the fraction AM8 showed more flavanoids i.e., 112 mg QE/100 g and 118 AN/100 g. The antioxidant activity has been studied in-vitro by using DPPH, hydrogen peroxide assay. DPPH, H2O2 and Nitric-oxide scavenging effect of Annona reticulata L. leaf extracts were found to be dose dependant with maximum inhibition at highest concentration. Methanolic extract of the leaves of Annona reticulata Linn. is found to have most potent anti-oxidant activity in DPPH, H2O2 Radical scavenging methods. IC50 value DPPH and H2O2 inhibition of methanolic extract at highest concentration (400 μg/mL) are 62.58 ± 1.15, 68.27 ± 1.05 and 64.01 ± 1.02. The results suggest that all the tested extracts are having antioxidant property, but the methanol is having significantly higher flavonoid and phenol content. Due to presence of higher flavonoid and phenol content in methanol, it may be considered as the fraction with better pharmacological property in comparison to other tested extracts.

1. Introduction

Flavanoids are the largest group of naturally occurring phenolic compounds. They occur both in free state and as glycosides. Flavones and flavonols are widely distributed. They have a wide variety of biological activities. Flavanoids act as antioxidants acting against degeneration, cardiovascular disorders and also inhibit tumor development in animal models. Some are acting as heart stimulant [1]. They scavenge the free radicals such as superoxide and hydroxyl radicals.
Annona reticulata belongs to the family Annonaceae. It is also known as ‘custard apple’. For the extraction of secondary metabolites from plants microwave assisted extraction is playing an important role. Microwave Assisted Extraction (MAE) can be used for the extraction of functional group. Here microwave energy is absorbed by the molecules. Strong penetrating force, high selectivity, high heating ability, less extraction time, reduced solvent consumption and energy requirements are the main advantages of this method [2,3]. The application of microwave assisted extraction of secondary metabolites from plants also have been published [4,5].
The leaves of A. reticulata and Allium sativum (bulbs) were collected from regions of Karjat Dist-Raigad, Maharashtra, India in December–January 2018–2019. Plant materials were authenticated at “The Blatter Herbarium” -St. Xavier’s College, Mumbai.

2. Materials and Methods

Plant Material

The leaves of A. reticulata and Allium sativum (bulbs) were collected from regions of Karjat Dist-Raigad, Maharashtra, India in December–January, 2018–2019. Plant materials were authenticated at “The Blatter Herbarium” -St. Xavier’s College, Mumbai.
After identification and authentication of the plant, leaves of the plant were collected for the experimental process. The leaves were shade dried, made into coarse powder and the powdered material was initially defatted with petroleum ether and then subjected to cold maceration process for 60h using same proportions of mixture of methanol and water as solvent to prepare hydro-alcoholic extract of Annona reticulata leaves (percentage yield 20.5% w/w with respect to dried powder). [6] The extract was filtered and concentrated by rotary evaporator. For the preparation of different fractions method was used [7,8,9].
The sun dried and powdered leaves (76 g) of A. reticulata were successively extracted in a Soxhlet extractor at elevated temperature using 200 mLof distilled n-hexane (40–60) °C which was followed by petroleum ether, methanol, and chloroform. All extracts were filtered individually through filter paper and poured on petri dishes to evaporate the liquid solvents from the extract to get dry extracts. The dry crude extracts were weighed and stored in air-tight container with necessary markings for identification and kept in a refrigerator for future investigations.
Isolation of the compounds through column chromatography started by using 20 g of the extract. A slurry of the extract was prepared in ethanol and the extract was uniformly packed over drysilica gel (mesh size 230–400, 20 g). Petroleum ether, Petroleum ether: ethyl acetate (4:3, 3:2, 2:3 and 1:4), ethyl acetate, ethyl acetate: methanol (4:3, 3:2, 2:3 and 1:4), acetone and methanol such different solvents in different ratios were used as the mobile phase. Similar small fractions were collected in small test tubes. TLC (silica gel F254) of all individual fractions were developed. It was then viewed under UV chamber. Based on the TLC results similar fractions were pooled. The fractions were dried in rotavapor under reduced pressure at a temperature of about 40 ± 5°. Such 10 combined fractions were collected. Preliminary phytochemical screening was done by using the extract and fractions by standard methods [6].

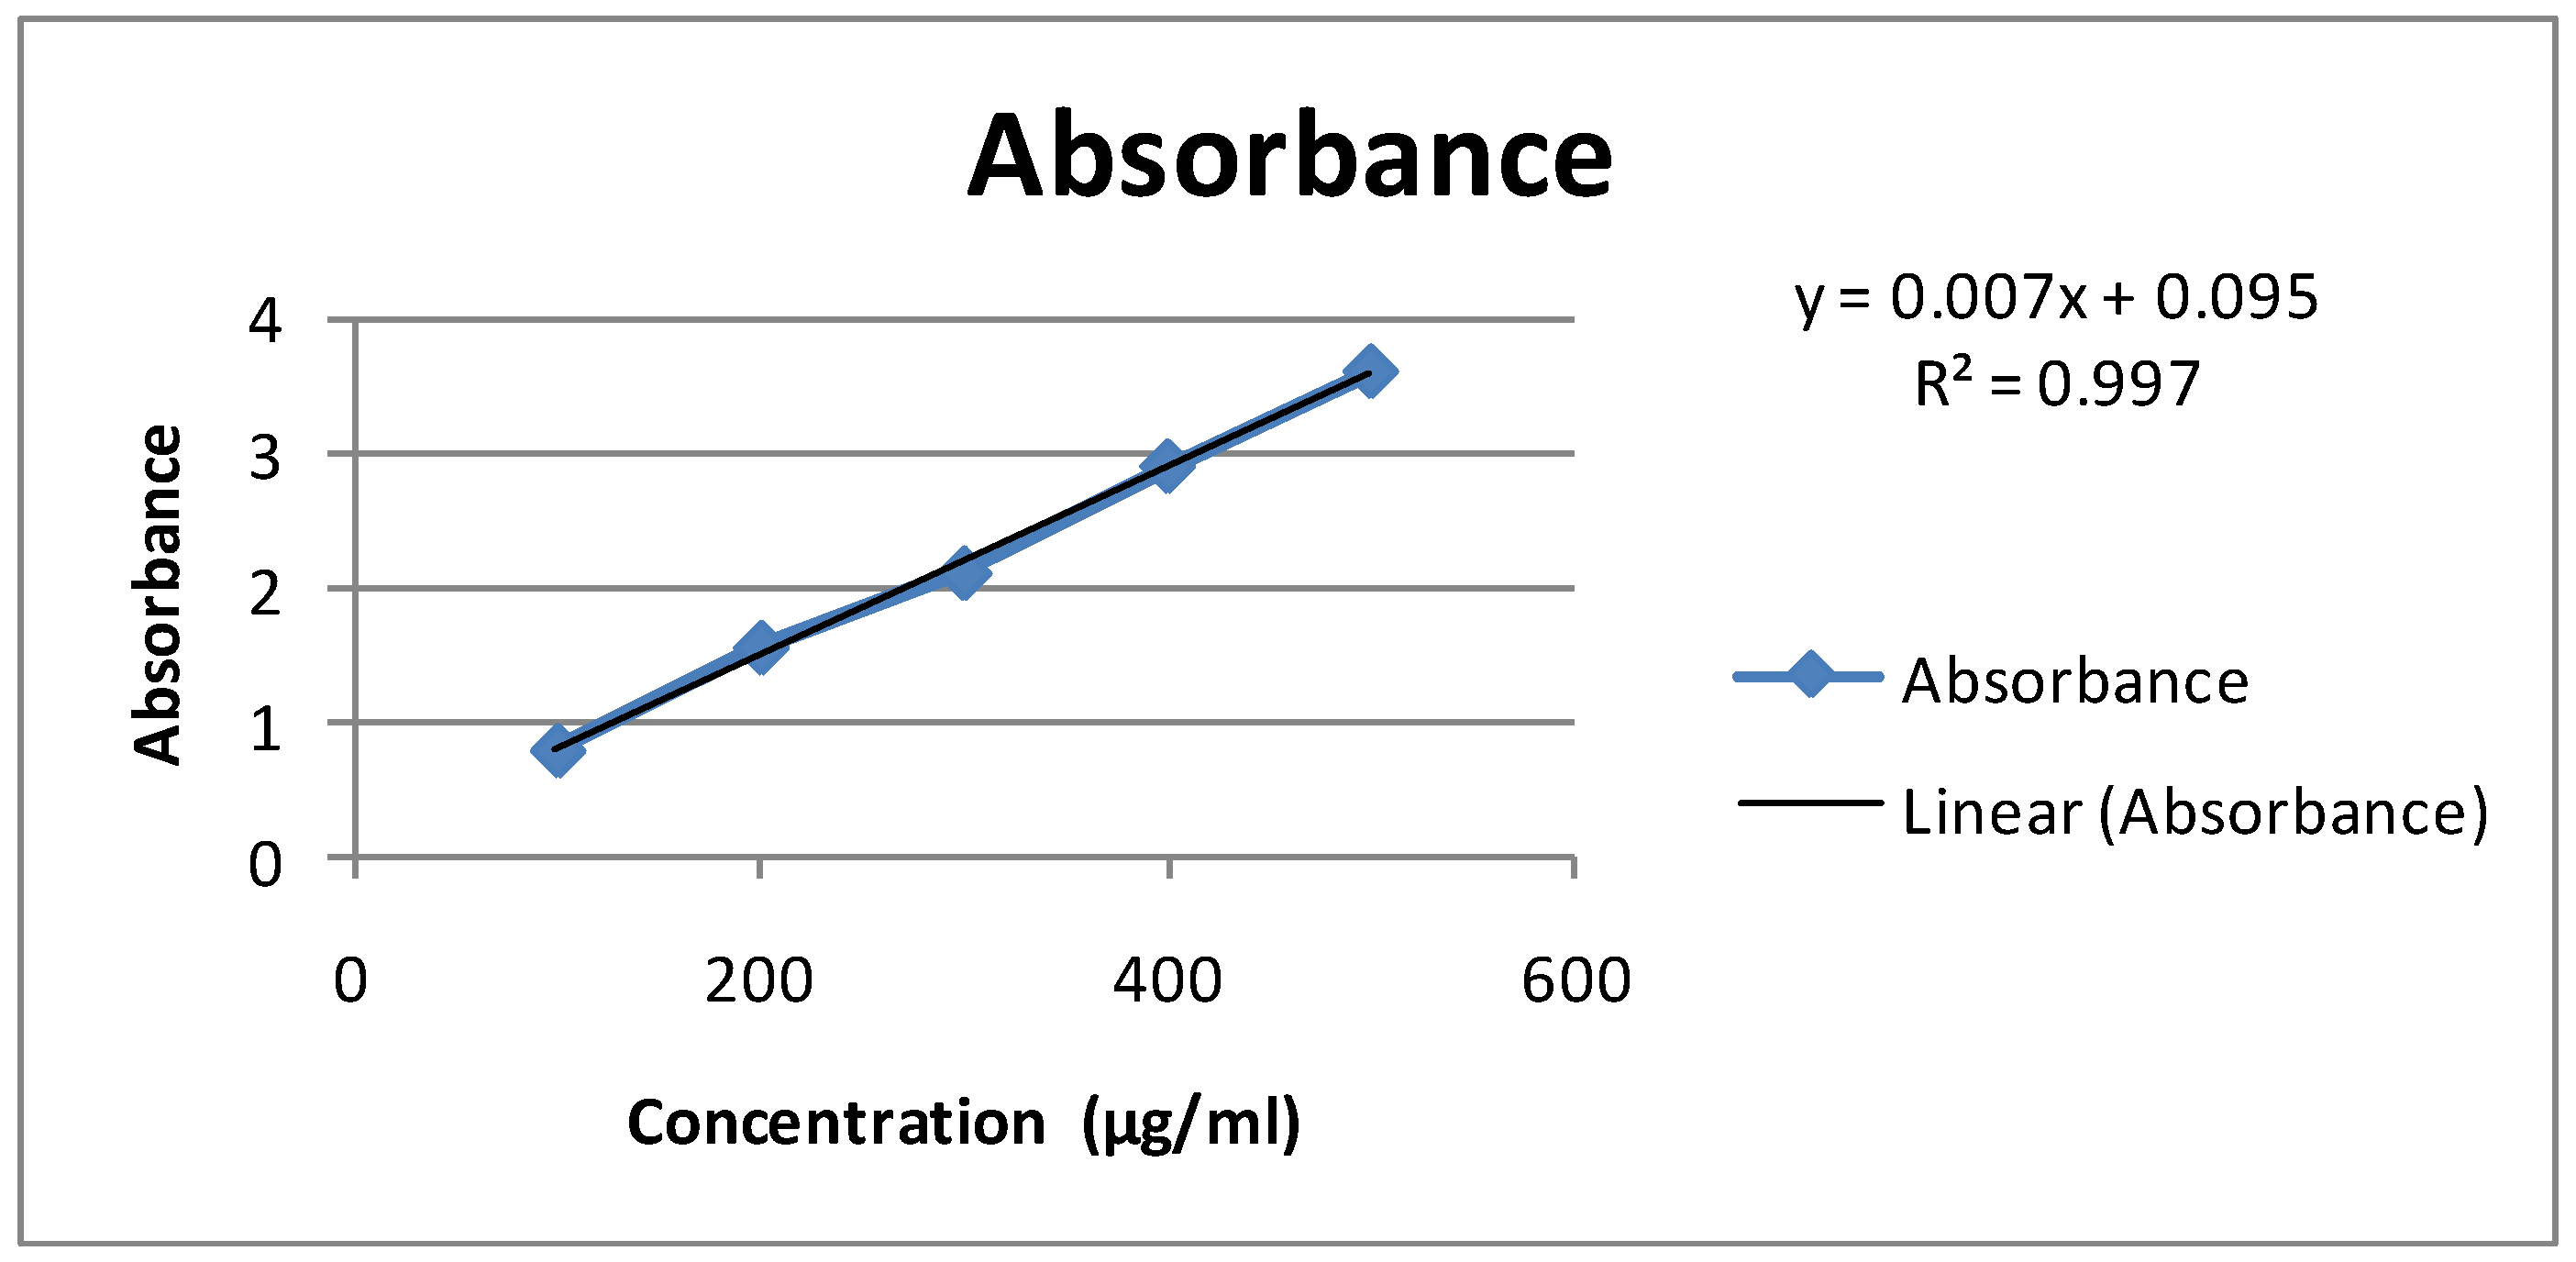
3. Determination of Total Phenolic Content

Folin-ciocalteau reagent was used for the determination of total phenolic content and the standard used was gallic acid. The reagent (5 mL) was mixed with 1ml of gallic acid at different concentrations and after 3 min 4 mL of 2% sodium carbonate was added to each solution. After 30 min blue colour was developed. It was then read at 760 nm. Different concentrations of the sample extract were treated in the similar manner. The test was repeated thrice. The concentration of the total phenol was expressed as mg/g of dry extract.

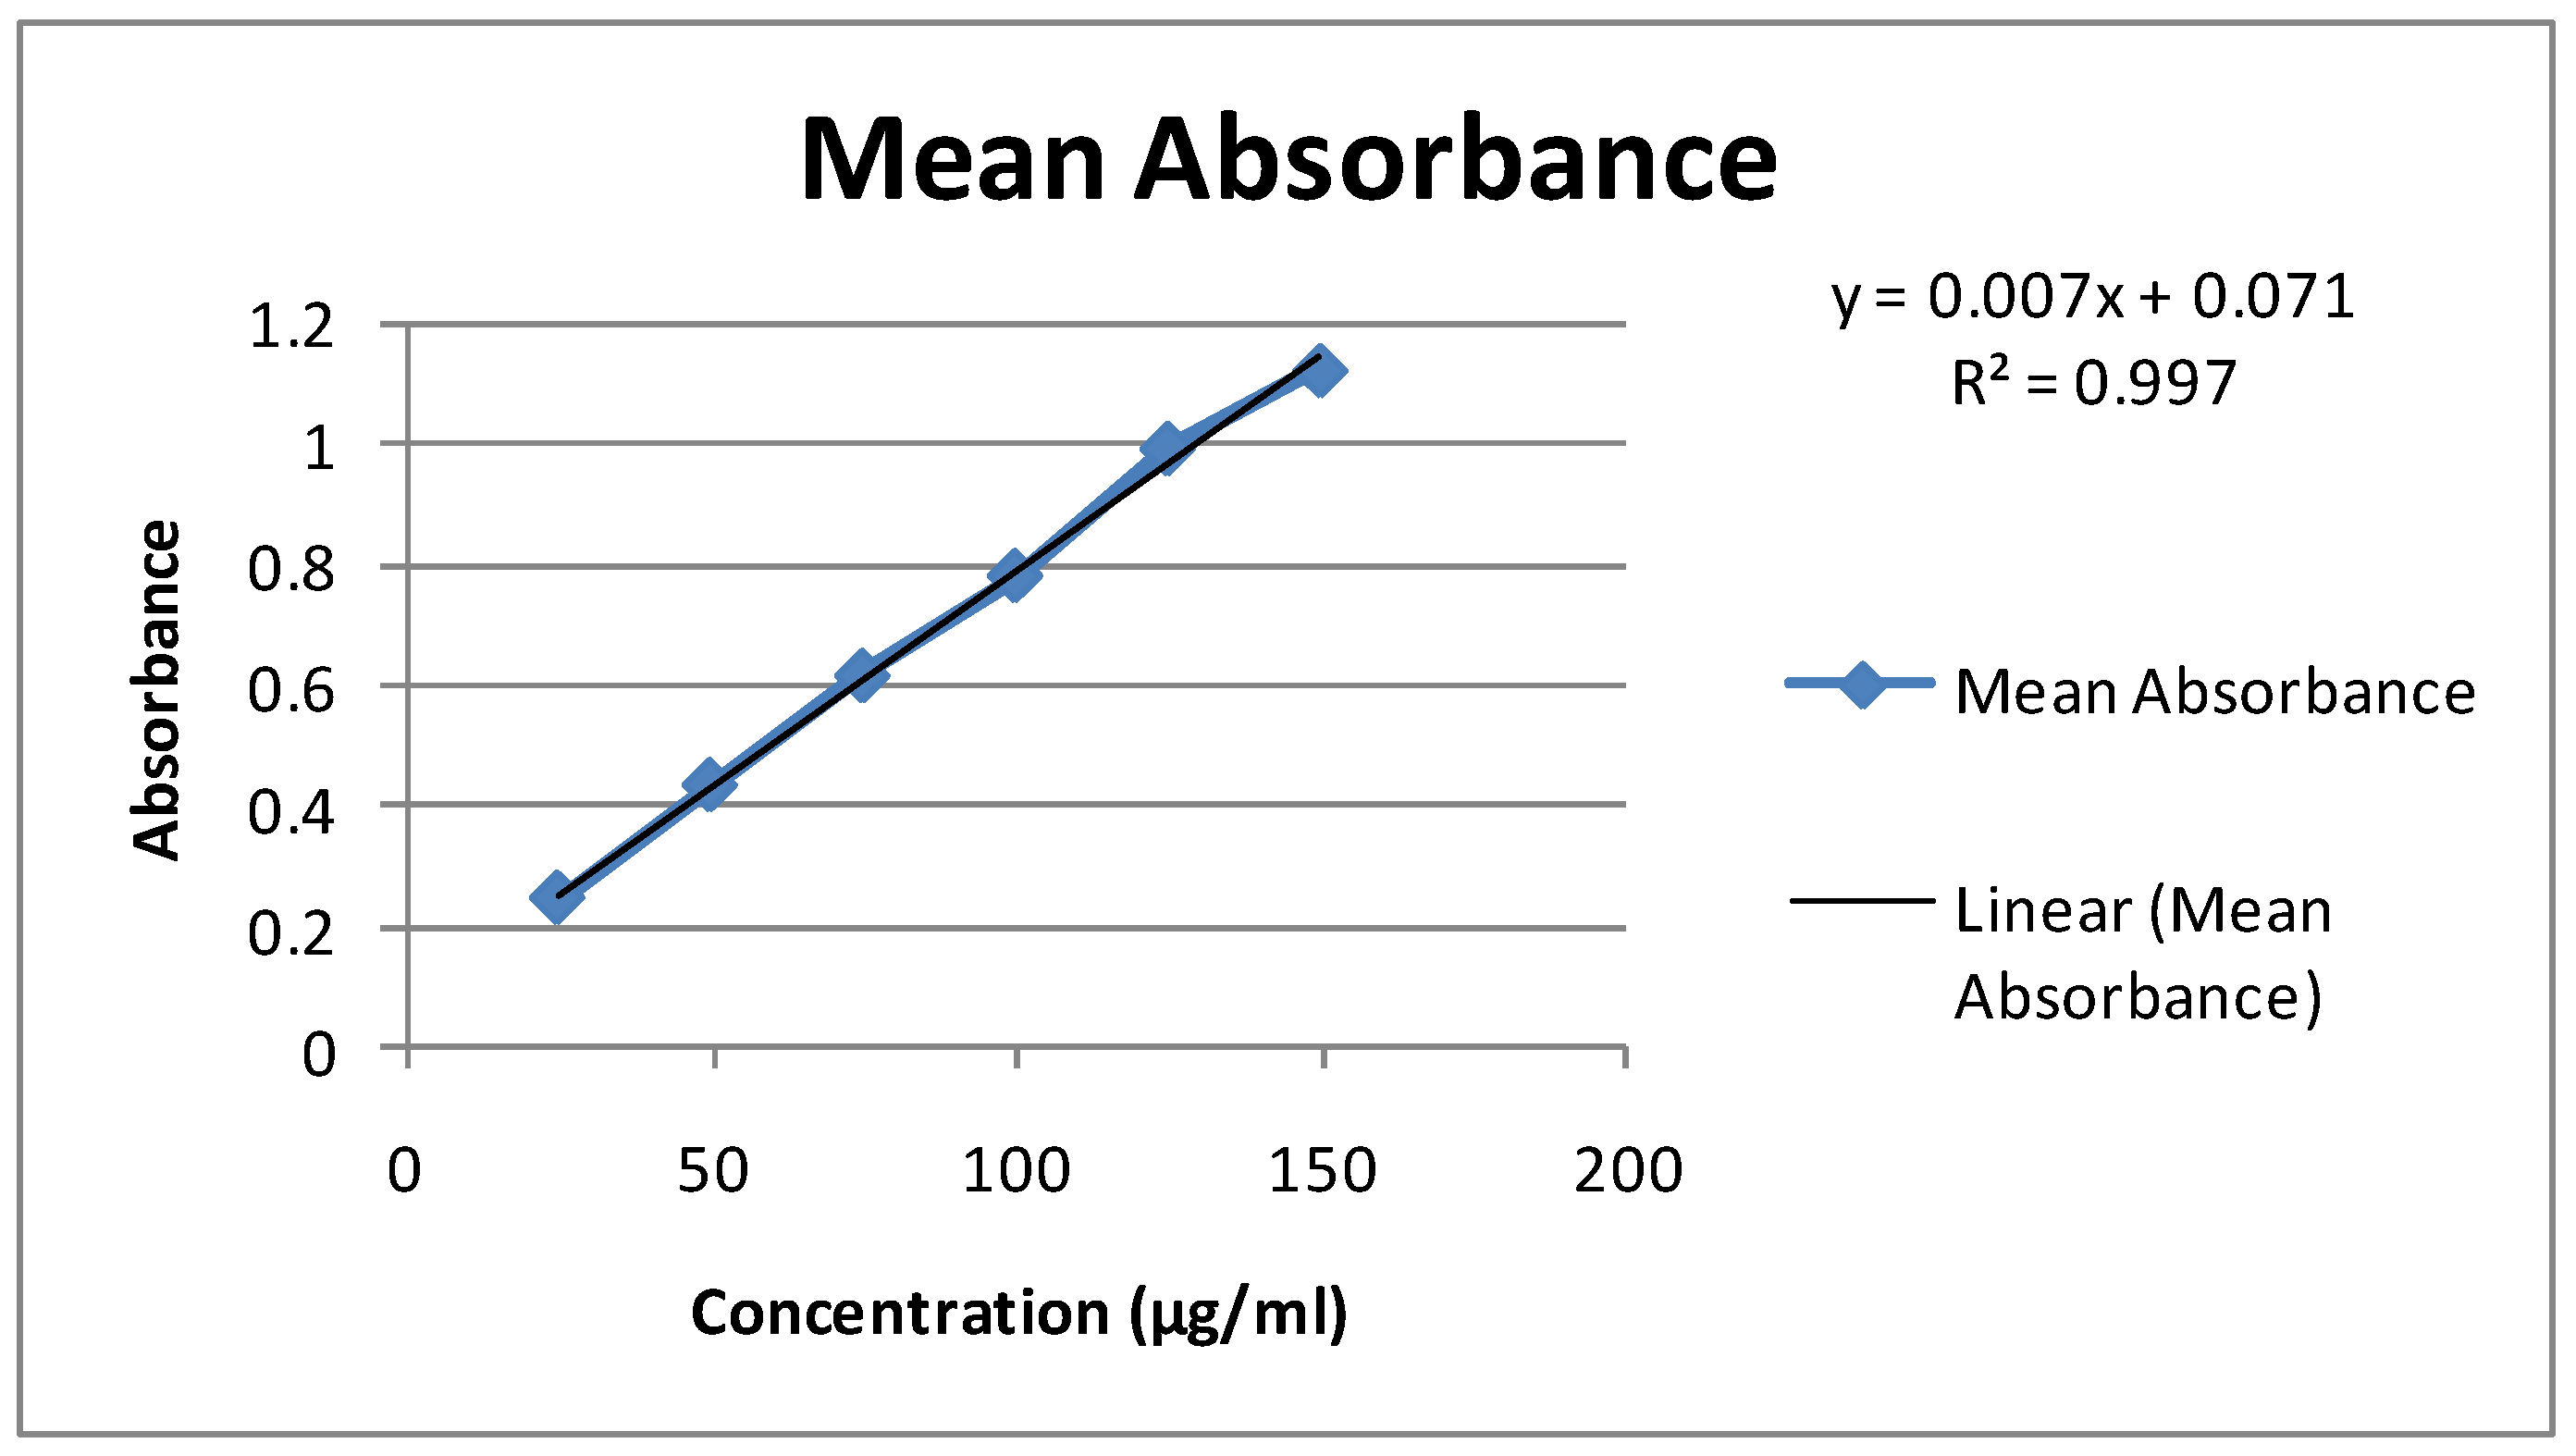
3.1. Determination of Total Flavanoids

Total flavanoid content was determined by aluminium chloride colorimetric assay [7]. Distilled water (4 mL) was taken in 10 mL of volumetric flask and an aliquot quantity of extract (1 mL) or standard solution of quercetin (25–150 µg/mL) was added to it. Sodium nitrite 5% (0.3 mL) was added and after 5 min, 0.3 mL of 10% aluminium chloride was added. After 5 min, 2 mL of 1M sodium hydroxide was added and the volume was made up to 10 mLwith distilled water. The solution was mixed well and the absorbance was measured against the blank at 510 nm. The total flavanoid content was expressed as mg quercetin equivalents (QE) and as mg quercetin equivalents (AN).

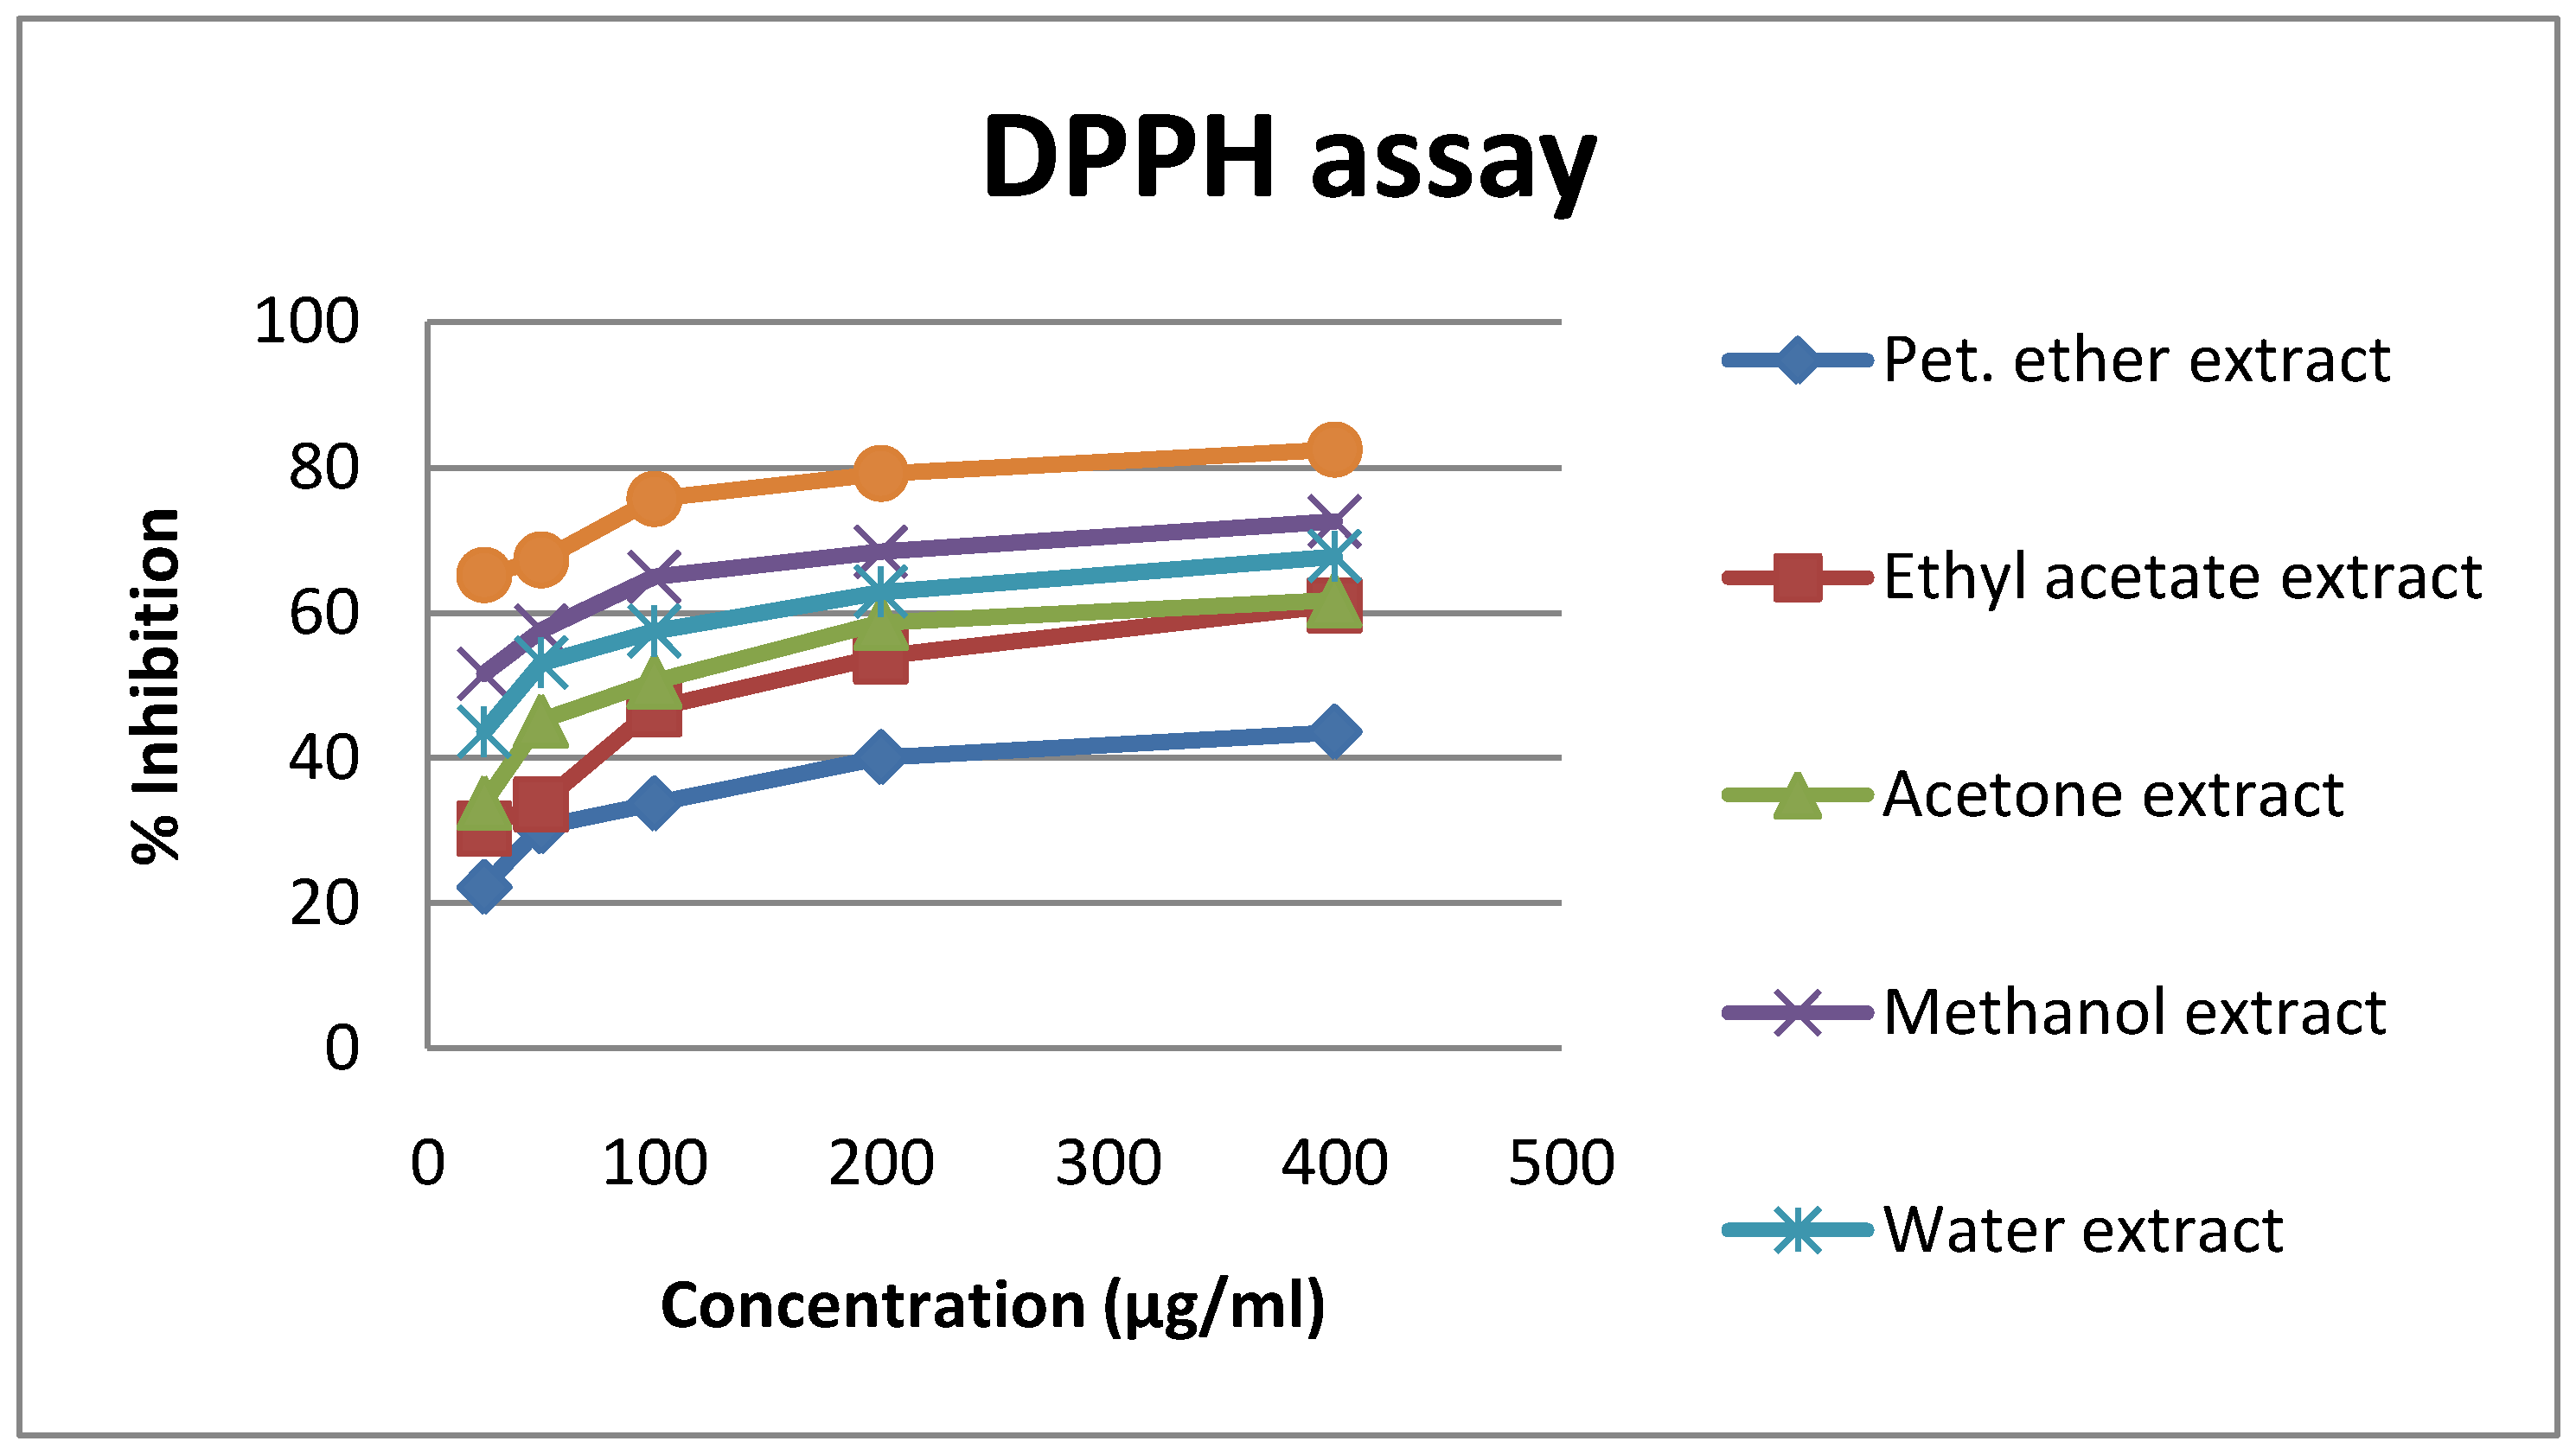
3.2. Evaluation of Anti-Oxidant Activity

3.2.1. DPPH Radical Scavenging Activity

The DPPH (1,1-Diphenyl-2-picrylhydrazyl) assay method is based on the reduction of DPPH, a stable free radical. The free radical DPPH with an odd electron gives a maximum absorption at 517 nm (purple color). When Antioxidants react with DPPH, which is a stable free radical becomes paired off in the presence of a hydrogen donor (e.g., a free radical-scavenging antioxidant) and is reduced to the DPPH and as consequence the absorbance’s decreased from the DPPH.
The stock solution of extracts and ascorbic acid (standard compound) were prepared in methanol to achieve the concentration of 1 mg/mL, then it was diluted to different concentration. 1 mL each of the diluted solutions were in a test tube and mixed with 1 mL of methanolic solution of DPPH in concentration of 1 mg/mL. After 30 min incubation in darkness at room temperature, the absorbance was recorded at 517 nm.

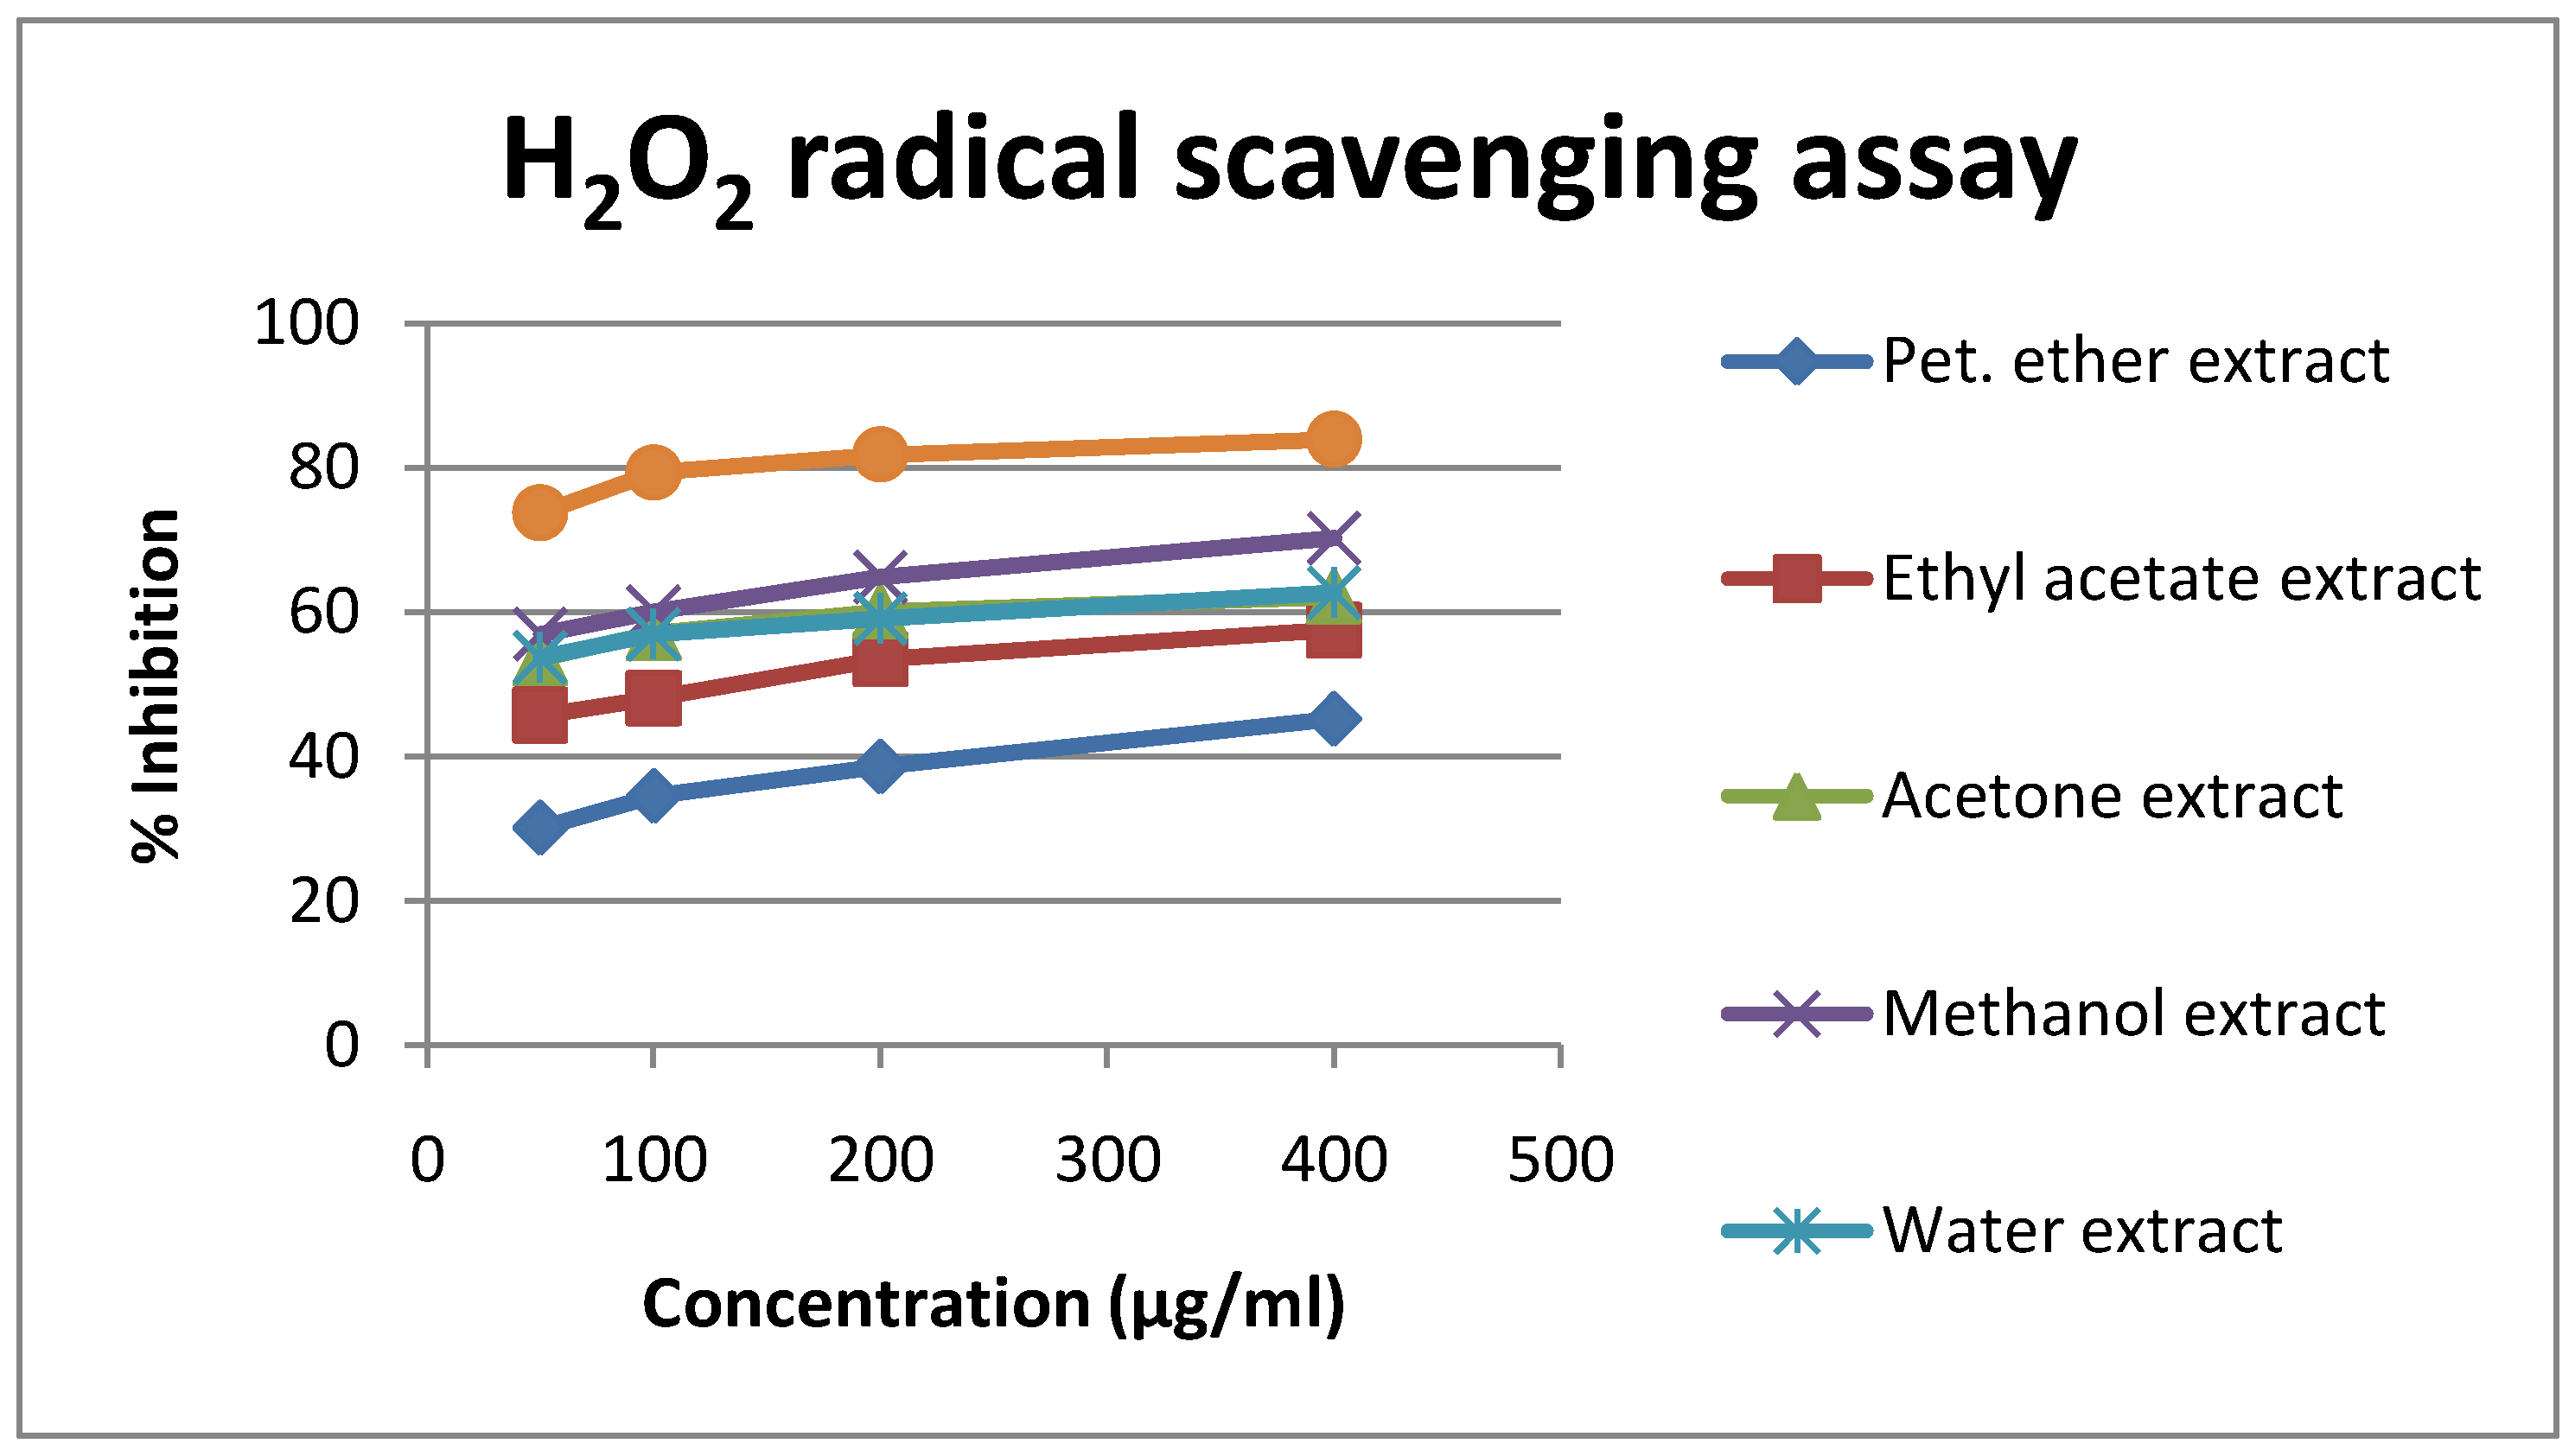
3.2.2. Hydrogen Peroxide Scavenging Activity

The ability of the extracts to scavenge hydrogen peroxide was determined according to the method of Ruch et al., (1989). A solution of hydrogen peroxide (40 mM) was prepared in phosphate buffer (pH 7.4). Extracts (100 μg/mL) in distilled water were added to a hydrogen peroxide solution (0.6 mL, 40 mM). Absorbance of hydrogen peroxide at 230 nm was determined 10 min later against a blank solution containing the phosphate buffer without hydrogen peroxide.

4. Results

In the present study the extraction of the plant Annona reticulata was carried out by microwave assisted method and the fractionation was done by column chromatography using petroleum ether, chloroform and ethanol at different ratios (Table 1). At different concentrations of gallic acid absorbance was calculated (Table 2) and the standard graph was plotted (Figure 1).
Total phenolic content present in the extract and the fractions were calculated from the standard graph of the gallic acid. The results are shown in table (Table 3). It was found that the fraction AM 8 contained more amounts of the phenolic constituents. At different concentrations of quercetin and anonaine, absorbances were calculated (Table 4 and Table 5) and the calibration curve of quercetin and anonaine was plotted (Figure 2) and (Figure 3) respectively. The total flavanoid content of the extract and the fractions were calculated from the standard graph of quercetin and was expressed as mg quercetin equivalents (QE). The results are shown in the table (Table 5, Table 6 and Table 7).

5. Discussion

A wealth of studies had been conducted on Annona reticulata leaves due to various activities. But the promising activity is the anticancer effect. But most of the activities are concentrating on the extracts obtained from it. So the present study focused by using the fractions obtained from the extracts.
The microwave assisted method of extraction used in the present study is a widely accepted method for the removal of active components from the crude drug. The method helped to save time and the amount of solvents used. The literatures describe as the presence of phenolic content is the important criteria which attributes for many activities of the plant materials.
It is commonly known that the phenolic constituents and the flavanoids are related to various biological activities. They in turn affects the human health. So the present study was focused on the determination of total phenolic and flavanoid content. Since the ethanol extract and the fractions of Annona reticulata are showing more amount of phenolic and flavanoid (Table 7, Table 8 and Table 9) (Figure 4 and Figure 5), this may show various biological activities including the anticancer activity.

6. Conclusions

Many plants are showing various pharmacological activities due to the presence of phenolic and flavanoid contents. Annona reticulata is the plant coming under Annonaceae family having wide variety of biological activities. The microwave assisted ethanol extract of Annona reticulata leaves are showing the presence of phenolics and flavanoids. From this study it is clear that the fraction 8 of Annona reticulata ethanol extract is containing more amount of phenolics and flavanoids. So this fraction may show more antioxidant and anticancer activities. This fraction is to be taken for further study for the isolation of active constituents.

Conflicts of Interest

The authors declare no conflict of interest.

References

  1. Harborne, J.B. The Flavanoids: Advances in Research Since 1980; Chapman and Hall Ltd.: New York, NY, USA, 1988; p. 121. [Google Scholar]
  2. Gao, S.; Weiand, H.; Deng, X. Study of the mechanism of microwave-assisted extraction of Mahonia bealei Fort leaves and chrysanthemum morifolium (Ramat.) petals. Flavour Frag. J. 2004, 19, 244–250. [Google Scholar] [CrossRef]
  3. Kerem, Z.; German-Shashouaand, H.; Yarden, O. Microwave- assisted extraction of bioactive saponinsfrom chickpea (Cicer arietinum L.). J. Sci. Food Agric. 2005, 85, 406–412. [Google Scholar] [CrossRef]
  4. Routray, W.; Orsat, V. Microwave-assisted extraction of flavonoids: Areview. Food Bioproc. Technol. 2012, 5, 409–424. [Google Scholar] [CrossRef]
  5. Merin, D.D.; Prakash, S.; Bhimba, B.V. Antibacterial screening of silver nanoparticles synthesized by marine microalgae. Asian Pac. J. Trop. Med. 2010, 3, 797–799. [Google Scholar] [CrossRef]
  6. Trease, G.E.; Evans, W.C. Text Book of Pharmacognosy, 12nd ed.; ELBS Publication: Bailliere Tindall, UK, 1985; pp. 334–345. [Google Scholar]
  7. Zhishen, J.; Mengcheng, T.; Jianming, W. The determination of flavanoid contents in mulberry and their scavenging effect on superoxide radicals. Food Chem. 1999, 64, 555–559. [Google Scholar] [CrossRef]
  8. Bondet, V.; Brand-Williams, W.; Berset, C. Kinetics and Mechanisms of antioxidant activity using the DPPH* free radical method. LWT-Food Sci. Tech. 1997, 30, 609–615. [Google Scholar] [CrossRef]
  9. Brand-Williams, W.; Cuvelier, M.E.; Berset, C. Use of a free radical method to evaluate antioxidant activity. LWT-Food Sci. Technol. 1995, 28, 25–30. [Google Scholar] [CrossRef]
  10. Dharmendra, S.; Manish, M.; Monika, G.; Singh, P.; Gupta, A.; Nema, R. Nitric Oxide radical scavenging assay of bioactive compounds present in methanol Extract of Centella asiatica. Int. J. Pharm. Pharm. Sci. Res. 2012, 2, 42–44. [Google Scholar]
  11. Mcdonald, S.; Prenzler, P.D.; Autolovich, M.; Robards, K. Phenolic content and antioxidant activity of olive oil extracts. Food Chem. 2001, 73, 73–84. [Google Scholar] [CrossRef]
  12. Khatiwora, E.; Adsul, V.B.; Kulkarni, M.M.; Deshpande, N.R.; Kashalkar, R. Spectroscopic determination of total phenol and flavonoid contents of Ipomoea carnea. Int. J. Chem Tech. Res. 2010, 2, 1698–1701. [Google Scholar]
  13. Rathore, K.S.; Panchawat, S.; Sisodia, S.S. A review on herbal Antioxidants. Int. J. PharmTech Res. 2010, 2, 232–239. [Google Scholar]
Figure 1. Standard plot forconcentrations of Gallic acid absorbance.
Proceedings 41 00033 g001
Figure 2. Standard plot for concentration of Quercetin.
Proceedings 41 00033 g002
Figure 3. Standard plot for concentration of anonaine.
Proceedings 41 00033 g003
Figure 4. Comparative effect of leaf graph extracts of A. reticulata linn. (sample) and ascorbic acid on DPPH assay.
Proceedings 41 00033 g004
Figure 5. Comparative effect of leaf graph extracts of A. reticulate linn. (sample) and ascorbic acid on H2O2 radical scavenging assay.
Proceedings 41 00033 g005
Table 1. Preparation of different fraction with various fractions.
Name of Extract FractionFractionsColour and ConsistencyPercentage Yield (% w/w)
AR1Petroleum etherOrange dry mass3.8
AR2Petroleum ether:Ethyl acetate (4:1)Light Green sticky mass4.1
AR3Petroleum ether:Ethyl acetate (3:2)Greenish brown sticky mass3.20
AR4Petroleum ether:Ethyl acetate (2:3)Greenish brown sticky mass3.24
AR5Petroleum ether:Ethyl acetate (1:4)Greenish sticky mass3.16
AR6Ethyl acetateLight Greenish dry mass4.5
AR7Ethyl acetate:Methanol (4:1)Light Greenish dry mass4.1
AR8Ethyl acetate: Methanol (3:2)Light Greenish sticky mass5.2
AR9Ethyl acetate: Methanol (2:3)Greenish brown sticky mass5.4
AR10Ethyl acetate: Methanol (1:4)Greenish brown dry mass4.2
AR11AcetoneGreenish dry mass5.3
AR12MethanolGreenish dry mass5.1
Table 2. Absorbance obtained at different concentrations of gallic acid.
Sr. No.Concentration of Gallic Acid (µg/mL)Absorbance
11000.786 ± 0.0001
22001.548 ± 0.0002
33002.099 ± 0.0001
44002.891 ± 0.0002
55003.594 ± 0.0001
Table 3. Total phenolic content present in Annona reticulata methanol extract and fractions.
Sample ExtractAbsorbanceTotal Phenolics mgGAE/100 g
Extract3.498502
AR10.724110
AR20.892112
AR31.982295
AR42.212310
AR51.789195
AR61.366174
AR71.952286
AR82.524360
AR92.002290
AR101.900262
AR111.980295
AR121.890289
Table 4. Absorbance obtained at different concentrations of quercetin.
Sr. No.Concentration of Quercetin (µg/mL)Mean Absorbance
1250.242 ± 0.0002
2500.430 ± 0.0002
3750.612 ± 0.0002
41000.779 ± 0.002
51250.991 ± 0.002
61501.121 ± 0.002
Table 5. Total flavanoid content as quercetin present in Annona muricata ethanol extract and fractions.
SampleAbsorbanceTotal Flavanoids(mg QE/100 g)
Extract1.020 ± 0.0002127
AR10.109 ± 0.00022.4
AR20.19813
AR30.59862
AR40.66480
AR50.41245
AR60.31430
AR70.77597.5
AR80.889112
AR90.33234
AR100.68284
AR110.70288
AR120.69286
Table 6. Absorbance obtained at different concentrations of anonaine.
Sr. No.Concentration of Anonaine(µg/mL)Mean Absorbance
1250.220 ± 0.0002
2500.401 ± 0.0002
3750.598 ± 0.0002
41000.802 ± 0.002
5125921 ± 0.002
61501.141 ± 0.002
Table 7. Total flavanoid content as anonaine present in Annona muricata ethanol extract and fractions.
SampleAbsorbanceTotal Flavanoids(mg AN/100 g)
Extract1.005 ± 0.0002118
AR10.995 ± 0.00022.2
AR20.18912
AR30.57257
AR40.65471
AR50.41041
AR60.30128
AR70.78198.1
AR80.881110
AR90.32140
AR100.67584
AR110.69586
AR120.68284
Table 8. Effect of leaf extracts of annona reticulata linn. in DPPH antioxidant model.
Sr.noConc. (in μg/mL)% Inhibition
Pet. ether ExtractEthyl Acetate ExtractAcetone ExtractMethanol ExtractWater ExtractStandard (Ascorbic Acid)
12522.24 ± 1.03 **30.35 ± 1.11 **33.82 ± 1.09 **51.57 ± 1.02 **43.63 ± 1.01 **65.19 ± 1.01
25030.54 ± 1.12 **33.63 ± 1.01 **45.08 ± 0.97 **57.54 ± 1.04 **53.10 ± 1.04 **67.27 ± 1.04
310033.71 ± 1.07 **46.76 ± 1.01 **50.50 ± 0.94 **64.97 ± 1.05 **57.48 ± 1.03 **75.68 ± 1.05
420040.05 ± 1.18 **53.98 ± 1.02 **58.62 ± 0.98 **68.42 ± 1.12 **62.84 ± 1.02 **79.18 ± 1.11
540043.55 ± 1.04 **60.98 ± 1.01 **61.69 ± 1.01 **72.58 ± 1.15 **67.72 ± 1.01 **82.46 ± 1.02
Values are expressed as Mean ± SEM.; (n = 6); One Way ANOVA followed by Turkey—Kramer Multiple Comparison test; ** p < 0.01 vs. standard drug.
Table 9. Effect of leaf extracts of annona reticulata linn. in H2O2 radical scavenging assay.
Sr.no.Conc. (in μg/mL)% Inhibition
Pet. ether ExtractEthyl Acetate ExtractAcetone ExtractMethanol ExtractWater ExtractStandard (Ascorbic Acid)
12526.21 ± 1.01 **42.35 ± 1.01 **49.19 ± 1.03 **53.01 ± 1.01 **49.30 ± 0.95 **69.82 ± 1.05
25030.13 ± 0.98 **45.72 ± 1.05 **53.56 ± 1.04 **56.92 ± 1.05 **53.68 ± 1.05 **73.74 ± 1.01
310034.51 ± 0.94 **48.07 ± 1.06 **57.04 ± 1.03 **60.00 ± 1.0956.93 ± 1.03 **79.33 ± 1.01
420038.57 ± 1.02 **53.45 ± 1.0960.07 ± 1.05 **64.89 ± 1.07 **59.06 ± 1.09 **81.82 ± 1.04
540045.16 ± 1.06 **57.49 ± 1.04 **62.14 ± 1.01 **70.27 ± 1.05 **62.65 ± 1.04 **83.95 ± 1.05
Values are expressed as Mean ± SEM.; (n = 6); One Way ANOVA followed by Turkey—Kramer Multiple Comparison test; ** p < 0.01 vs. standard drug.
Disclaimer/Publisher’s Note: The statements, opinions and data contained in all publications are solely those of the individual author(s) and contributor(s) and not of MDPI and/or the editor(s). MDPI and/or the editor(s) disclaim responsibility for any injury to people or property resulting from any ideas, methods, instructions or products referred to in the content.

