Proceeding Paper

A Preliminary Investigation on Human Tears by Means of Surface Enhanced Raman Spectroscopy †

1
CNR-SPIN, Istituto Superconduttori, Materiali Innovativi e Dispositivi, Via Campi Flegrei 34, 80078 Pozzuoli, Italy
2
Dipartimento di Medicina Sperimentale, Università della Campania “L. Vanvitelli”, Via S. Maria di Costantinopoli 16, 80138 Napoli, Italy
3
Dipartimento di Neuroscienze e Scienze Riproduttive e Odontostomatologiche, Università di Napoli “Federico II”, 80131 Napoli, Italy
4
CISME, Centro Interdipartimentale di Microscopia Elettronica, Università di Napoli “Federico II”, 80139 Napoli, Italy
5
Dipt. di Sanità Pubblica, Università di Napoli “Federico II”, 80131 Napoli, Italy
*
Author to whom correspondence should be addressed.
Presented at the 5th International Electronic Conference on Sensors and Applications, 15–30 November 2018; Available online: https://sciforum.net/conference/ecsa-5.
Proceedings 2019, 4(1), 18; https://doi.org/10.3390/ecsa-5-05737
Published: 14 November 2018
(This article belongs to the Proceedings of 5th International Electronic Conference on Sensors and Applications)

Abstract

:
A preliminary investigation on human tears by Surface Enhanced Raman Spectroscopy (SERS) is reported. This study is aimed to test the feasibility of SERS for sensing tear composition and potential changes in their composition due to pathologies, eye diseases and/or inflammatory processes. Home-made gold nano-particles have been used for preparing glass substrates that are able to efficiently induce a SERS effect in fluid samples excited by HeNe laser (λ = 633 nm). The system has been preliminarily tested on Rhodamine 6G aqueous solutions at different concentrations, proving the possibility to sense substance concentration as low as a few μM, i.e., of the order of the main tear organic component levels. Tears have been obtained by informed healthy patients by means of non-invasive methods based on a direct collection of the tear fluid by means of a suitable micro-capillary tube. A clear SERS response has also been obtained for human tear samples, allowing a preliminary insight on tear composition.

1. Introduction

The human tear represents an exceptionally rich source of information on the health status of eyes, as well as of the whole body’s functionality, and increasing attention is presently addressed to the analysis of this human body fluid. This is mainly due to the presence in the tears of a large variety of salts and organic components (including proteins, lipids, metabolites, nucleic acids, and electrolytes) whose concentration can be altered by pathologies, eye diseases and/or inflammatory processes [1,2]. The small amount of substance considered and the low concentration usually occurring hampered access to direct analysis by biochemistry methods even if the improvement of technologies is overcoming some of the main obstacles and the route to a wider and reliable use of tear diagnostic is in progress. In this framework, micro-Raman spectroscopy is giving an important contribution. The vibrational spectroscopies can be extremely useful to analyze biological samples, providing valuable insight into the nature of samples and biofluids [3,4,5] and into the determination of the chemical structure of specific molecules [6]. Raman spectroscopy has been used for investigating tears by different research groups [7,8,9]. More recently, the use of Surface Enhanced Raman Spectroscopy (SERS) has been proposed with interesting perspectives in terms of sensitivity and specificity of the signal response [10,11,12]. In this work, human tear samples have been investigated by SERS, using home-made SERS substrate constituted by gold nano-particles. In order to test the efficiency of this method, preliminary SERS measurements have been performed on Rhodamine 6G.

2. Materials and Methods

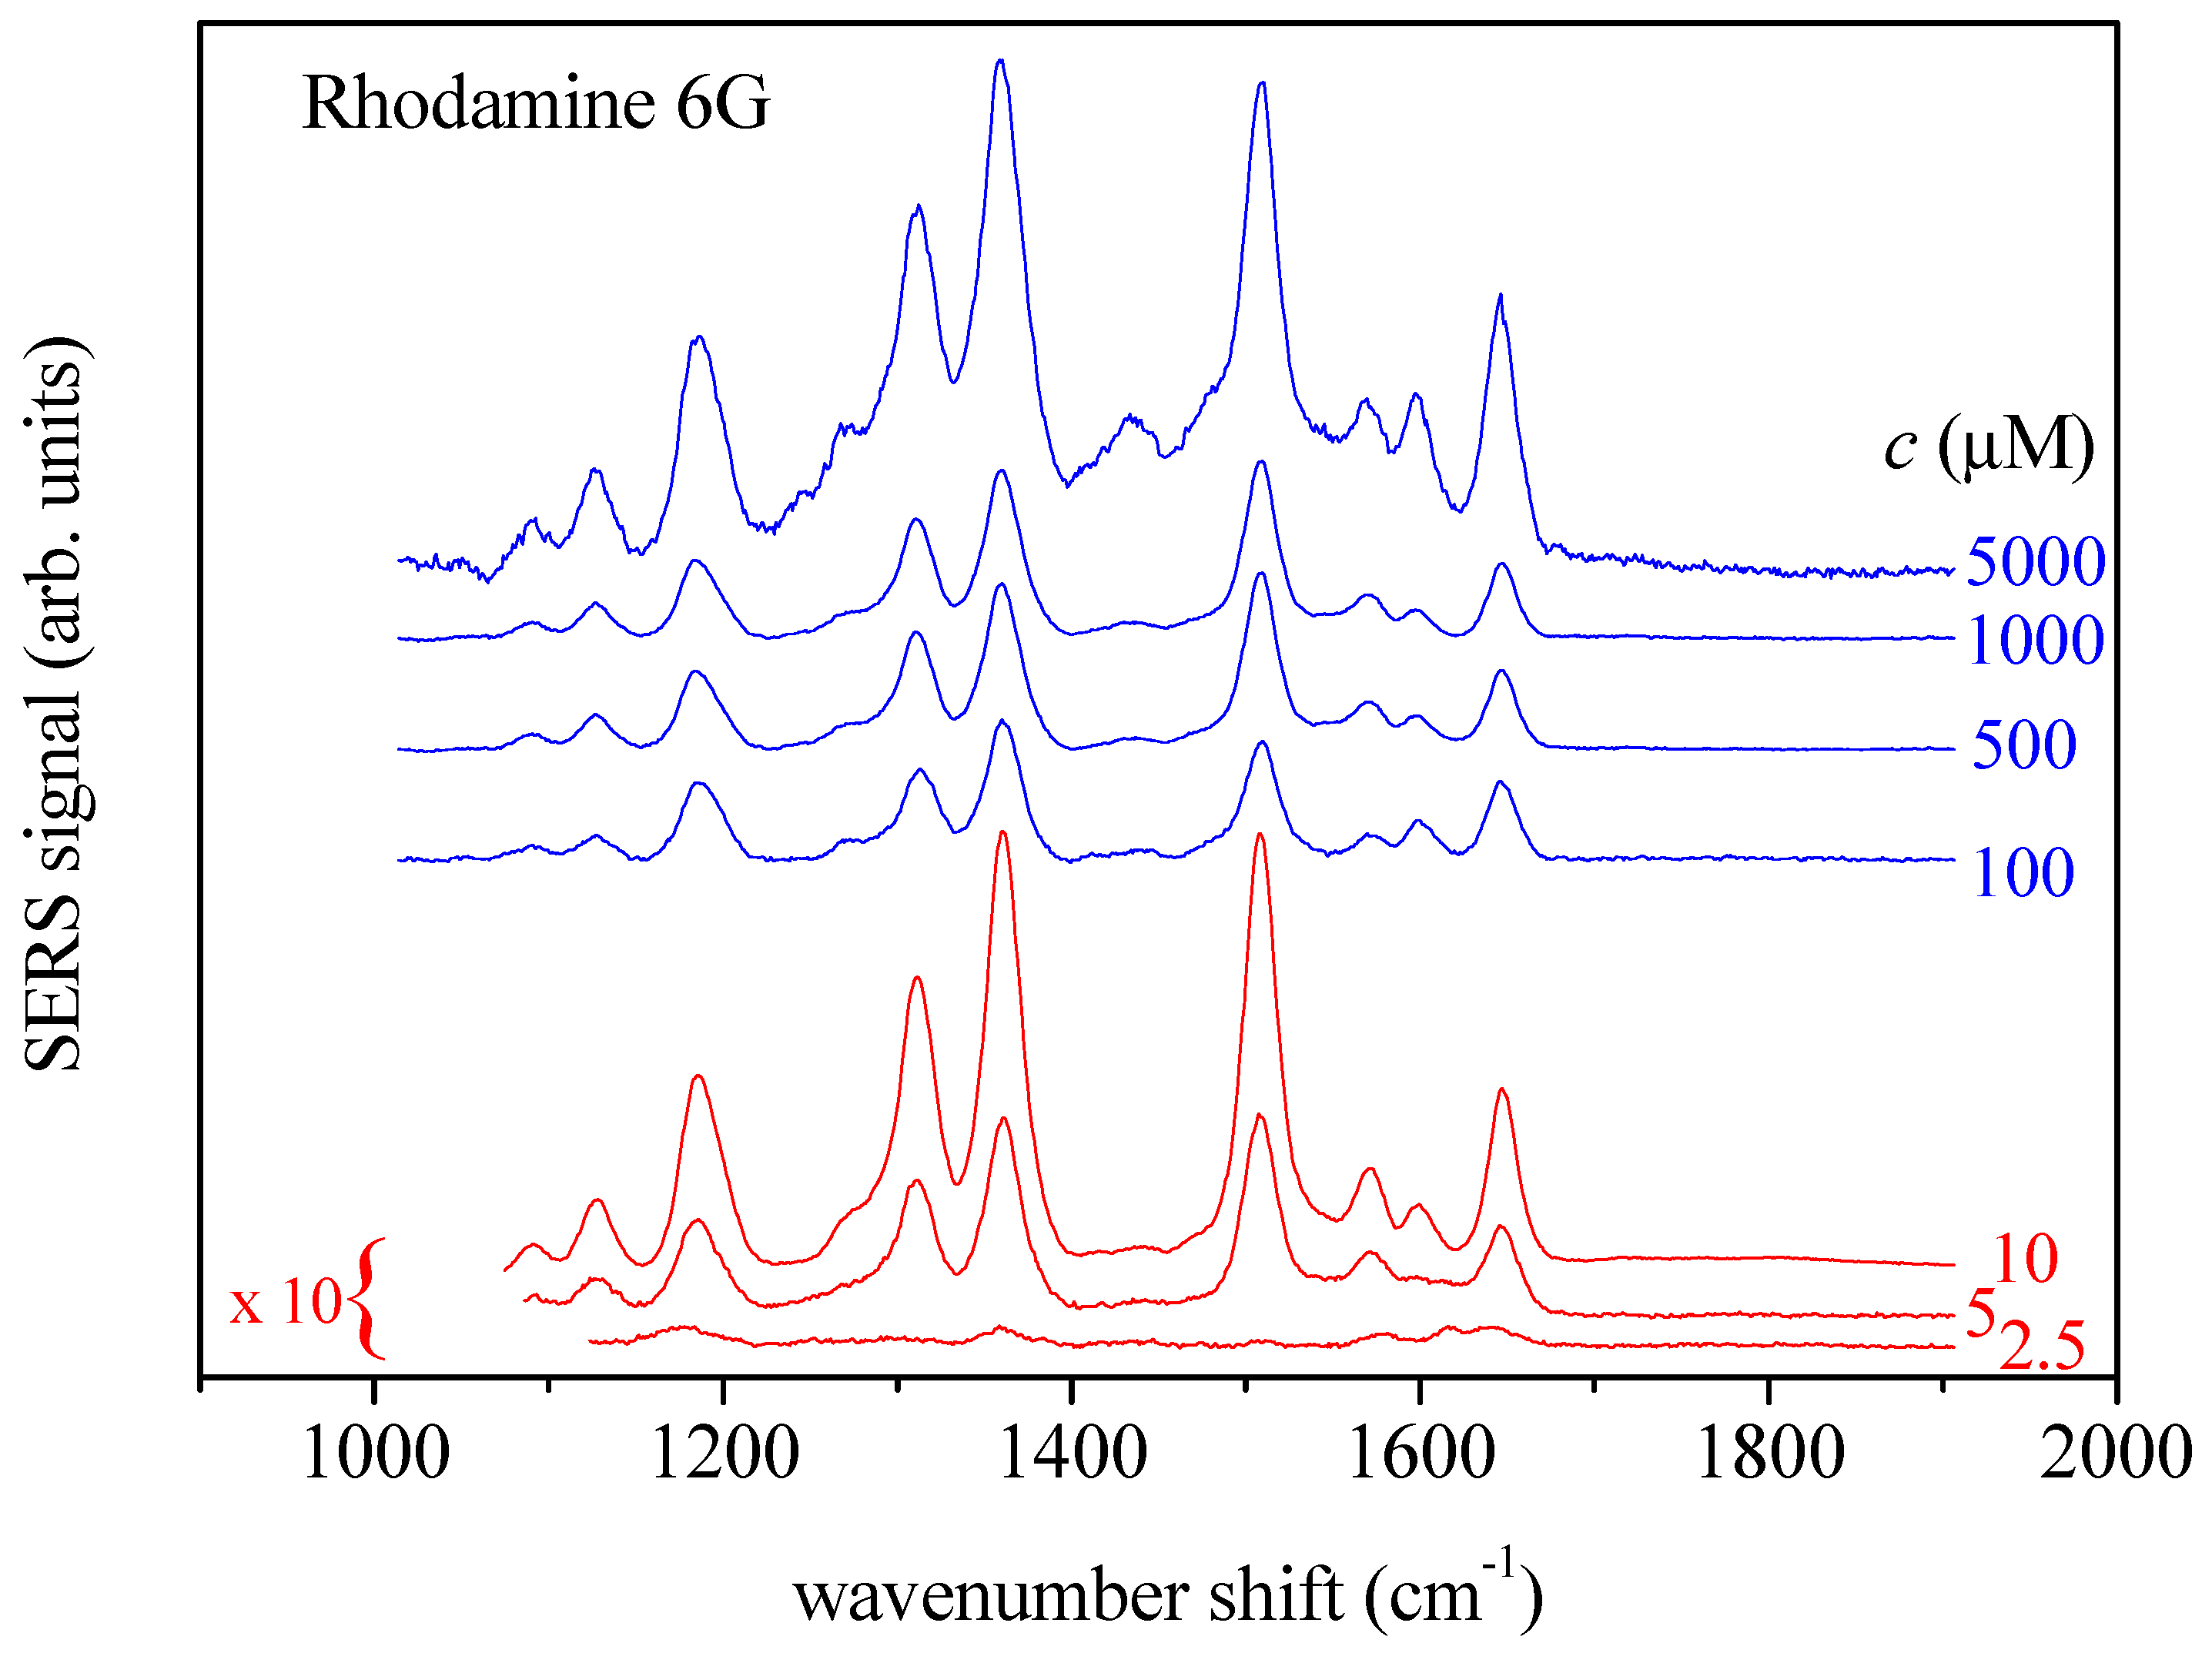
2.1. Rhodamine 6G Solutions

Rhodamine 6G aqueous solutions were prepared diluting Rhodamine in deionized water, with concentrations of c = 0.0025, 0.005, 0.01, 0.1, 0.5, 1 and 5 mM, respectively. Rhodamine 6G was purchased from Sigma-Aldrich (St. Louis, MO, USA).

2.2. Tear Collection

Tear specimens were collected from healthy volunteers. Informed consent was preliminarily obtained from them, explaining all the procedures of tear collection. Smooth edge sterile capillary glass tubes, with internal diameter = 0.2 mm, outside diameter = 1 mm and length = 12.7 mm, were used (ACCU-FILL 90 MICROPET by Becton, Dickinson & Co, Clay Adams (CA), Franklin Lakes, NJ, USA). During collection, the volunteer’s lower eyelid was gently pulled down and the tip of the open capillary tube was placed in contact with the tear meniscus without irritating the conjunctiva. A minimum of 1.0 mL tears was collected. The samples were stored at 4 °C and tested by SERS within 7 days.
In this work, 8 patients have been considered, aged between 33 and 85 years (see Table 1).

2.3. SERS Measurements

The SERS measurements were performed by using a Jobin-Yvon system from Horiba Scientific (Osaka, Japan), equipped with a TriAx 180 monochromator, a liquid nitrogen cooled charge-coupled detector and a 1800 grooves/mm grating (final spectral resolution: 4 cm−1). The spectra were recorded in air at room temperature using a 17 mW He-Ne laser source (wavelength 632.8 nm). Accumulation times in the 30–180 sec range were used. The laser beam was focused to a 2 μm spot on the sample through an Olympus microscope equipped with 100× optical objective.
In order to perform SERS measurements, a small amount of the fluid sample was put on a dried drop of gold nano-particle (GNP) colloid, previously positioned on a conventional microscope glass. The GNP preparations were obtained by conventional citrate reduction method [13] from HAuCl4 solution reduced by 1% sodium citrate. Final GNP diameter depends on the concentration of sodium citrate, and it is of the order of a few ten of nanometers (about 30 nm, in the case here considered). Details on the fabrication and optical, Dynamic Light Scattering (DLS) and Transmission electron microscopy (TEM) characterization of GNPs are reported in Refs [14,15]. Hydrogen tetrachloroaurate (HAuCl4), and trisodium citrate were purchased from Sigma-Aldrich (Sigma-Aldrich Co., St. Louis, MO, USA). All chemicals were used as received.

2.4. Spectral Data Analysis

The SERS data were preventively elaborated by using a “wavelet” based algorithm in order to reduce background signal and noise level [16]. In order to allow a direct comparison, the obtained spectra were normalized with respect to their total area, and analyzed in terms of convolution of Lorentzian components by using a best-fitting routine of GRAMS/AITM (2001, Thermo Electron, Waltham, MA, USA) program, which is based on Levenberg-Marquardt nonlinear least-square methods.

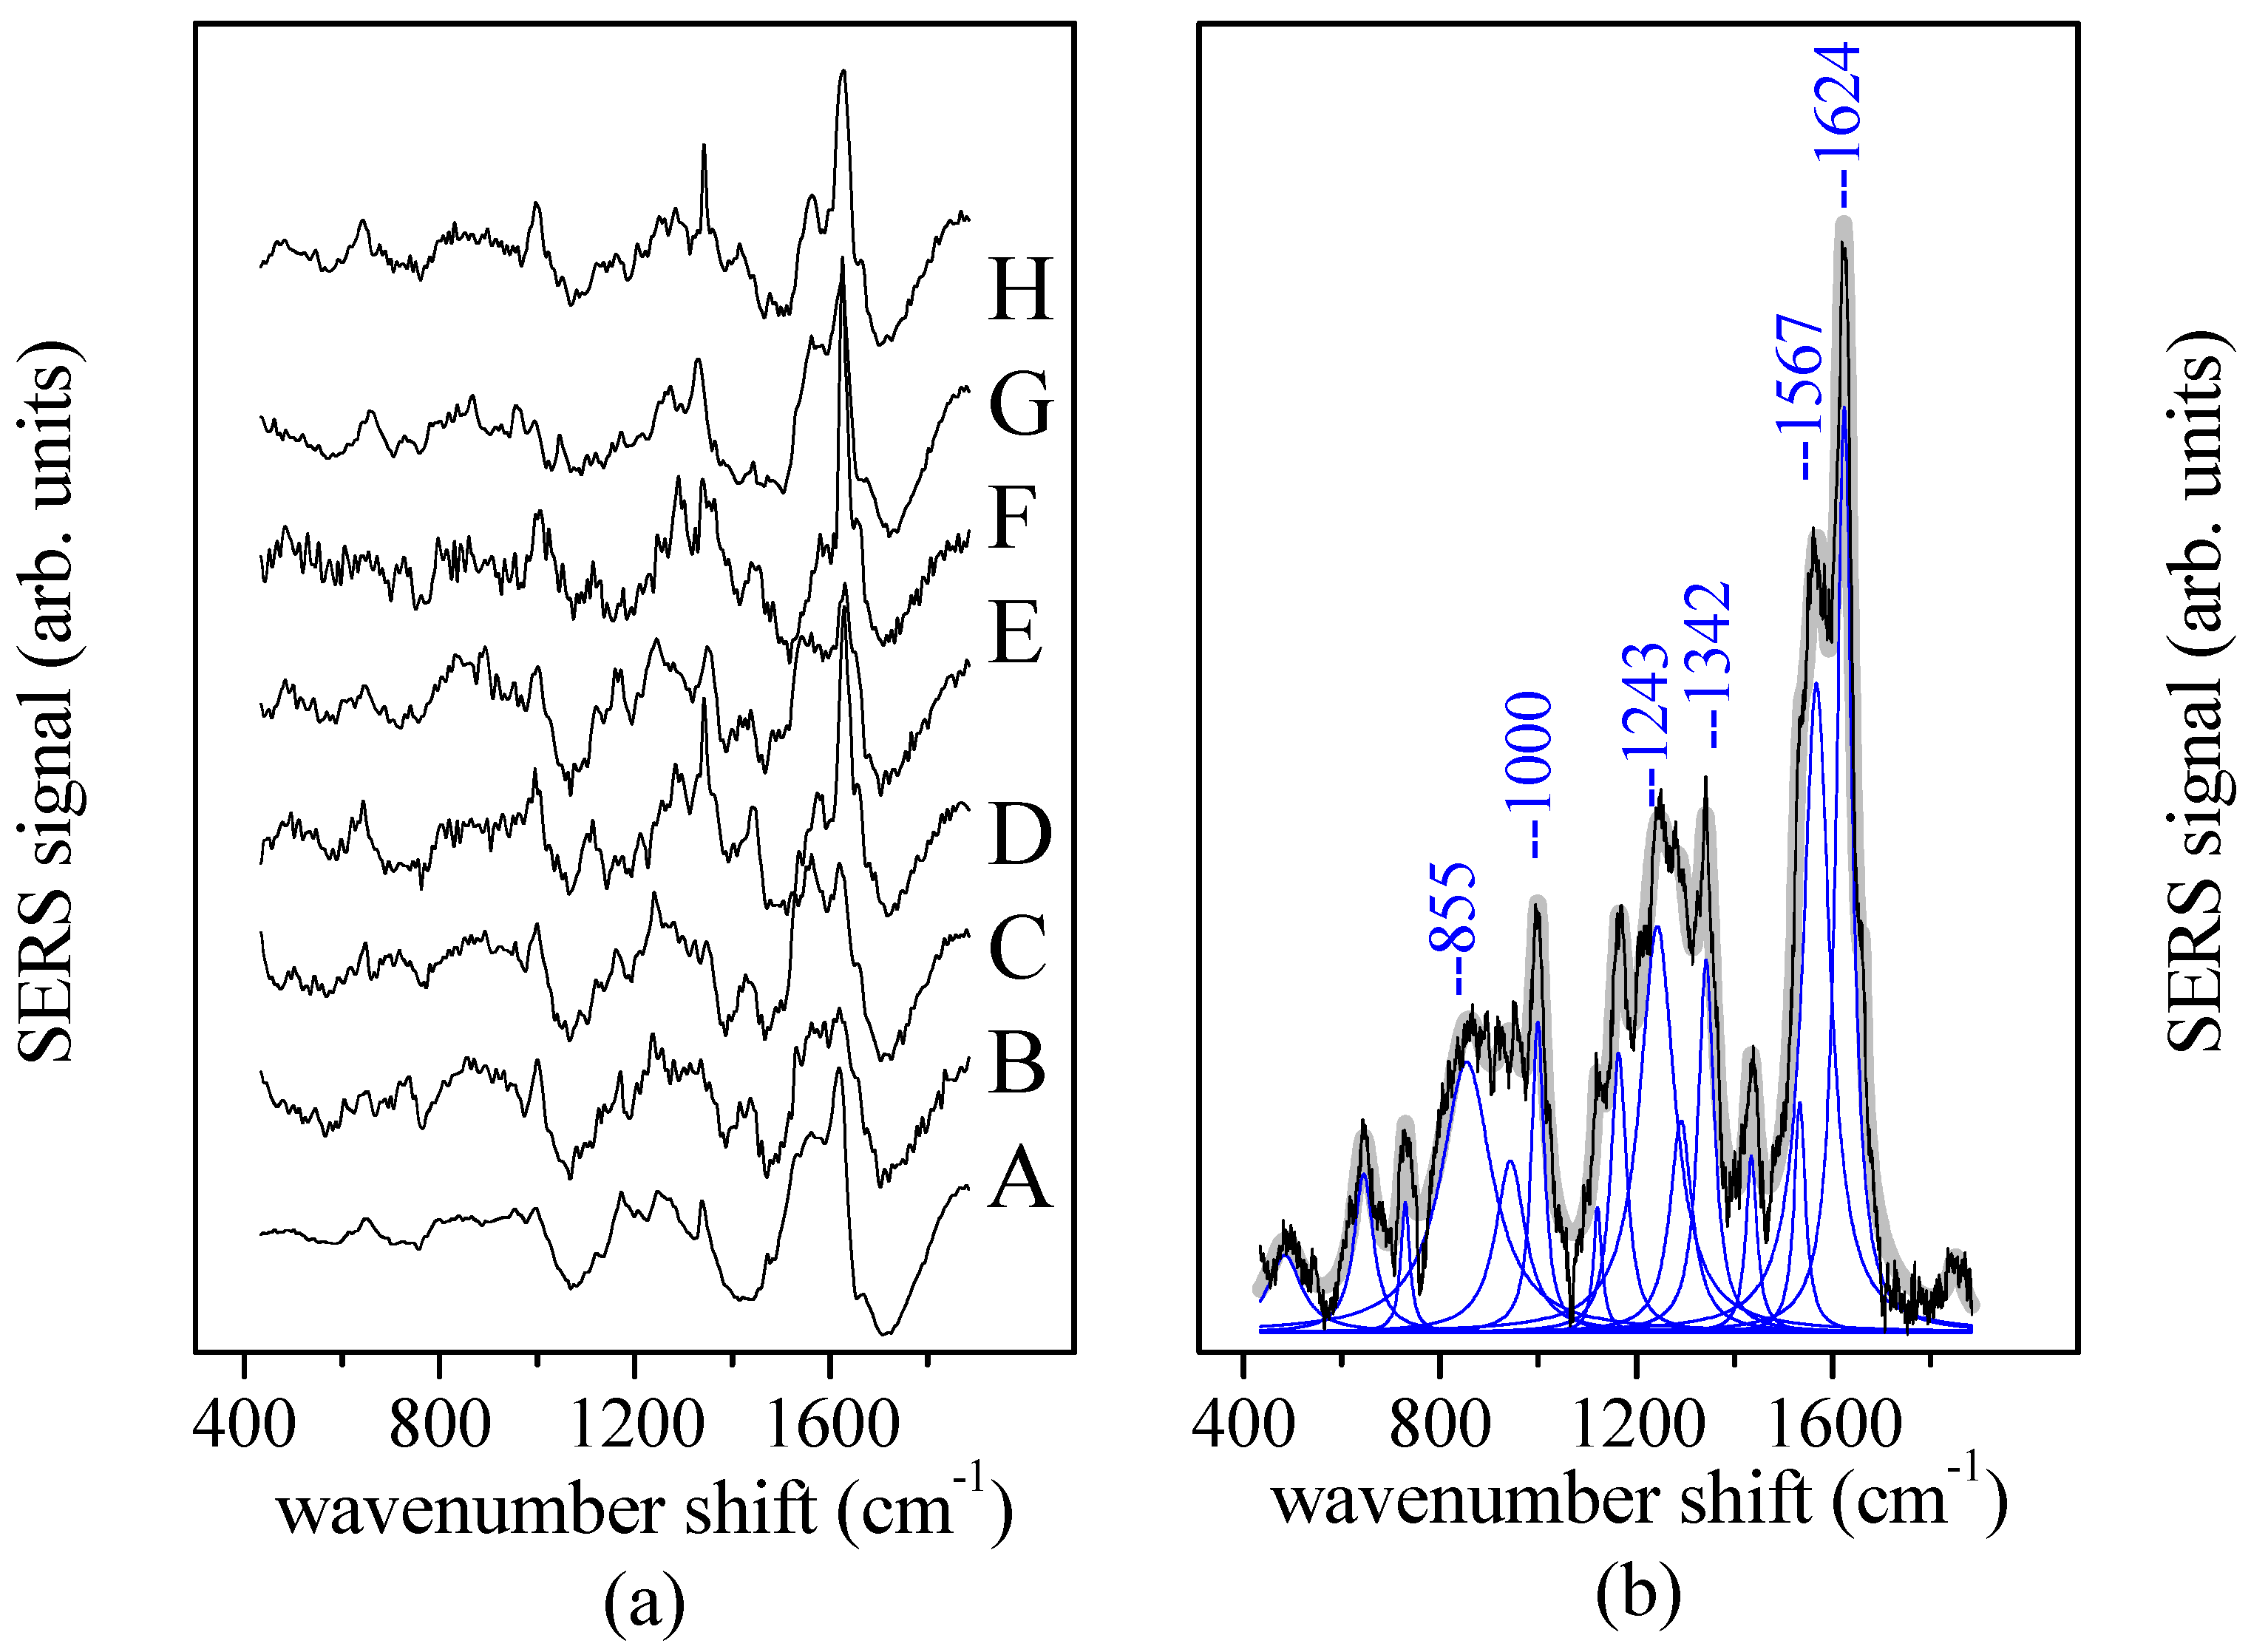
3. Results and Discussions

Preliminary Raman measurements on Rhodamine 6G solutions at different concentrations were performed with an acquisition time of 30 s in order to obtain a reference signal. SERS measurements on the same Rhodamine 6G solutions in deionized water were performed in order to quantify the signal response enhancement with respect to conventional Raman spectroscopy. SERS spectra have been collected on the Rhodamine-water solutions in similar conditions, by using an acquisition time of 30 sec. The obtained spectra are reported in Figure 1, and arbitrarily shifted along the y-axis in order to improve readability. They refer to Rhodamine 6G solutions with concentrations c = 0.0025, 0.005, 0.01, 0.1, 0.5, 1 and 5 mM, respectively. The intensities of the spectra referring to lower concentrations (red lines) are reported 10 times magnified with respect to the remaining spectra (blue lines). The spectra observed are consistent with data reported in literature [17] and prove the high sensitivity of the method. A SERS efficiency of about 4 × 10³ is estimated by comparing the SERS data with signals obtained by conventional Raman spectroscopy.
SERS signals from tears were collected in conditions similar to those used for the preliminary measurements on Rhodamine 6G. In this case, the acquisition time was typically of 180 s. The SERS spectra reported in Figure 2a are obtained by averaging the SERS responses measured in different places of the sample (at least three positions) of tear fluids collected from the eight healthy volunteers, here identified by letters from A to H (see Table 1). Amide I and Amide III Raman bands are clearly evinced in the spectra of Figure 2a at the spectral positions of ~1600 cm−1 and ~1250 cm−1, respectively. Relevant similarities occur in the reported spectra. The average spectrum obtained by the sum of the spectra of Figure 2a is reported in Figure 2b. By means of a fit numerical procedure, the signal was deconvoluted in terms of Lorentzian components and is reported in Figure 2b as blue curves. The spectrum is rich in components, as expected in an organic fluid. In Figure 2b are indicated some of the most prominent modes, at 855, 1000, 1243, 1342, 1567, and 1624 cm−1. On the basis of SERS investigations on proteins reported in literature [18,19], a tentative assignment of the observed modes indicates that they are mainly due to single amino acid residues [20]. The mode at 855 cm−1 is assigned to C-C stretching and is present in many substances such as Uracil and Cytosine [19]. Similarly, the modes at 1243 cm−1 and 1342 cm−1 related to CH2 and CH3 vibrations, respectively, are typically observed in amino acids as, for instance, Aspargine and Leucine [19]. The sharp peak at 1000 cm−1 is related to Phelnylanine or Thymine [19] and is generally present in the Raman spectra of organic substances. The prominent broad mode at 1567 cm−1 is assigned to NH2 and C2-N10 bonds and it is found, for instance, in Guanine spectrum [18]. Finally, the strong peak at 1624 cm−1 is related to the Amide I band of protein and vibration of C=O bonds. It can be the indication of the presence of Tryptophan or Aspargine, as well as of other amino acids [18]. The main protein components revealed by the biochemical analysis in the tear are: Lactoferrin, Lysozyme, Lipocalin, Immunoglibulin (IgA) and Albumine [10]. All these substances have complex structures where many different amino acids concur to the composition. However, pathological status can alter fluid composition equilibrium, changing the amino acid relative concentrations and the concerned SERS response. For instance, an increase of the branched-chain amino acids Isoleucine, Leucine and Valine levels, potentially detectable by SERS, can be the mark of neuronal diseases [21].

4. Conclusions

A preliminary investigation on tear fluids by SERS is reported. The SERS is implemented by using home-made GNPs that, suitably tuned to the HeNe laser excitation light, allow a considerable enhancement of the Raman signal proven by the test measurements on Rhodamine 6G water solutions. Concentrations of Rhodamine 6G as low as a few μM, comparable to concentrations of organic components of the tear, have been clearly revealed. Tear samples from eight healthy subjects have been tested. From the SERS data, an average spectrum has been obtained that allowed the individuations of the main components, mainly related to amino acid content. The considered tear test is not invasive and represents as appealing potential alternative to biochemical assays for health diagnostics through tear fluid analysis.

Author Contributions

Conceptualization, C.C., D.M. and G.C.; methodology, S.D.P., M.L. (Maria Lepore), M.P.; investigation, M.L. (Mikhail Lisitskiy), D.M.; data curation, M.L. (Mikhail Lisitskiy), D.M., C.C.; writing—original draft preparation, C.C. and M.L. (Maria Lepore).

Funding

This research received no external funding.

Conflicts of Interest

The authors declare no conflict of interest.

References

  1. Hagan, S.; Martin, E.; Enríquez-de-Salamanca, A. Tear fluid biomarkers in ocular and systemic disease: Potential use for predictive, preventive and personalised medicine. EPMA J. 2016, 7, 15. [Google Scholar] [CrossRef]
  2. Börger, M.; Funke, S.; Bähr, M.; Grus, F.; Lingor, P. Biomarker sources for Parkinson’s disease: Time to shed tears? Basal Ganglia 2015, 5, 63–69. [Google Scholar] [CrossRef]
  3. D’apuzzo, F.; Perillo, L.; Delfino, I.; Portaccio, M.; Lepore, M.; Camerlingo, C. Monitoring early phases of orthodontic treatment by means of Raman spectroscopies. J. Biomed. Opt. 2017, 22, 115001. [Google Scholar] [CrossRef] [PubMed]
  4. Camerlingo, C.; Zenone, F.; Perna, G.; Capozzi, V.; Cirillo, N.; Gaeta, G.M.; Lepore, M. An investigation on micro-Raman spectra and wavelet data analysis for Pemphigus Vulgaris follow-up monitoring. Sensors 2008, 8, 3656–3664. [Google Scholar] [CrossRef] [PubMed]
  5. Gąsior-Głogowska, M.; Komorowska, M.; Hanuza, J.; Mączka, M.; Zając, A.; Ptak, M.; Będziński, R.; Kobielarz, M.; Maksymowicz, K.; Kuropka, P.; et al. FT-Raman spectroscopic study of human skin subjected to uniaxial stress. J. Mech. Behav. Biomed. Mater. 2013, 18, 240–252. [Google Scholar] [CrossRef] [PubMed]
  6. Reichebacher, M.; Popp, J. Challenges in molecular structure determination. In Vibrational Spectroscopy XX; Springer: Berlin/Heidelberg, Germany, 2013; pp. 63–143. [Google Scholar]
  7. Filik, J.; Stone, N. Analysis of human tear fluid by Raman spectroscopy. Anal. Chim. Acta 2008, 616, 177–184. [Google Scholar] [CrossRef] [PubMed]
  8. Filik, J.; Stone, N. Investigation into the protein composition of human tear fluid using centrifugal filters and drop coating deposition Raman spectroscopy. J. Raman Spectrosc. 2009, 40, 218–224. [Google Scholar] [CrossRef]
  9. Kuo, M.-T.; Lin, C.-C.; Liu, H.-Y.; Chang, H.-C. Tear Analytical model based on Raman microspectroscopy for investigation of infectious diseases of the ocular surface. Investig. Ophthalmol. Vis. Sci. 2011, 52, 4942–4950. [Google Scholar] [CrossRef] [PubMed]
  10. Hu, P.; Zheng, X.S.; Zong, C.; Li, M.H.; Zhang, L.Y.; Li, W.; Ren, B. Drop-coating deposition and surface-enhanced Raman spectroscopies (DCDRS and SERS) provide complementary information of whole human tears. J. Raman Spectrosc. 2014, 45, 565–573. [Google Scholar] [CrossRef]
  11. Kim, W.-S.; Shin, J.-H.; Park, H.-K.; Choi, S. A low-cost, monometallic, surface-enhanced Raman scattering-functionalized paper platform for spot-on bioassays. Sens. Actuators B Chem. 2016, 222, 1112–1118. [Google Scholar] [CrossRef]
  12. Choi, S.; Moon, S.W.; Shin, J.-H.; Park, H.-K.; Jin, K.-H. Label-free biochemical method for early detection of Adenoviral conjuctivitis using human tear biofluids. Anal. Chem. 2014, 86, 11093–11099. [Google Scholar] [CrossRef] [PubMed]
  13. Frens, G. Particle size and sol stability in metal colloids. Colloid Polym. Sci. 1972, 250, 736–741. [Google Scholar] [CrossRef]
  14. Camerlingo, C.; Portaccio, M.; Tatè, R.; Lepore, M.; Delfino, I. Fructose and pectin detection in fruit-based food products by Surface-Enhanced Raman Spectroscopy. Sensors 2017, 17, 839. [Google Scholar] [CrossRef] [PubMed]
  15. Camerlingo, C.; Portaccio, M.; Tatè, R.; Lepore, M.; Delfino, I. Surface-Enhanced Raman Spectroscopy study of commercial Fruit Juices. Proceedings 2017, 1, 25. [Google Scholar]
  16. Camerlingo, C.; Zenone, F.; Gaeta, G.M.; Riccio, R.; Lepore, M. Wavelet data processing of micro-Raman spectra of biological samples. Meas. Sci. Technol. 2016, 17, 298–303. [Google Scholar] [CrossRef]
  17. Ameer, F.S.; Pittman, C.U., Jr.; Zhang, D. Quantification of resonance Raman enhancement factors for Rhodamine 6G (R6G) in Water and on Gold and Silver Nanoparticles: Implications for Single-Molecule R6G SERS. J. Phys. Chem. C 2013, 117, 27096–27104. [Google Scholar] [CrossRef]
  18. Madzharova, F.; Heiner, Z.; Gühlke, M.; Kneipp, J. Surface-enhanced hyper-Raman spectra of adenine, Guanine, Cytosine, Thymine, and Uracil. J. Phys. Chem. 2016, 120, 15415–15423. [Google Scholar] [CrossRef] [PubMed]
  19. Stewart, S.; Fredericks, P.M. Surface-enhanced Raman spectroscopy of amino acids adsorbed on an electrochemically prepared silver surface. Spectrochim. Acta Part A 1999, 55, 1641–1660. [Google Scholar] [CrossRef]
  20. Hu, J.; Sheng, R.S.; Xu, Z.S.; Zeng, Y. Surface enhanced Raman spectroscopy of lysozyme. Spectrochim. Acta 1995, 51A, 1087–1096. [Google Scholar] [CrossRef]
  21. Manciu, F.S.; Ciubuc, J.D.; Sundin, E.M.; Qiu, C.; Bennet, K.E. Analysis of Serotin molecules on silver nanocolloids—A Raman computational and experimental study. Sensors 2017, 17, 1741. [Google Scholar] [CrossRef] [PubMed]
Figure 1. Surface Enhanced Raman Spectroscopy (SERS) of Rhodamine 6G aqueous solutions at different concentrations in the range of 2.5–5000 μM. The intensity of the spectra reported in red is amplified by a factor of 10. The spectra reported are arbitrarily shifted along the y-axis.
Proceedings 04 00018 g001
Figure 2. SERS of tear fluid: (a) Spectra obtained from tear fluid collected from 8 healthy volunteers, here identified by letters from A to H (see Table 1). (b) Average spectrum obtained by the sum of the spectra reported in (a). The signal has been deconvoluted in terms of Lorentzians (blue lines) and the main Raman mode components are indicated.
Proceedings 04 00018 g002
Table 1. List of volunteers.
IdentifierBirth YearSex
A1985f
B1980f
C1972f
D1956f
E1952m
F1948m
G1943f
D1933m

