1. Introduction
Data Structures is a subject to be taught in basic Computer Science courses. These courses include dealing with arrays, linked lists, trees, etc. in connection with typical algorithms. An example of such a course is “Fundamental Data Structures and Algorithms”, part of the Computer Science Curricula 2013 [
1]. In those courses, teachers must illustrate the data structures included in educational material with appropriate drawings. Likewise, students when submitting learning assignments must also draw data structures. For this, most people use drawing facilities included in text editors or presentation preparation software. Teachers, e.g., use drawing tools included in Keynote or MS Powerpoint while making presentation slides. A disadvantage of this approach is the drawing has no semantics attached. Thus, any other use of the represented structure is precluded. Another disadvantage of this way of describing structures is its lack of standardization. Finally, it may work fine with a few slides, but it may become very time-consuming to represent a large number of structures.
An alternative way to represent data structures is to just declare them in programming language code. The obvious disadvantage of this approach is its poor understandability by humans. It is not the case with machines, so the representation can easily be integrated to programs.
The two previous options can be considered as extreme ones in a scale of understandability by humans/machines. One could then search for a trade-off: a representation easy enough for humans but usable by machines as well.
A search for the aforementioned trade-off applicable to all typical data structures is our goal here. We also would like to find a practical representation, i.e., easy-to-use by most people and efficient in terms of time needed to create a data structure instance. A solution is presented below: the DSTR language. Of course, that solution is not unique: other ones may be developed afterwards.
2. Previous Work
Data structures visualization has been studied before. Baloian et al. [
2] concentrate on the problem of lack of interactivity in many of the previously developed systems and that fact is crucial for the proper involvement of the learner in order to have a successful learning experience. Adarme and Molinares [
3] stress the importance of visualization in real contexts thus focusing on structures defined using Java. The SWAN system [
4] focuses the discussion on animation, providing support limited to a few well-known data structures. Cstutor [
5] offers sketch-based visualization, which provides some flexibility regarding the data structures that can be used, but its support to the user remains weak.
All authors stress the need for visualization of data structures for learning and many mention interactivity as a key factor for learning success. However there is no discussion yet on which is the most convenient form to represent the structure. Most works either provide strong support in correct algorithm and data visualization on a limited number of data structures or they are flexible but provide little support. This work is a step in the direction of finding a convenient middle point.
3. Design Issues
A proposal for the trade-off mentioned in
Section 1 is to design a data structures description language which will be structured enough to be interpreted but also easy to use by humans. Ease of use means a data structure should be simple to describe for a user but also simple to understand by another user.
Thus, some constraints must be placed on the descriptive capacity of the language if we want to obtain ease of use. A constraint may be to a make a decision on which will be the data structures to be supported by the language.
Which data structures must be included? There is no unique answer to this question. We chose the following data structures for DSTR: arrays, matrices, trees, graphs, tables, and linked lists (
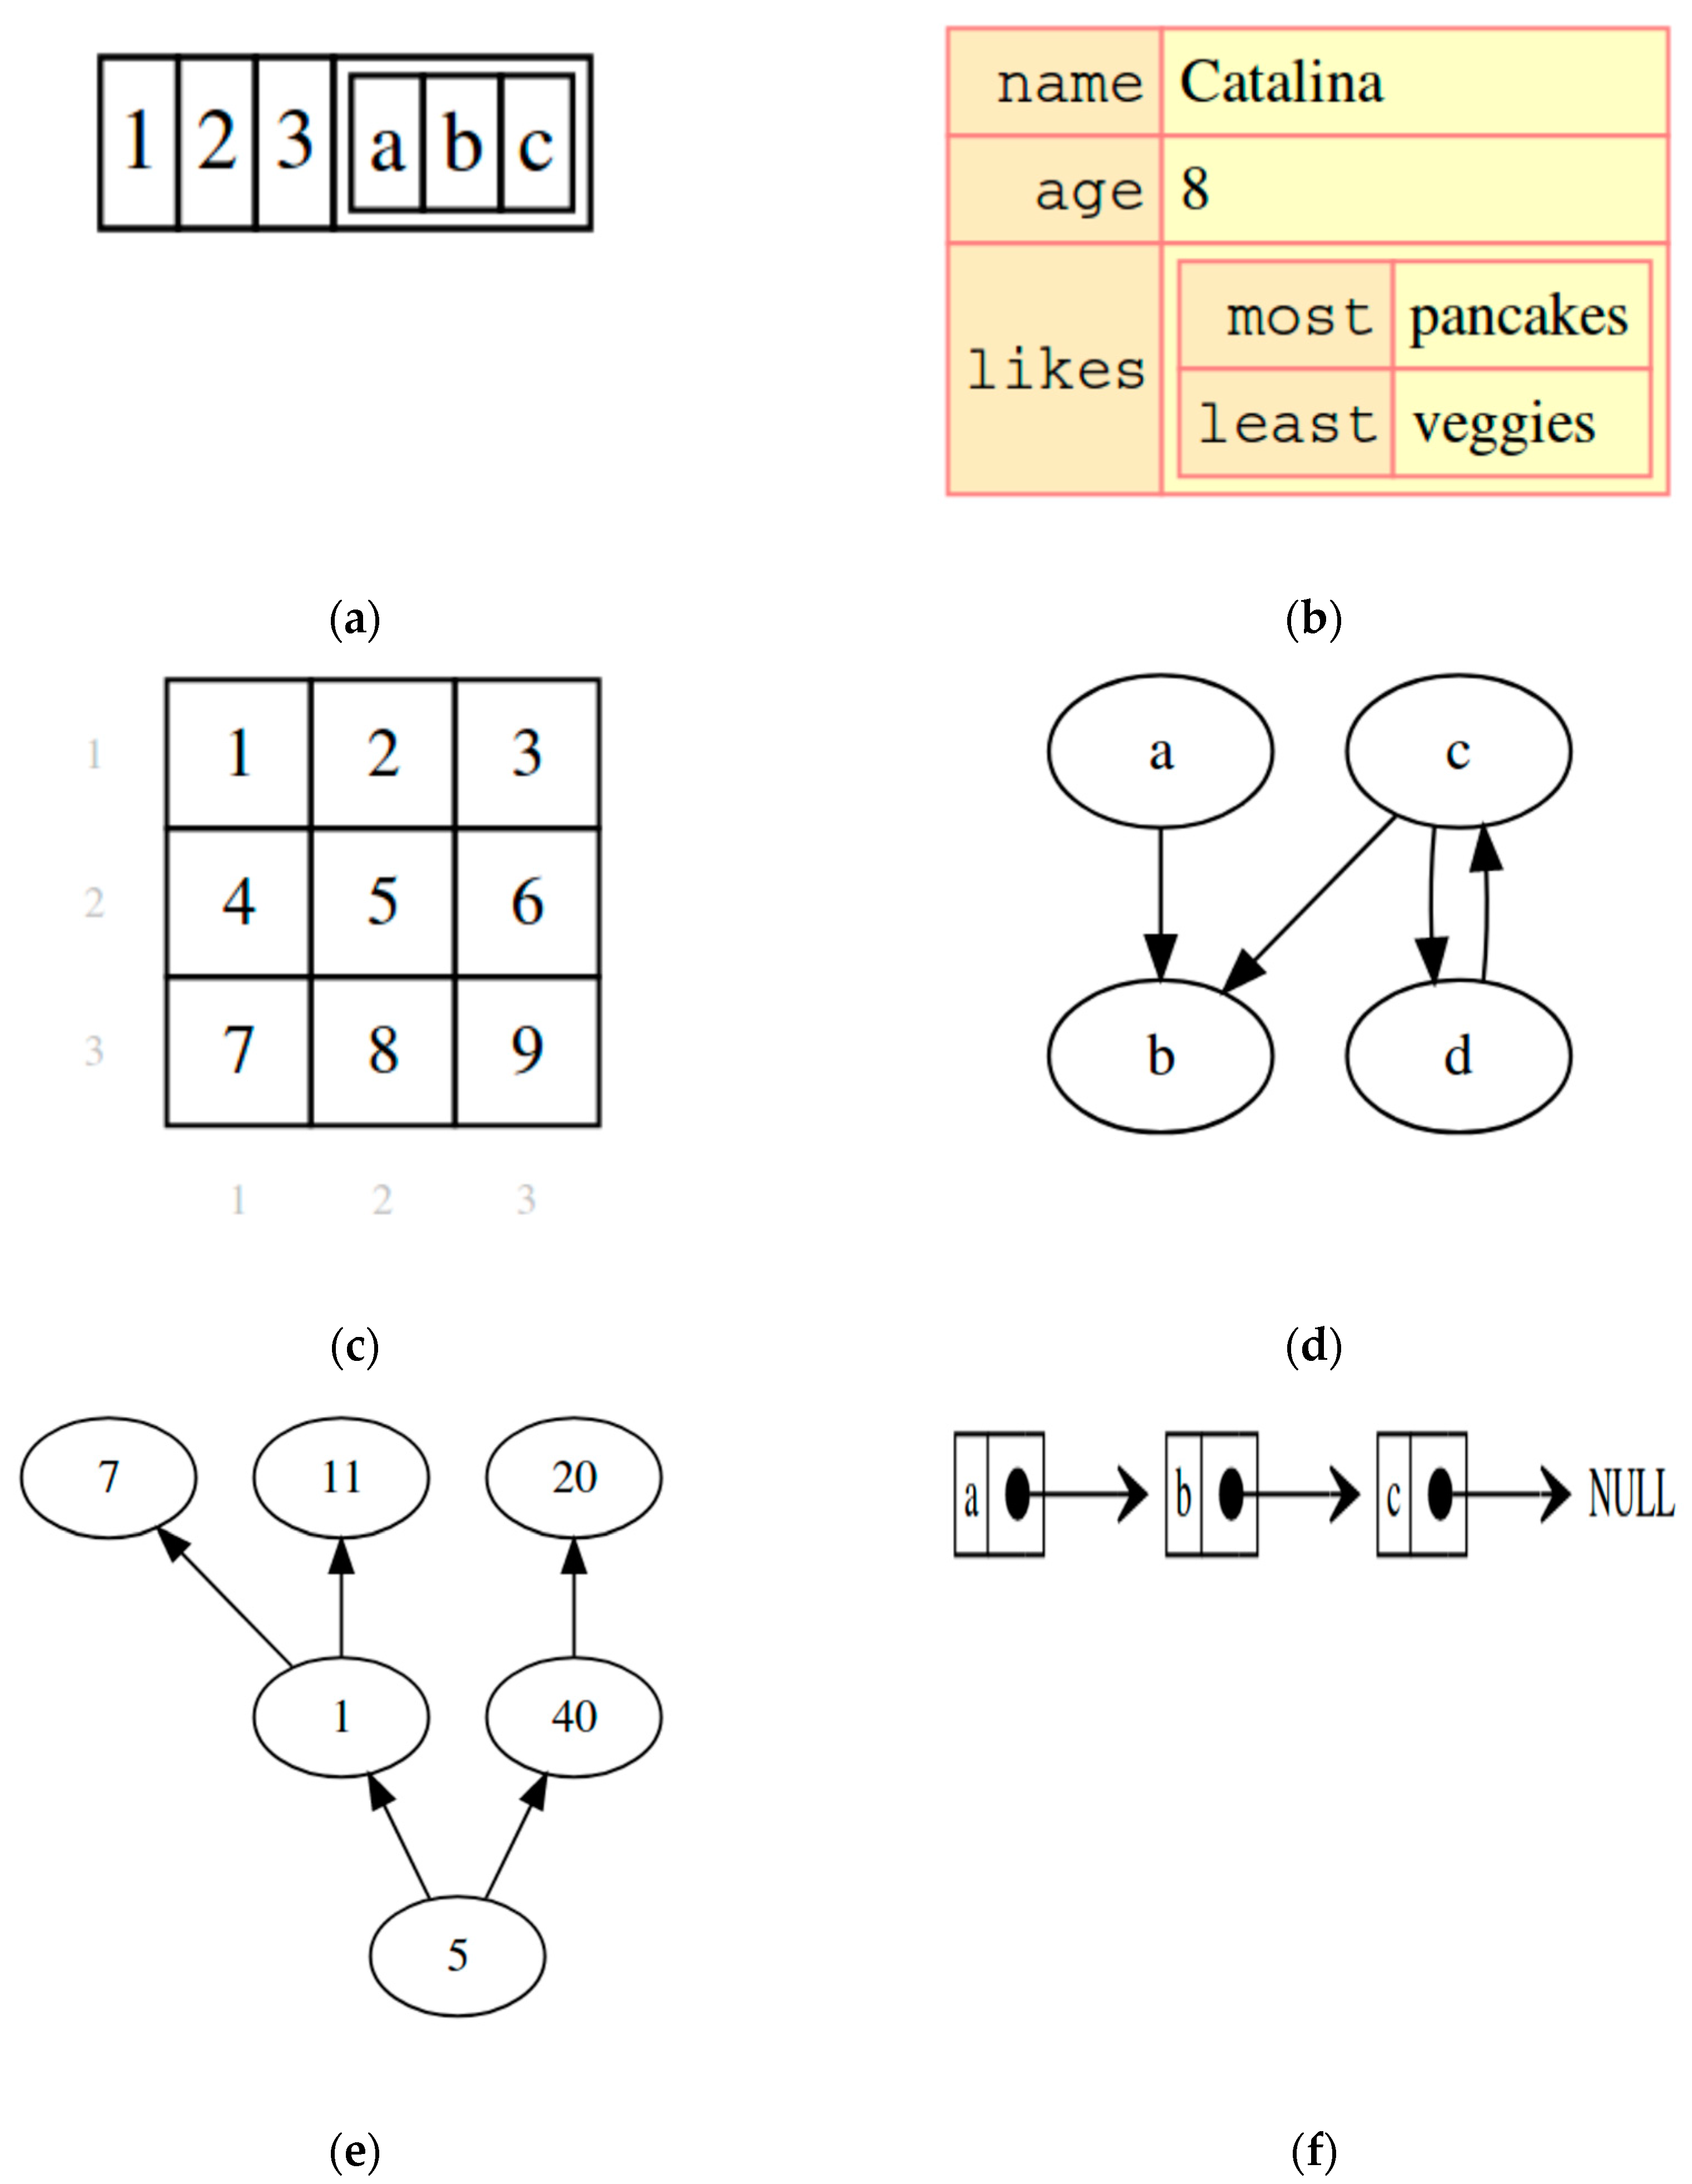
Figure 1). These are the structures used in our Introduction to Programming course at the Univ. of Chile. However, these are popular structures and they should cover most or all the needs of similar courses at other institutions. Some features of these structures are mentioned below.
The array is one of the most traditional data structures. It represents a set of elements considered contiguous in a linear sequence. The position of an element is given by an integer (index). We represent arrays of any element type, visually arranged horizontally or vertically. Indices are optionally represented. DSTR allows nested inclusion of elements.
Figure 1a shows an array in which the fourth element is an array.
A matrix can be considered as a bi-dimensional array. An element is indexed according to its row number and column number. Again, nesting and representation of indices are allowed.
Figure 1c shows a matrix with displayed indices.
A tree is composed of a root node and 0 or more child nodes, which in turn, may be roots of other trees. Several types of trees are possible to be represented in DSTR, such as binary trees, inverted tress, horizontal trees, and trees with null leaves.
Figure 1e shows an inverted tree.
The graph represents a set of nodes and a set of arcs connecting those nodes. The arcs can be labelled or not and can be directed or not.
Figure 1d shows a graph with unlabeled directed arcs.
Tables allow to represent the relation of an element in the first column with elements in other columns. We chose to include only two columns, and thus, DSTR represents well the maps or dictionaries included in other languages. Then, there are “keys” (first column) and “values” (second column). Nesting is allowed.
Figure 1b shows a table in which the third value is a table.
The linked list is a traditional Computer Science structure representing a set of elements ordered in a sequence. Unlike arrays, which have fixed length, adding a new element at the end of a linked list is a simple operation.
Figure 1f shows a simple linked list in which the last element points to NULL.
4. The DSTR Language
Instead of creating a new language from scratch, DSTR extends the JSON [
6] grammar. JSON (JavaScript Object Notation) is a lightweight data-interchange format. It was chosen because, as described in [
6], “it is easy for humans to read and write; it is easy for machines to parse and generate”. That was precisely our goal! Furthermore, the JSON description states: “JSON… is language independent but uses conventions that are familiar to programmers of… C, C++, C#, Java, JavaScript, Perl, Python, and many others”. That familiarity feature is also welcome because it eases appropriation for the new DSTR users.
The language uses few symbols:
three types of parentheses: (), [], {}
the following characters: ‘,’, ‘”’, ‘@’, ‘!’, ‘%’, ‘-’, ‘>’, ‘<’
There are no reserved words, with the exception of ‘true’, ‘false’, ‘nil’, ‘null’. These words are present in many programs, and they are also reserved words in JSON.
The square brackets are used to define arrays. The elements are separated by commas or blanks. For example, the array depicted in
Figure 1a is described as:
Since the matrix is essentially a bi-dimensional array, it is described using the same brackets. For instance, the matrix shown in
Figure 1c is described as:
The indentation in the previous example is not required by the language, which ignores new lines and blanks.
Trees are represented by curly brackets. The inverted tree depicted in
Figure 1e is described by:
Graph nodes are enclosed in normal parentheses. Arcs are described with a hyphen. Direction (if any) is given by ‘>’ and/or ‘<’. Thus, the graph shown in
Figure 1d is described as:
Tables are enclosed within curly brackets. Each pair separates key from value by a colon.
Figure 1b is then described as:
Finally, a linked list is a particular case of graph. However, the metadata @linkedList indicates the visualizer that a preferred visualization should be used for this data structure. Thus,
Figure 1f is described as:
5. The Web Application
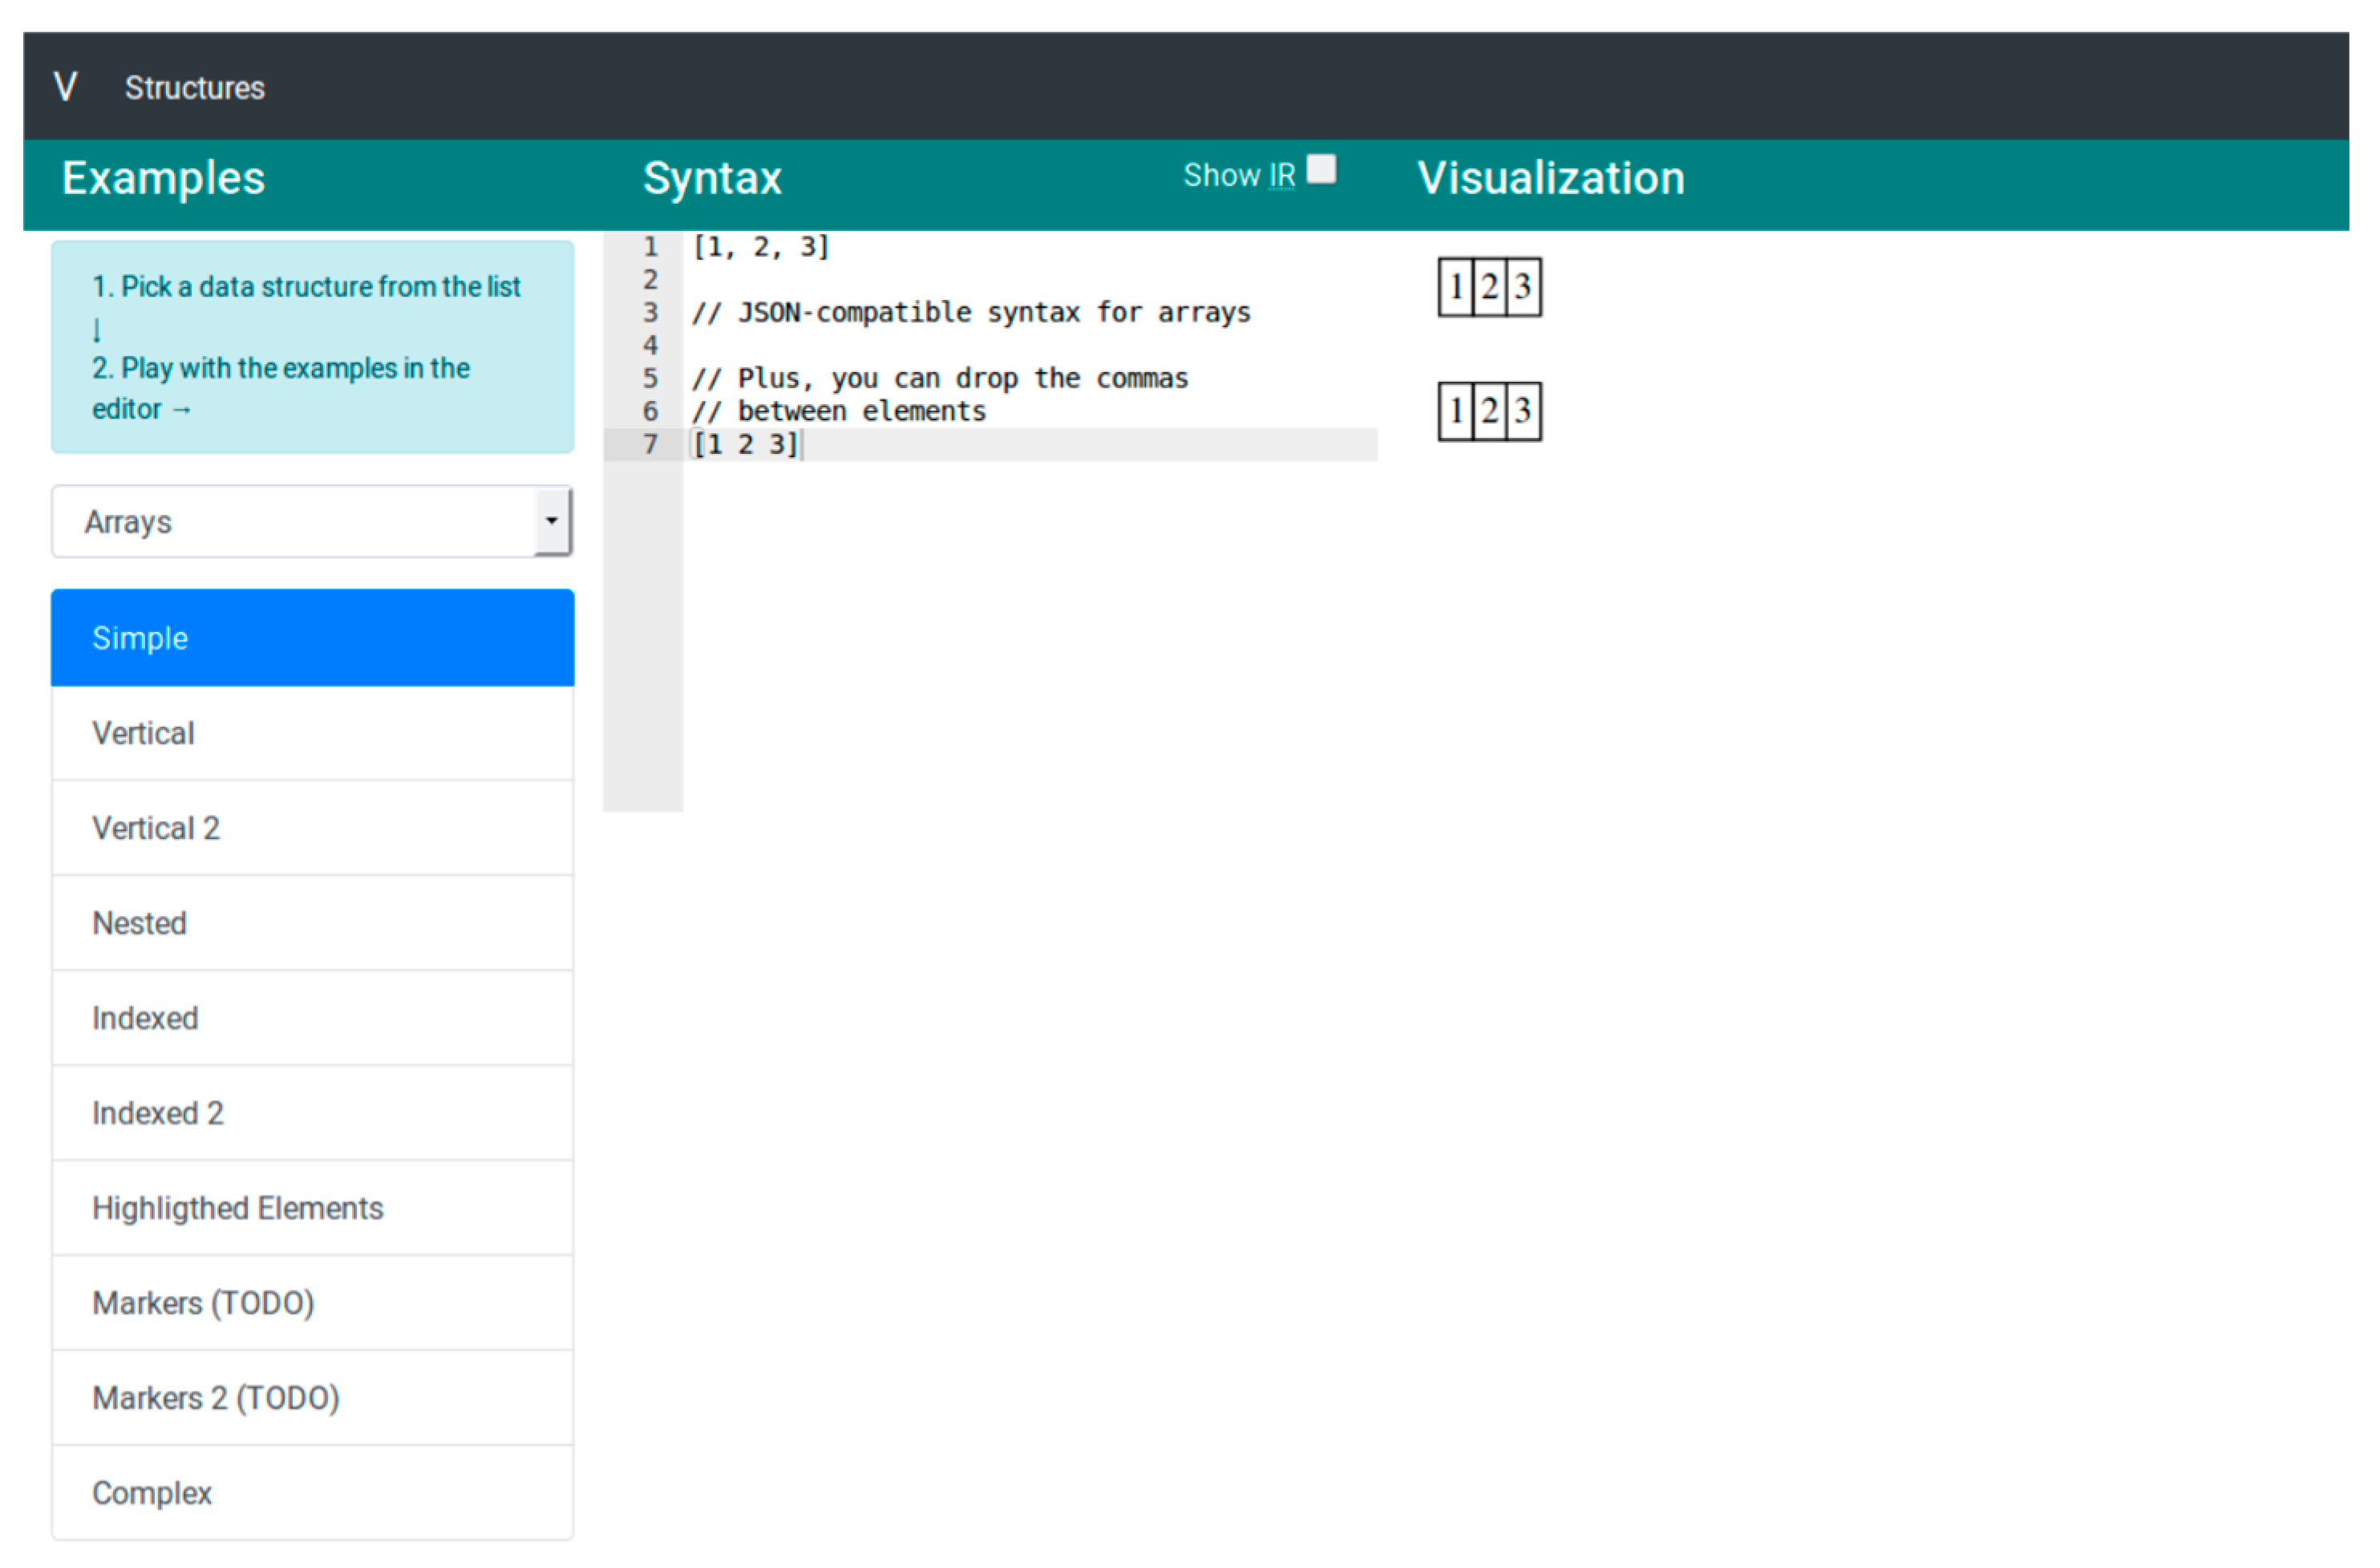
A web application was developed that allows users to use the language in an interactive way to generate visualizations in real time. This application includes a series of examples that allows users to explore the different data structures supported by the language. The web application consists, visually, of 4 components: (a) Selector of examples, (b) Source code editor, (c) Editor of the intermediate representation (hidden by default) and (d) Visualizer (
Figure 2).
The examples are grouped according to the data structure. Once an example is selected, the application loads the code of the example in the edition area, execute the interpreter and generate the corresponding visualization. The application uploads the “Arrays” category by default and shows the first associated example. The user can make changes in the code editing area and see these changes reflected in real time in the visualization. Optionally, the user can choose to display a second editing area in which he/she will find the intermediate representation of the language (JSON format). The user can also make changes in this area and see the changes in the viewer reflected immediately. Since both the interpreter and the visualization are written in JavaScript, the application is, effectively, a single page application that does not need a web server to work, but only to be loaded in the browser in a static way once.
Additionally, the application does not need to make additional connections or have Internet to interpret a piece of code or generate a visualization, because all these tasks are performed locally in the user’s browser.
6. User Acceptance
In order to perform a user acceptance study, we made the tool available at:
http://we-app.herokuapp.com/. The same site (still accessible) includes self-explanatory examples. No other documentation was made available. We then openly invited people to try the system and then answer a short questionnaire. We received 19 answers, of which 42.1% were software developers, 26.3% were university students, 21.1% were university educators, and 10.5% classified themselves as “other”.
From the received questionnaires, 52.6% stated the tool “would definitively be very useful to me” whereas 41.1% mentioned the tool would be useful for them at some time. Concerning clarity of the language, 63.2% of the respondents considered the language was very clear, while the rest (36.8%) considered the language “clear enough”. The answers to a question about visualizations generated by the tool were as follows: 68.4% considered the visualizations had “much relation to the language expression” and the rest of the respondents (31.6%) mentioned the visualizations had “enough relation to the language expression”.
Two questions were on the speed of the application. Concerning the initial start (which means about 3 Mbytes to be transferred to the users’ computers), the delay does not seem to worry the users: 73.7% of the users considered the start to be fast. Now, once loaded, the application works on the browser and that means very fast operation; all respondents agreed, considering the tool to be “very fast”.
The questionnaire also included open questions. One question invited respondents to provide their candid opinion in a few words. Most opinions were very positive. One respondent said: “There is a tight correspondence between what one writes in the language and what is shown visually”. Another user stated “One feels like the language would understand what I want to say”. A third one mentioned “It is cool to show tables; other ways of getting figures require ascii very cumbersome to align”. Another respondent said “It seems to me that the tool is ready to go to deployment”.
7. Conclusions
The results of the evaluation indicate the proposal is acceptable. The intended use is for both teachers and students of Computer Science. Of course, the language and the tool can be improved. In fact, the users who tested the system made some suggestions. One line of future study is the possibility of including additional data structures. There is no claim of uniqueness in the solution described above. Other approaches may include algorithm animation, which we excluded in the first version of the tool.
Finally, we may notice the described solution can be used for other purposes besides the educational one. One field of application is software documentation: programmers need to explain an algorithm in a way different than programming code; the visualization of the data structures over which the program operates provides an opportunity to make that explanation easy to understand by another programmer.

