Proceeding Paper

Correction of Thermographic Contrast Values in Relation to the Average Temperature of the Region for Comparative Analysis of Anomalies Exposed to Different Thermal Flows †

Post Graduate Program in Structures and Construction—Campus Universitário Darcy Ribeiro, University of Brasília, Brasilia 70910-900, Brazil
*
Author to whom correspondence should be addressed.
Presented at the 15th International Workshop on Advanced Infrared Technology and Applications (AITA 2019), Florence, Italy, 17–19 September 2019.
Proceedings 2019, 27(1), 23; https://doi.org/10.3390/proceedings2019027023
Published: 23 September 2019

Abstract

:
In the field of civil construction, infrared thermography can be used as a tool for inspection of building elements such as facade inspection. The large amount of variables involved in the thermal flow acting on the facade of a building makes it difficult to compare different points of the facade. This work suggests the correction of the thermographic contrast values of the anomalies (Delta-T) in the relation at the average temperature of the region in which the anomaly is located. The results demonstrate a good correlation between the values of Delta-T and the adjusted Delta-T, thus legitimizing the use of adjusted Delta-T as a function of thermographic contrast.

1. Introduction

Delamination between ceramic tiles and their substrate and the resulting detachment are among the most common durability problems observed in adhered ceramic claddings, which also give rise to safety considerations [1,2,3,4].
One of the methods that can be used to inspect facades is the Infrared Thermography (IRT). This technics stands out because it’s a non-destructive and remote inspection that can be used to detect delamination, cracks and moisture [5,6,7].
The detachments are visualized using thermography due to the small thickness of most of the materials used in the coating system and the presence of air between layers resulting in the loss of adhesion between them, which affects the heat flow in the region of the anomaly [4].
The anomalies can be studied by graphic representation and contrast functions like Delta-T indicated in equation 1, where Ta means the temperature of the anomaly and Tr the temperature of the region without defect. The contrast functions are used to analyze how well detectable an anomaly is, therefore, the greater the value of the contrast function, the easier it is to detect an anomaly [8].
Delta-T = Ta - Tr
The large amount of variables involved in the thermal flow acting on the facade of a building makes it difficult to compare different points of the façade [5,8,9,10,11,12]. The height of the region of the facade in relation to the base of the building changes the average temperature of the region. This is due to the fact that the regions closest to the base are exposed to the incidence of radiation mainly reflected from the soil and neighboring buildings [4]. Aiming at comparing anomalies in different heat flows, this work suggests the correction of the thermographic contrast values of the anomalies (Delta-T) in the relation at the average temperature of the region in which the anomaly is located through the adjusted Delta-T (Delta-Ta) showed in the Equation (2), where Tm means the average temperature of the region where the anomaly is.
Delta-Ta= 100· DeltaT Tm

2. Materials and Methods

It were inspected 24 facades regions of 4 buildings located in Brasília, Brazil. In these regions were detected 163 cases of delamination, which were quantitatively studied by the calculation of the Delta-T and Delta-Ta.
In the inspections was used The Flir T-420 infrared camera with −20 to 120 °C temperature range, 7.5 to 13.0 μm spectral range, 320 × 240-pixel resolution, equipped with a 15° telescopic lens with an IFOV of 0.820 mrad. Relative humidity and air temperature were measured by an EXTECH MO297. The distance measurements were performed using a BOSCH laser, GLM80 model. The apparent reflected temperature was determined by the corrugated aluminum foil method, according to ASTM E1862. The used emissivity was 0.82.
The facades were divided into smaller regions so that they could be analyzed separately, increasing the precision of the values of average temperature obtained. The Delta-T was calculated by the linear method [13].

3. Results

The temperature variation due to the height of the region relative to the base of the building shown in the Figure 1 indicates the need to correct the anomaly Delta-T for anomaly comparison in different regions.
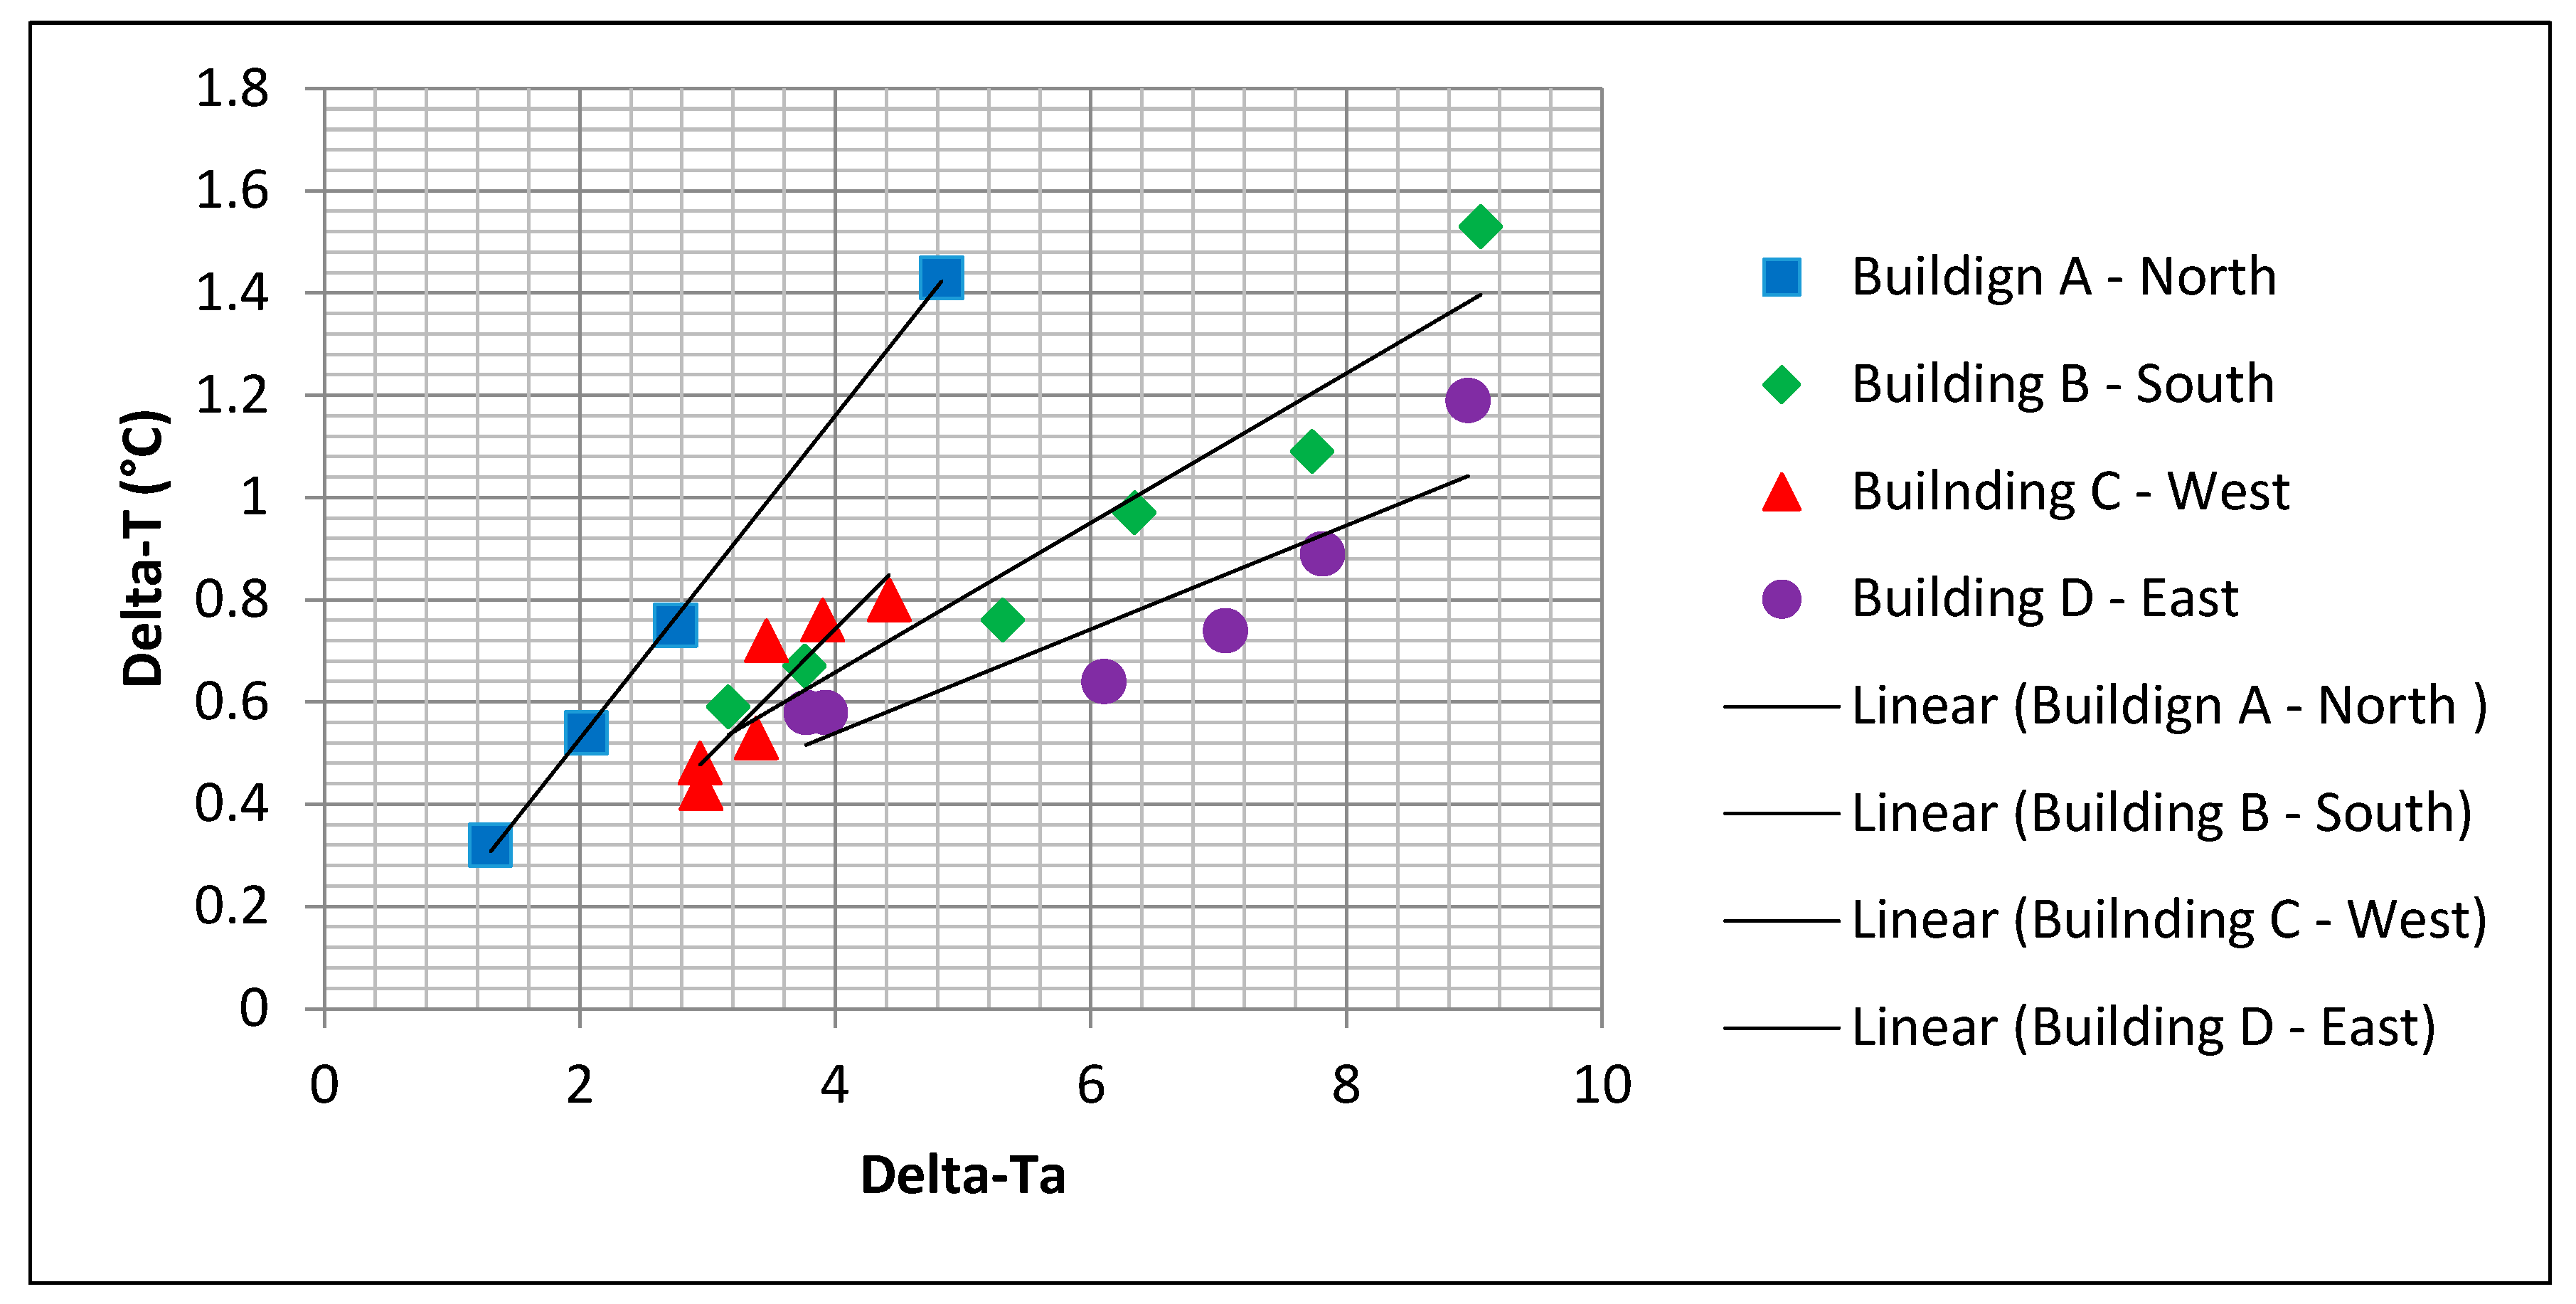
The values of Delta-T and Delta-Ta were analyzed together in order to verify if there was any correlation between them. The Figure 2 indicates examples of comparison between this values for the buildings A, B, C e D.

4. Discussion

Data on Delta-T and Delta-Ta by mean region temperature showed similar behavior. This indicates the possibility of the use of the second one for the analysis of the thermographic contrast of anomalies.
The use of the adjusted Delta-T (Delta-Ta) is justified for comparison of anomalies in different thermal flow conditions, such as anomalies in facades with different orientations or anomalies at different heights in the same facade.
The lowest value of Delta-Ta found for the 163 cases of detachment studied was 1,24 in the north façade of the building A. For this case the temperature profile confirms the presence of the ceramic detachment. Thus, it can be stated that regions with Delta-T values above 1.24 probably will indicate the presence of ceramic detachments.

5. Conclusions

The results show that the Delta-Ta can be used as a contrast function since its values show a good correlation with the values of Delta-T. The use of the Delta-Ta enables the comparison between anomalies exposed to different heat flows which allow the prioritization of anomalies recovery according to the degree of damage of these.

References

  1. Edis, E.; Flores-Colen, I.; de Brito, J. Building Thermography: Detection of Delamination of Adhered Ceramic Claddings Using the Passive Approach. J. Nondestruct. Eval. 2015, 34, 1. [Google Scholar] [CrossRef]
  2. Edis, E.; Flores-Colen, I.; de Brito, J. Time-Dependent Passive Building Thermography for Detecting Delamination of Adhered Ceramic Cladding. J. Nondestruct. Eval. 2015, 34, 1. [Google Scholar] [CrossRef]
  3. Bauer, E.; de Freitas, V.P.; Mustelier, N.; Barreira, E.; de Freitas, S.S. Infrared thermography—Evaluation of the results reproducibility. Struct. Surv. 2015, 33, 20–35. [Google Scholar] [CrossRef]
  4. Aidar, L. Metodologia de inspeção e análise de termogramas para estudo de fachadas em revestimento cerâmico. Universidade de Brasília 2019, 1, 356. [Google Scholar]
  5. Ibarra-Castanedo, C.; Sfarra, S.; Klein, M.; Maldague, X. Solar loading thermography: Time-lapsed thermographic survey and advanced thermographic signal processing for the inspection of civil engineering and cultural heritage structures. Infrared Phys. Technol. 2017, 82, 56–74. [Google Scholar] [CrossRef]
  6. Bauer, E.; Pavón, E.; Barreira, E.; de Castro, E.K. Analysis of building facade defects using infrared thermography: Laboratory studies. J. Build. Eng. 2016, 6, 93–104. [Google Scholar] [CrossRef]
  7. Bagavathiappan, S.; Lahiri, B.B.; Saravanan, T.; Philip, J.; Jayakumar, T. Infrared thermography for condition monitoring—A review. Infrared Phys. Technol. 2013, 60, 35–55. [Google Scholar] [CrossRef]
  8. Maldague, X. Theory and Practice of Infrared Technology for Nondestructive Testing, 1st ed.; SciTech Book News: Springer-Verlag, London, 2001; Volume 1, p. 230. [Google Scholar]
  9. Fox, M.; Coley, D.; Goodhew, S.; de Wilde, P. Time-lapse thermography for building defect detection. Energy Build. 2015, 92, 95–106. [Google Scholar] [CrossRef]
  10. Barreira, E.; Almeida, R.M.S.F.; de Freitas, V.P.; Soares, T. Sensitivity analysis of quantitative infrared thermography. 1st Int. Symp. Build. Pathol. 2015, 1, 6. [Google Scholar]
  11. Taylor, T.; Counsell, J.; Gill, S. Combining thermography and computer simulation to identify and assess insulation defects in the construction of building façades. Energy Build. 2014, 76, 130–142. [Google Scholar] [CrossRef]
  12. Pearson, C. Thermal Imaging of Building Fabric; BSRIA: Bracknell, UK, 2011. [Google Scholar]
  13. Pavón, E. Critérios e padrões de comportamento para avaliação de descolamentos cerâmicos com termografia de infravermelho. Universidade de Brasília (UnB) 2017, 1, 250. [Google Scholar]
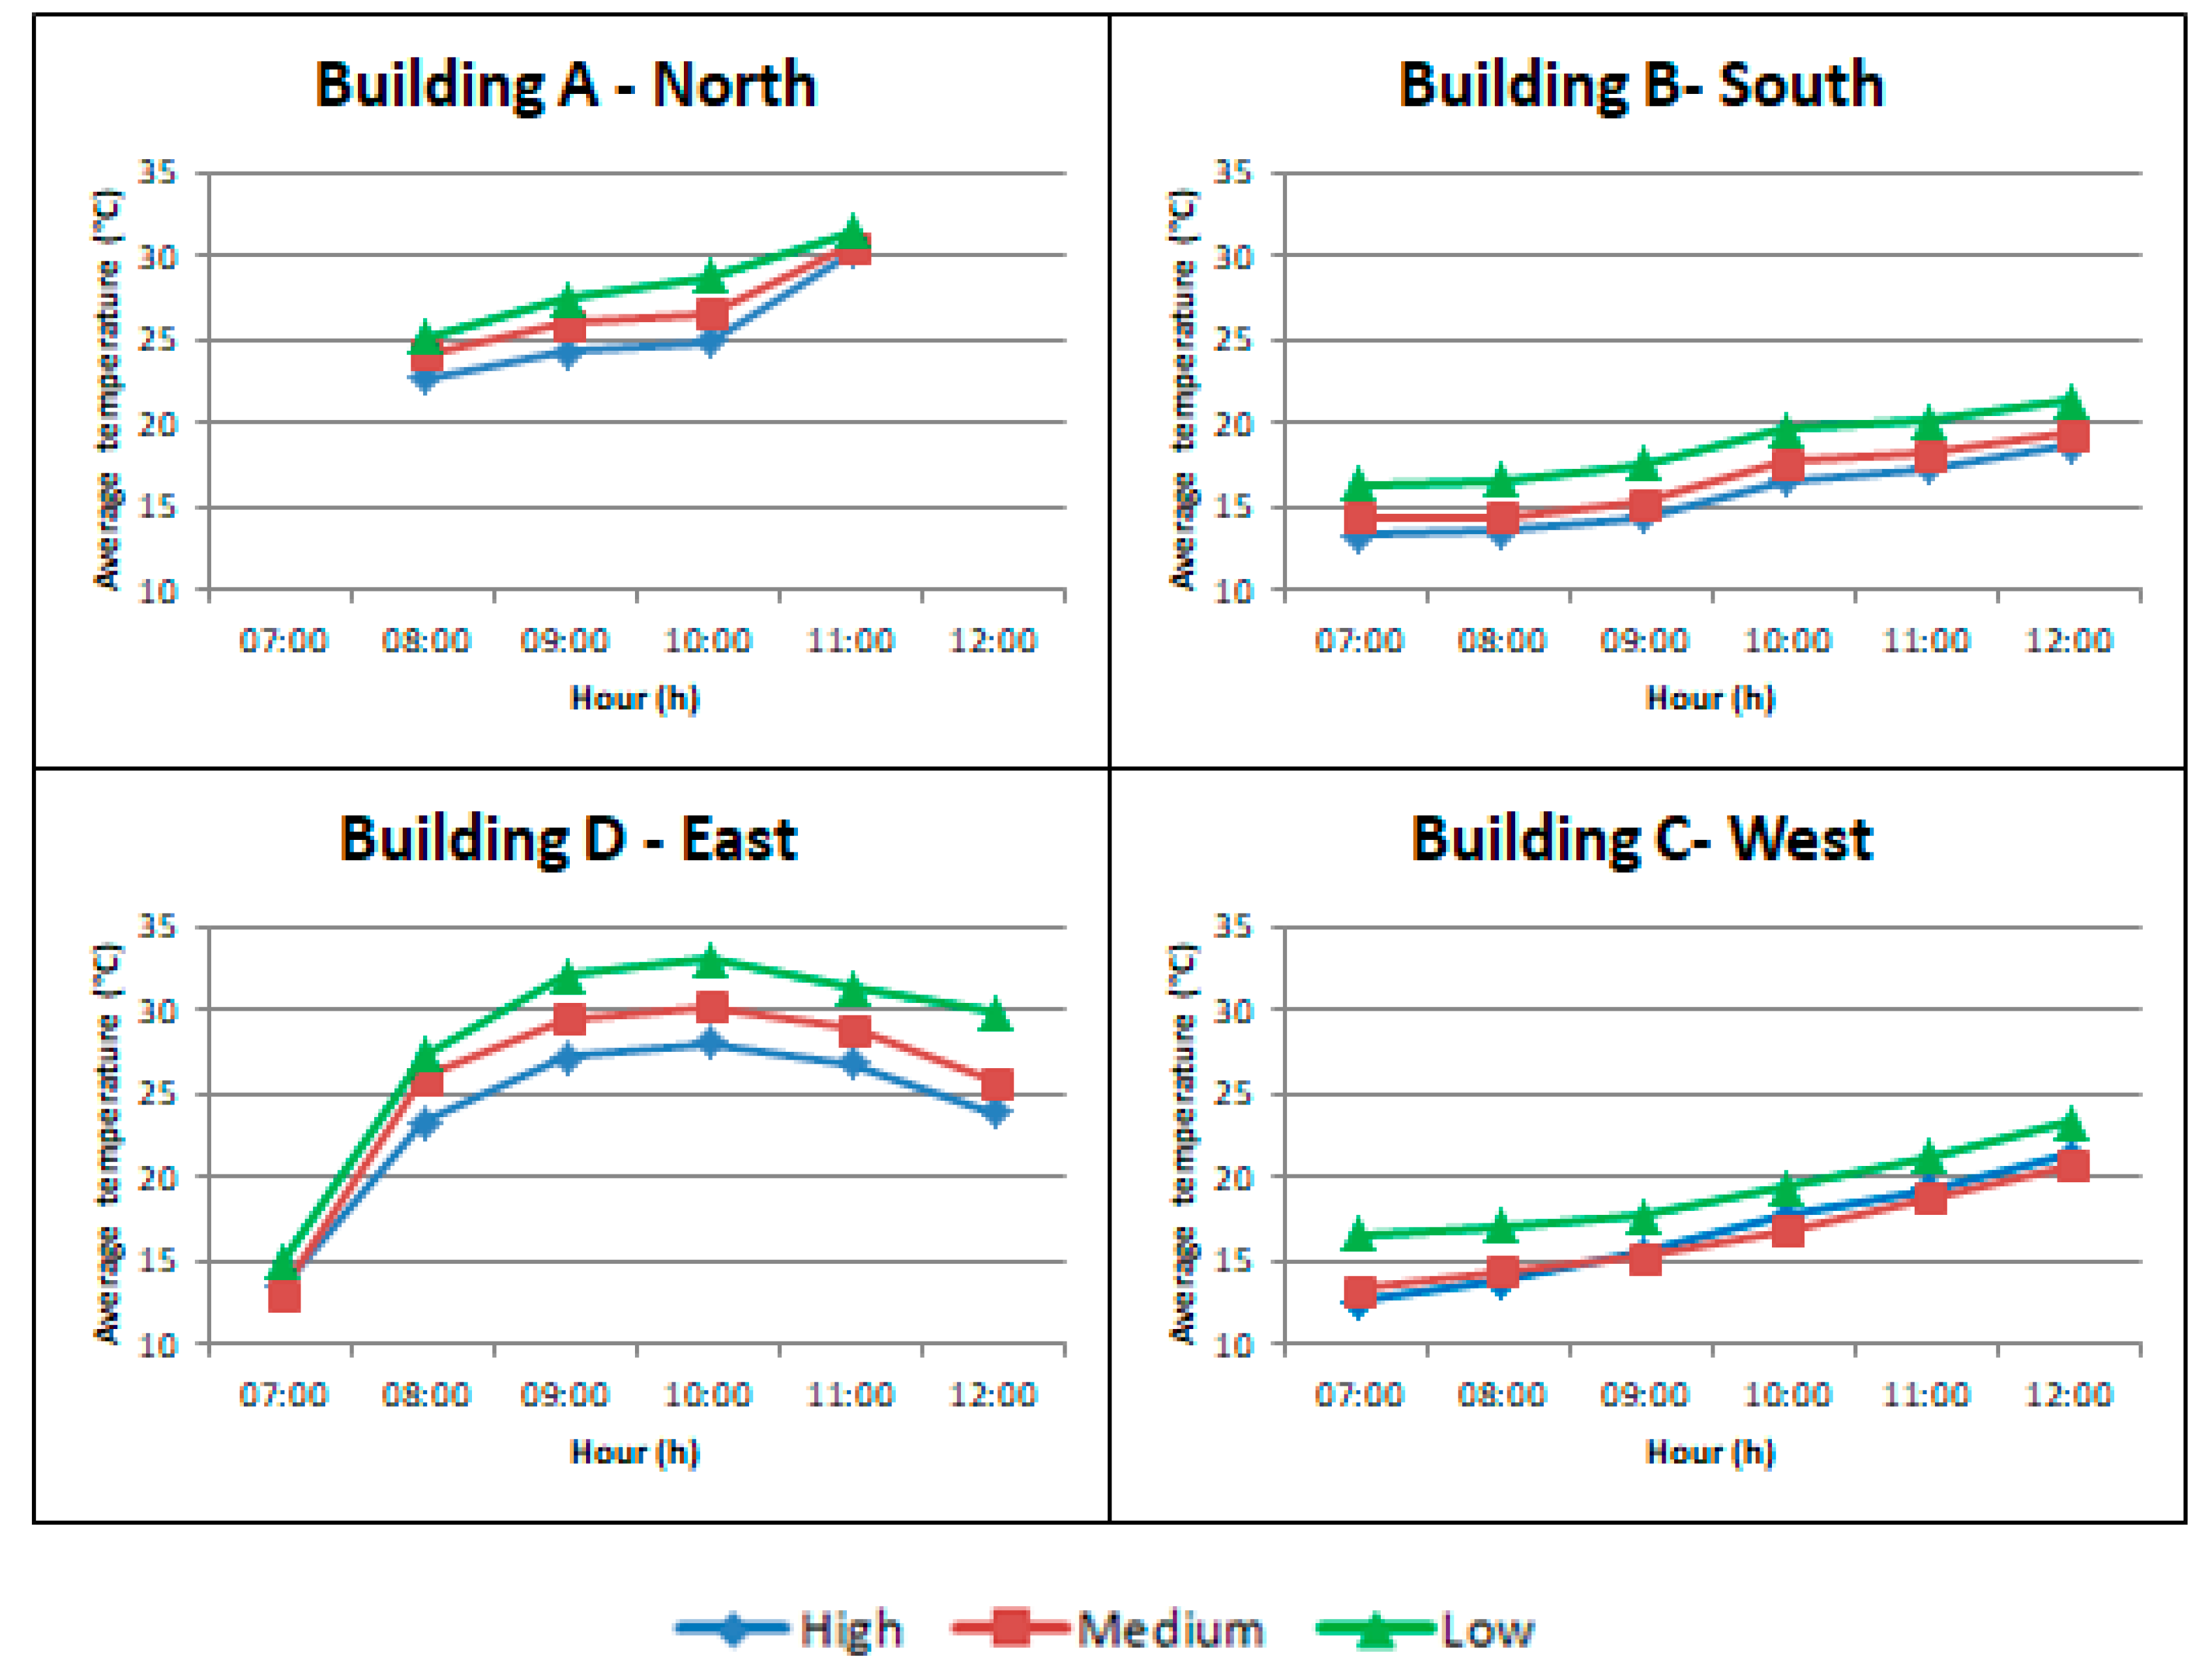
Figure 1. Variation of average temperature with height.
Proceedings 27 00023 g001
Figure 2. Comparison between Delta-T and Delta-Ta.
Proceedings 27 00023 g002
Publisher’s Note: MDPI stays neutral with regard to jurisdictional claims in published maps and institutional affiliations.