Proceeding Paper

Relationship between Inspection Time and Frequency Components of Input and Reflected Thermal Waves in Active Thermographic Non-Destructive Inspection †

1
Graduate School of Technology, Industrial and Social Sciences, Tokushima University, Tokushima 770-8506, Japan
2
School of Science and Engineering, Meisei University, Tokyo 191-8506, Japan
3
Department of Civil Engineering, Nihon University, Fukushima 963-8642, Japan
4
Japan Aerospace Exploration Agency, Kanagawa 252-5210, Japan
*
Author to whom correspondence should be addressed.
Presented at the 15th International Workshop on Advanced Infrared Technology and Applications (AITA 2019), Florence, Italy, 17–19 September 2019.
Proceedings 2019, 27(1), 16; https://doi.org/10.3390/proceedings2019027016
Published: 21 September 2019

Abstract

:
Experiments and numerical simulations for a carbon fiber reinforced plastic specimen were performed to investigate the relationship between the time required for detecting subsurface defects and the frequency components of the thermal waves propagating within the specimen. Experimental results showed that the required inspection time was shortened by increasing the frequency of the input thermal wave. However, if the attenuation during thermal wave propagation is large enough to render the detection of the thermal wave reflected at the subsurface defect impossible, the inspection time exceeds the time estimated by theoretical calculation.

1. Introduction

Active thermographic non-destructive inspection is used in many fields because it is a noncontact yet convenient method. However, it has a disadvantage in that it requires a long time to detect subsurface defects in low-thermal-conductivity materials. Thus, a technique that can help shorten the inspection time is desired from the viewpoint of practical applications.
When a periodic temperature variation is generated on the surface of an object, the heat propagation speed in the object (v) is obtained from one-dimensional thermal wave theory as [1]
v = π α f  
where α and f are thermal diffusivity of the object and frequency of the periodic temperature change respectively. This equation indicates that v increases with increasing f. Therefore, by using thermal waves of high frequency, the inspection time is expected to shorten because the input heat propagates to the subsurface defects in a shorter time. However, it is known that thermal waves are attenuated during propagation, and the attenuation ratio drastically increases with f. Thus, the effect of shortening the inspection time should be discussed in conjunction with the attenuation of thermal waves for each frequency.
In this study, firstly we verified that the inspection time of active thermographic method became shorter when using thermal waves with higher frequency components. Then, we examined the frequency components of thermal waves that were input to a surface, reflected at the boundaries of the subsurface defects, and returned to the heated surface through experiments and numerical simulations, and investigated the relationship between the time required for detecting the subsurface defects and the frequency components of the thermal waves during propagation.

2. Experiments

2.1. Experimental Setup

A CFRP specimen used in the experiments was a plate of dimensions 200 × 200 × 20 mm having some flat-bottomed holes as artificial defects. The defect sizes were φ20 mm, and their depths from the heated (flat) surface (d) varied from 0.5 to 15 mm (in this study, only defects with d = 0.5–4 mm were focused on). The surface of the specimen was periodically heated using a halogen lamp controlled by a function generator to generate thermal waves that had an arbitrary spectral peak. The excitation frequency of the periodical heating (fE) was varied as 0.01, 0.02, and 0.05 Hz. In the experiments, the temperature of the surface during heating was monitored using an infrared camera (A315, FLIR Systems, Inc.), and the relationship between the time required for detecting each depth defect (td) and fE were examined. It should be noted that in the process of determining td, phase data obtained by applying Fourier transform to the observed temperature data [2,3] was used; td was determined as the inverse of the frequency of the phase image from which the defect was detected.

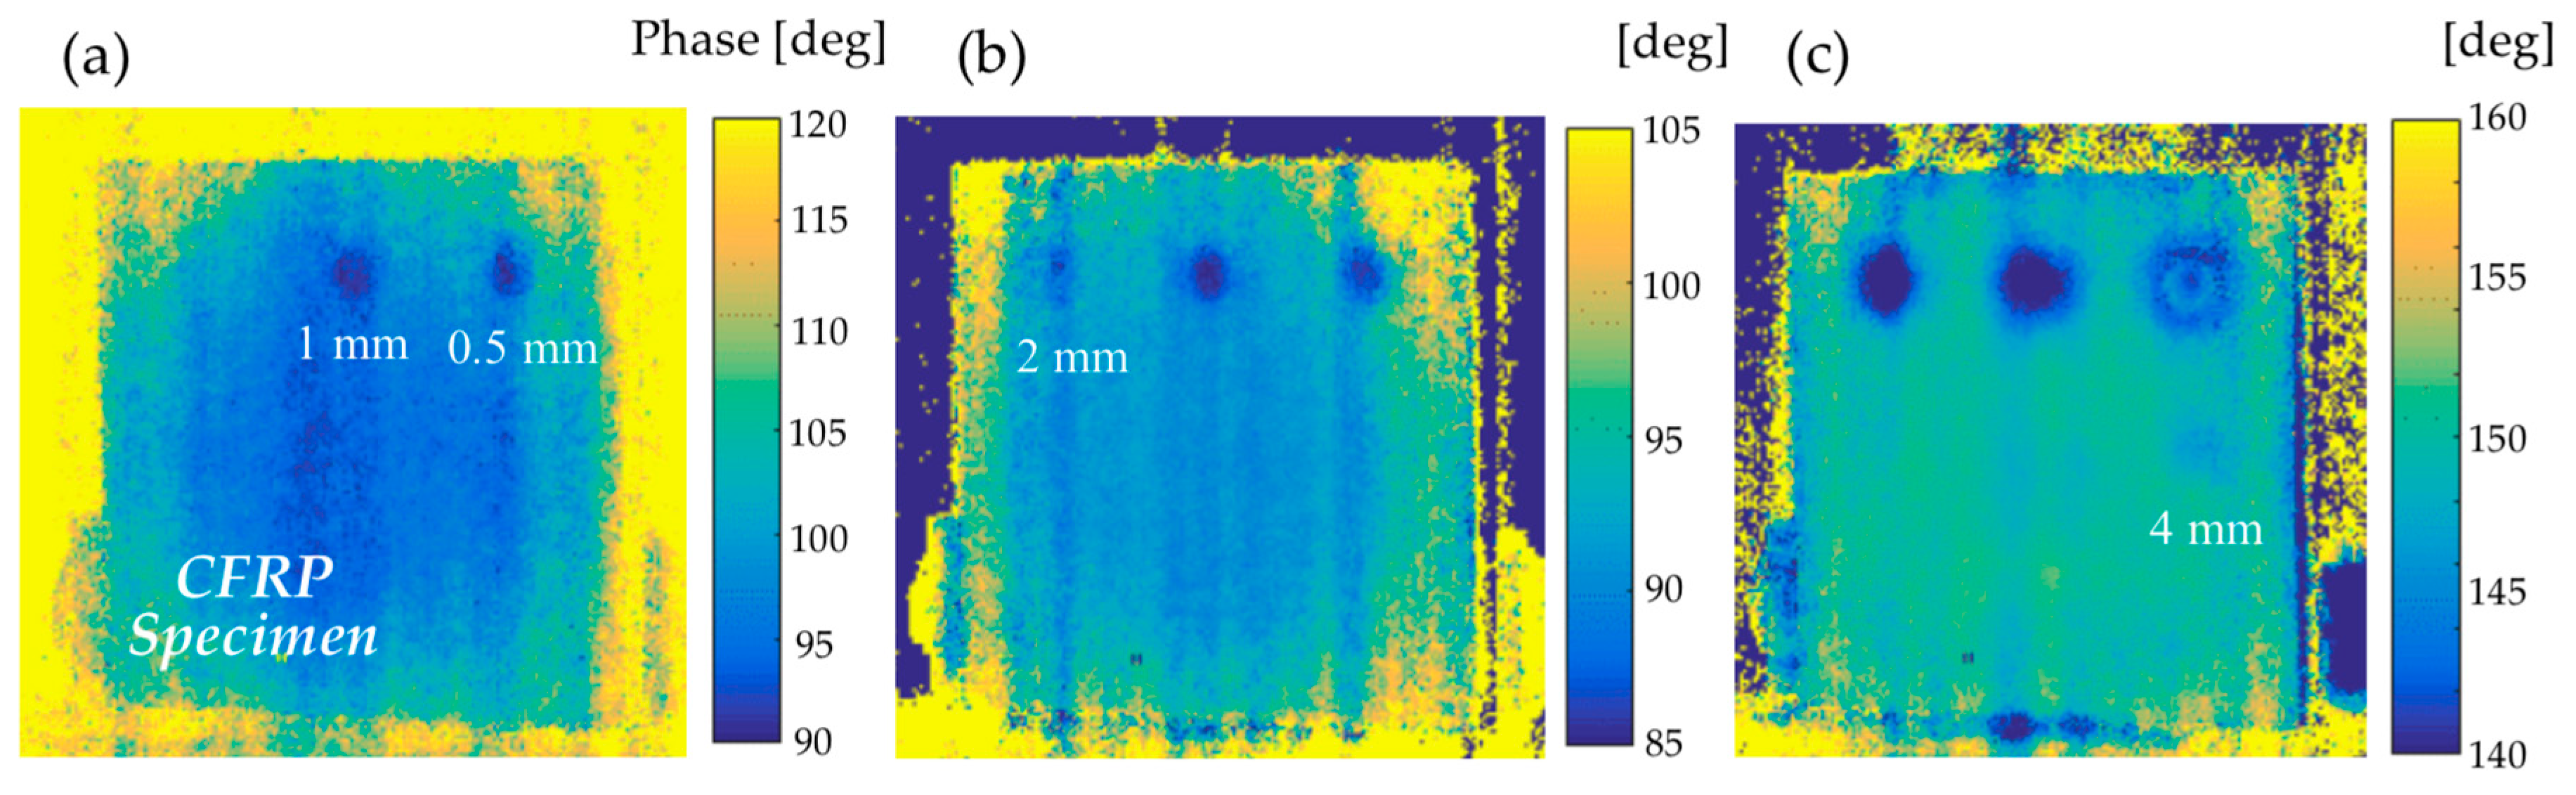
2.2. Experimental Results

Figure 1 shows phase images obtained when fE = 0.01 Hz; the phase images were obtained from temperature data for 8, 14, and 34 s. Some of the defects are identified by local phase differences, and the deeper defects can be detected in the phase images obtained for longer-duration temperature data. Figure 2 shows the relationship between td and fE for defects with depths of 1, 2, and 4 mm. In Figure 2, the theoretically estimated tds calculated using Equation (1) (calculated as the round-trip propagation time between the heated surface and defect for α = 0.36 mm2/s) are also presented. It is observed from this figure that td decreases with increasing fE for each d. This means that the defects can be detected in shorter time using thermal waves of higher frequencies. However, the tds obtained from experiments tend to be larger than those estimated from theoretical calculations, especially when d = 4 mm.

3. Discussions with Numerical Studies

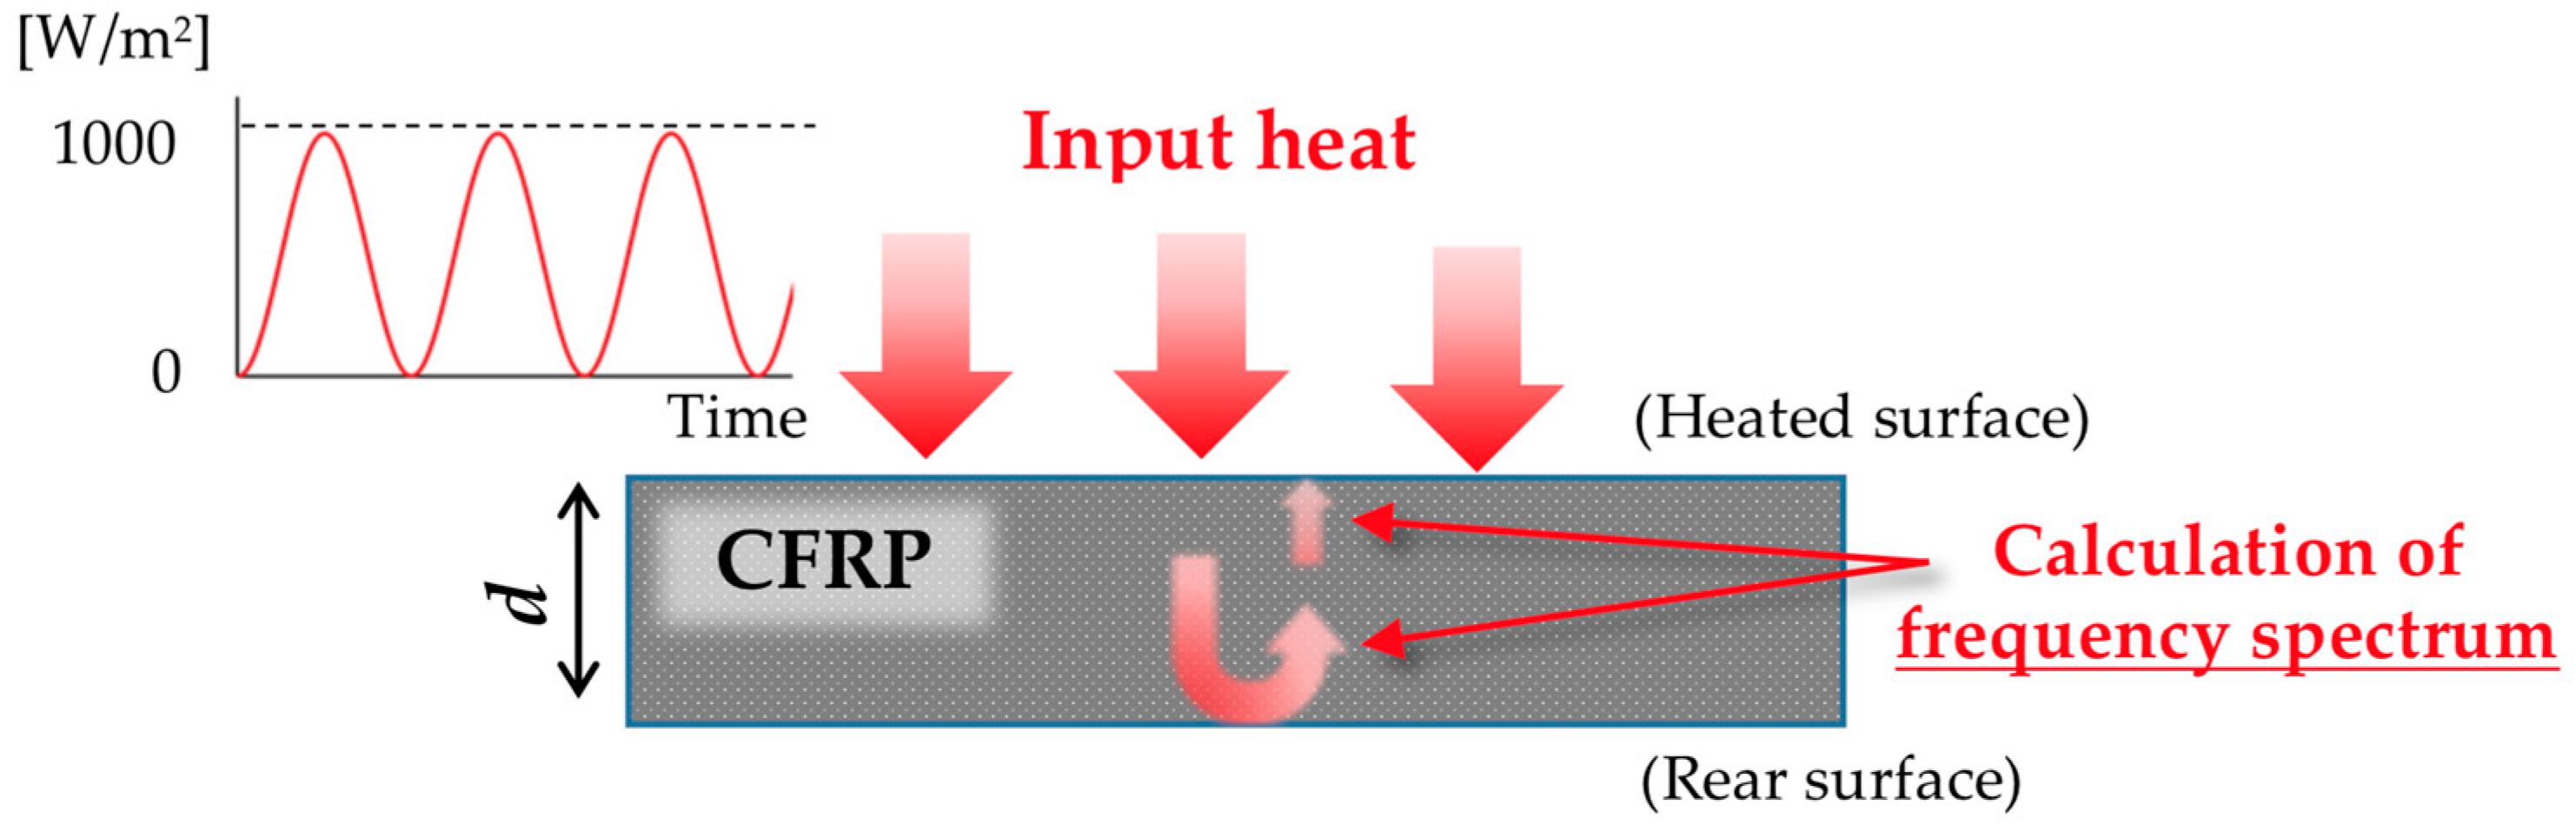
3.1. Numerical Calculations

Figure 3 shows a schematic of the numerical model simulating the inspection of the CFRP specimen. To simplify the discussion, plate models with a thickness (d) of 2 and 4 mm were considered for simulating defects with an infinite diameter, and one-dimensional thermal calculations were performed using finite element analysis. Periodic sine wave-shaped heat flux (maximum heat flux was 1000 W/m2) was applied to one surface, and the temperature on both the heated and rear sides was calculated. Then, a frequency analysis for the calculated temperatures was performed to investigate the frequency spectrum of the thermal wave that is reflected at the rear surface and that returns to the heated surface.

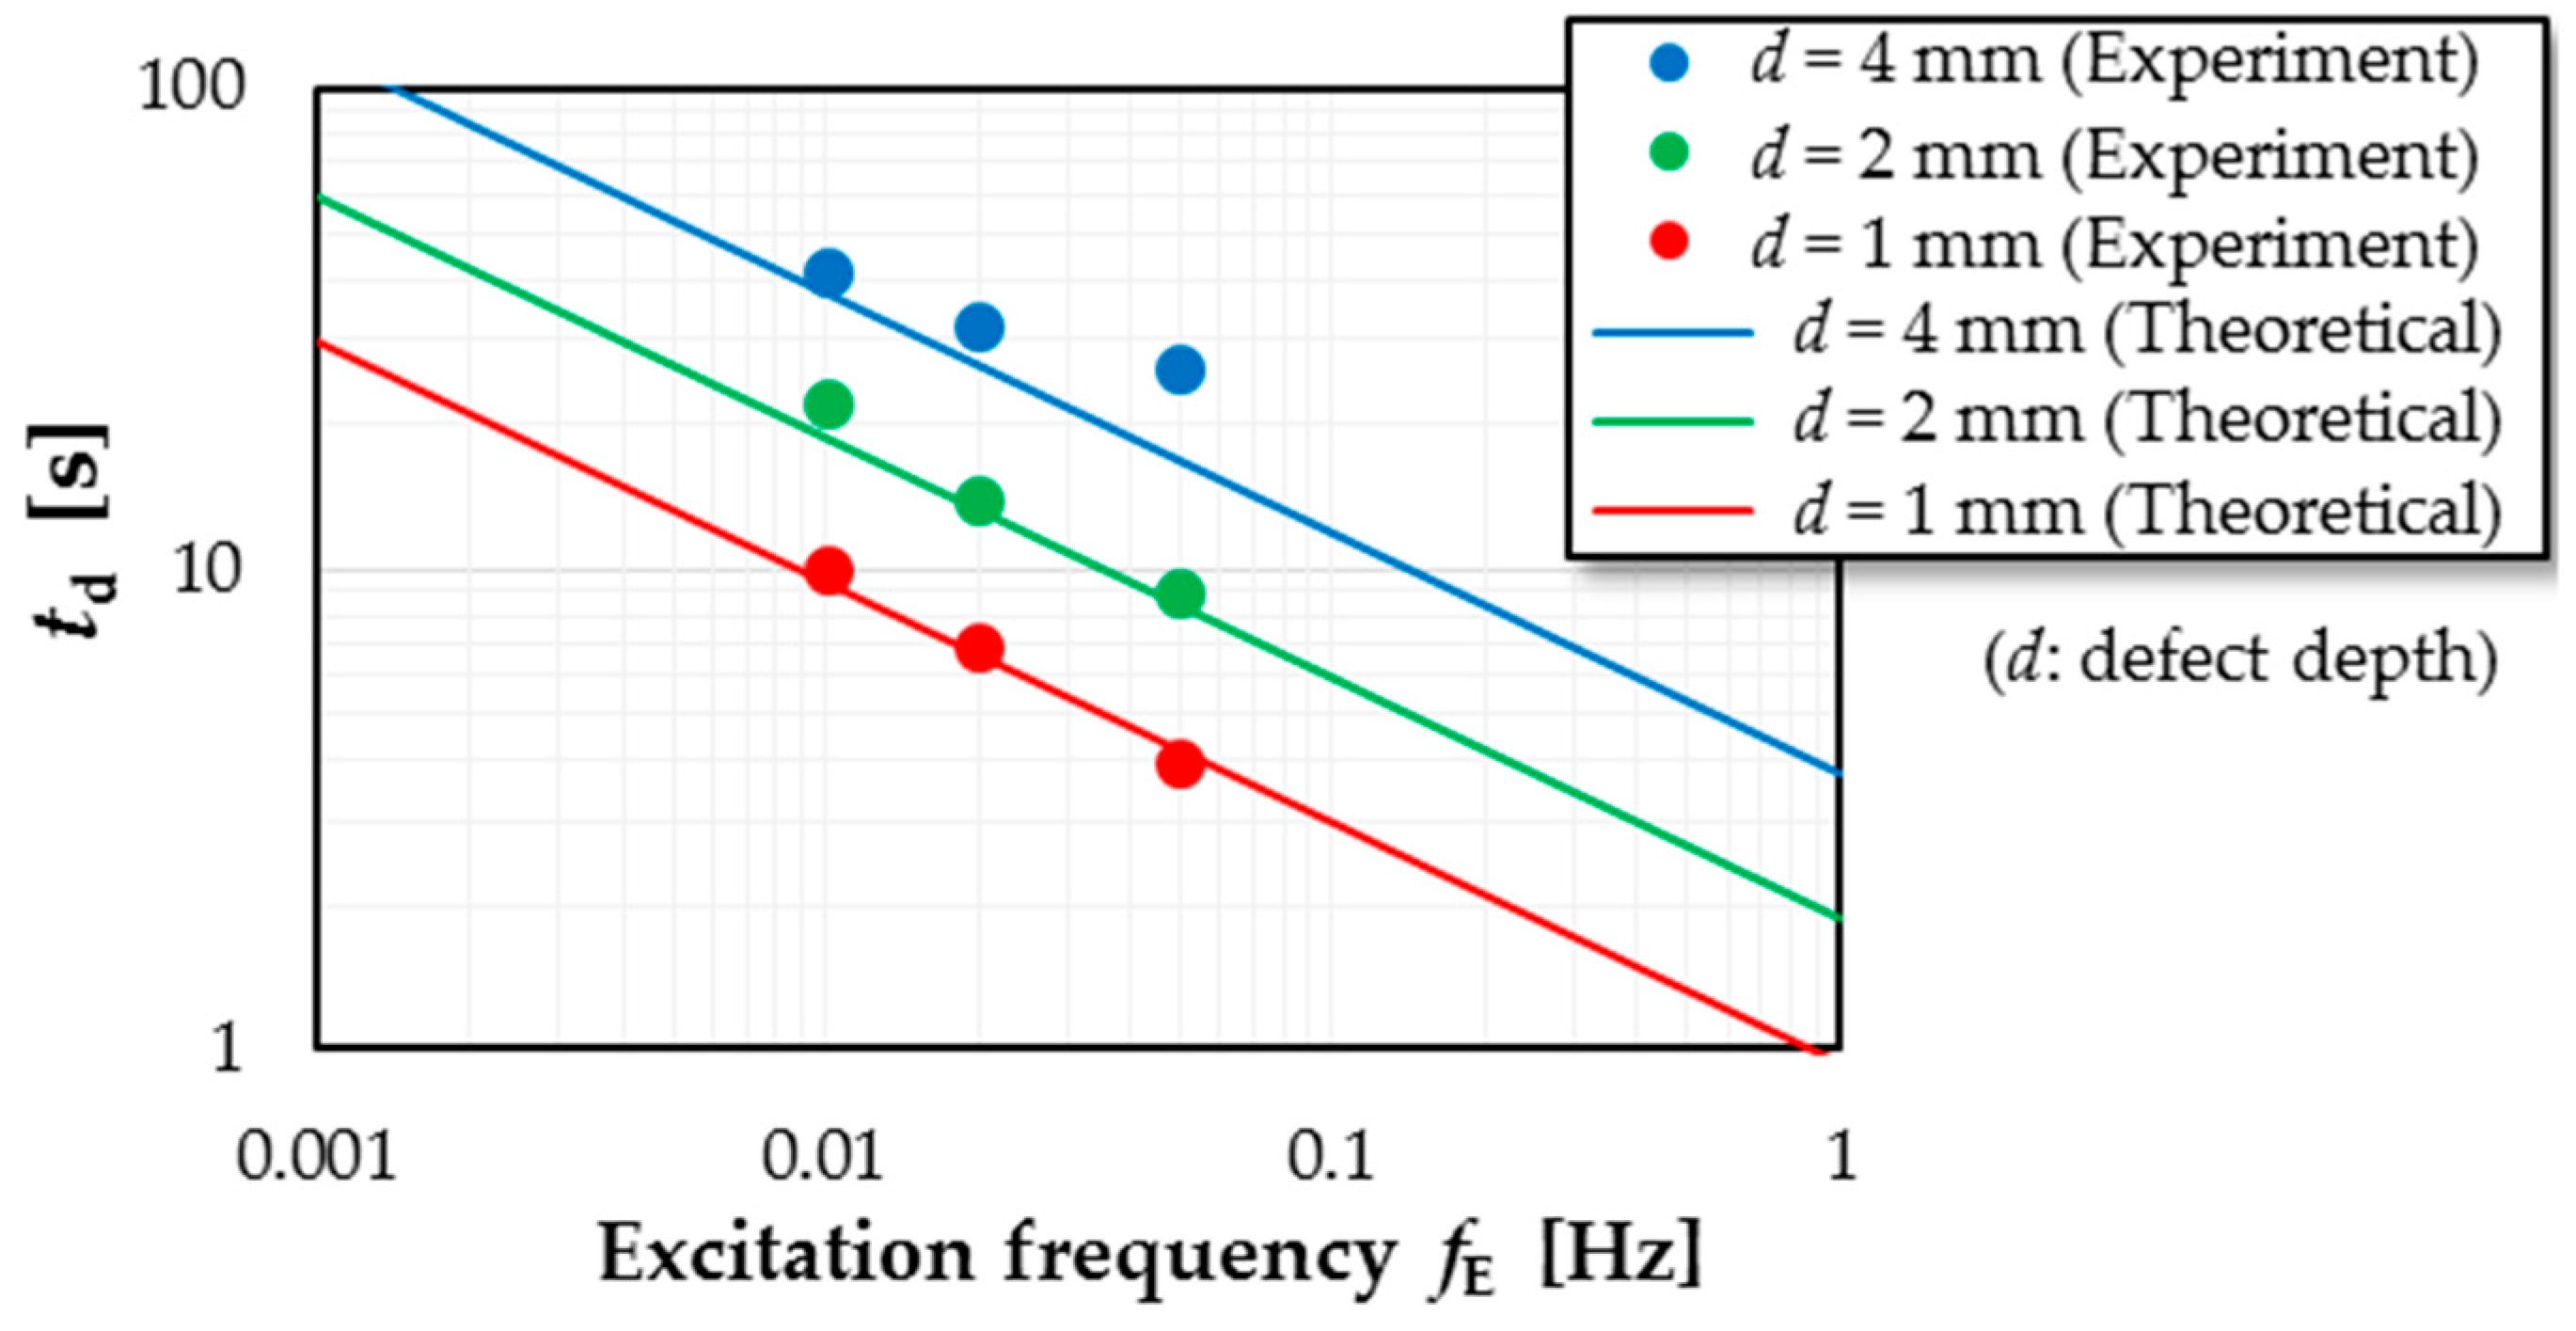
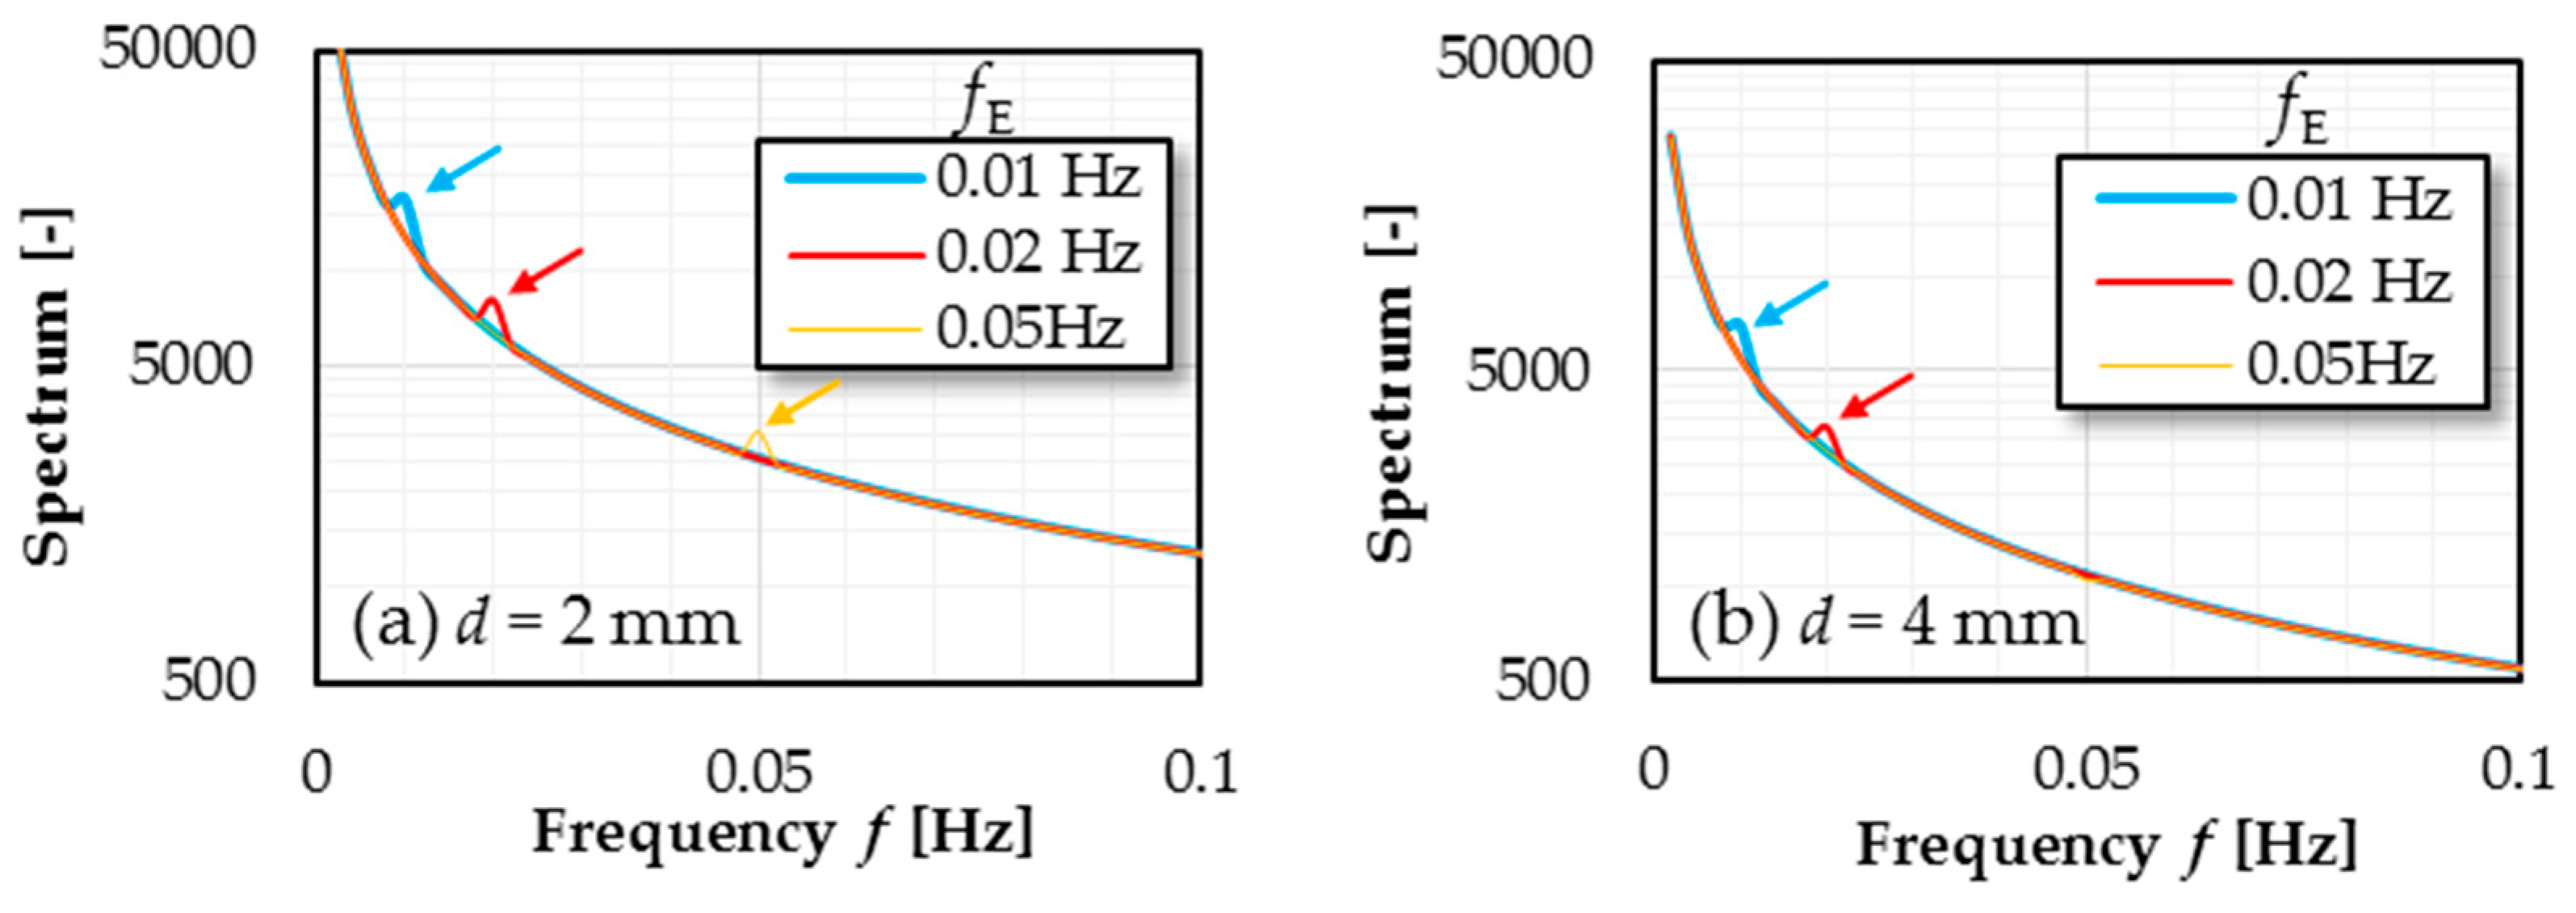
3.2. Numarical Results and Discussions

Frequency spectra of the thermal waves that are reflected at the rear surface are shown in Figure 4 and those of waves that return to the heated surface are shown in Figure 5. Although it is widely known that energy of thermal wave is drastically attenuated during propagation, Figure 4 shows that the thermal waves still have the frequency component that coincides with fE when they are reflected at the rear surface. Moreover, the results for thermal waves that return to the heated surface (Figure 5) show that the frequency peak agrees with fE when d = 2 mm and fE = 0.01 and 0.02 Hz. In contrast, the frequency peak is not observed when d = 2 mm and fE = 0.05 Hz, and when d = 4 mm.
From a comparison of the experimental and numerical results, the following discussion points can be made: (a) the experimentally obtained tds agrees with that estimated from Equation (1) when d = 1 and 2 mm and fE = 0.01 and 0.02 Hz because the input thermal wave can return to the heated surface. (b) when d = 4 mm and fE = 0.01 and 0.02 Hz, and when d = 2 mm and fE = 0.05 Hz, the input frequency component can be observed at the rear surface but cannot be observed in the thermal wave that returns to the heated surface. Hence, the frequency component of the input thermal wave is not dissipated during propagation for at least half of the round-trip distance. This should be the reason for the relative agreement of the experimental results with the theoretical estimations. (c) when d = 4 mm and fE = 0.05 Hz, the input thermal wave cannot reach even the rear surface. Thus, in this condition, it is not appropriate to consider only the excitation frequency for estimating td; td becomes larger than the estimated value because the dominant frequency contained in the returned thermal wave is lower than fE.

4. Conclusions

The relationship between the time required for detecting subsurface defects and the frequency of thermal waves used in the inspection was investigated. Experimental results showed that the inspection time can be shortened by increasing the excitation frequency. However, if the attenuation is large enough to render the detection of returned thermal waves with the excitation frequency impossible, the inspection time becomes longer than that estimated from theoretical calculation. This implies that using thermal waves with a very high frequency is not necessarily effective in shortening the inspection time. In addition, it should be noted that input heat energy also varies depending on the excitation frequency, and it influences the signal-to-noise ratio. Therefore, based on these points, selecting the appropriate excitation frequency is important for efficient inspections.

Acknowledgments

This work was supported by JSPS KAKENHI Grant Number 17K01296.

Conflicts of Interest

The authors declare no conflict of interest.

References

  1. Maldague, X. Theory and Practice of Infrared Technology for Nondestructive Testing, 1st ed.; John Wiley & Sons: New York, NY, USA, 2001; pp. 343–347. [Google Scholar]
  2. Maldague, X.; Marinetti, S. Pulse phase infrared thermography. J. Appl. Phys. 1996, 79, 2694–2698. [Google Scholar] [CrossRef]
  3. Maldague, X.; Galmiche, F.; Ziadi, A. Advances in pulsed phase thermography. Infrared Phys. Technol. 2002, 43, 175–181. [Google Scholar] [CrossRef]
Figure 1. Phase images obtained from temperature data for (a) 8 s, (b) 14 s, and (c) 34 s. Artificial defects are detected as local negative-phase regions; the numerals in the figures show the defect depths.
Proceedings 27 00016 g001
Figure 2. Experimentally obtained relationship between time required for detecting each depth defect (td) and excitation frequency (fE). Theoretically estimated tds (calculated as round-trip time of thermal wave propagation between CFRP surface and defect) are presented as solid lines.
Proceedings 27 00016 g002
Figure 3. Schematic of numerical calculation to examine the frequency spectrum of thermal waves propagating in the CFRP specimen.
Proceedings 27 00016 g003
Figure 4. Numerically obtained frequency spectra of thermal waves that are reflected at the rear surface when plate thickness (defect depth) is (a) 2 mm and (b) 4 mm.
Proceedings 27 00016 g004
Figure 5. Numerically obtained frequency spectra of thermal waves that return to the heated surface when plate thickness (defect depth) is (a) 2 mm and (b) 4 mm.
Proceedings 27 00016 g005
Disclaimer/Publisher’s Note: The statements, opinions and data contained in all publications are solely those of the individual author(s) and contributor(s) and not of MDPI and/or the editor(s). MDPI and/or the editor(s) disclaim responsibility for any injury to people or property resulting from any ideas, methods, instructions or products referred to in the content.

