1. Introduction
Cancer remains the world’s grand challenge. There is an urgent need for development of new techniques first for cancer screening, diagnosis, and then for intraoperative surgical guidance. Raman scattering has long been used to assess chemical compositions in cells and tissues, based on interaction with the vibrational modes of common molecular bonds in the sample. Thus, the alteration of molecular signatures in a cell or tissue undergone disease transformation can be detected by Raman scattering noninvasively without labelling. It is conceivable that Raman spectroscopy (RS) is a desirable tool for cancer diagnosis [
1,
2,
3].
In the last decade, RS has demonstrated to be a label-free and non-destructive optical spectroscopy able to improve diagnostic accuracy in cancer diagnosis. RS is a technique, which relies on inelastic scattering of monochromatic light, usually a laser with wavelengths falling in the Ultraviolet-Visible-Near Infrared range. The laser light interacts with molecular vibrations resulting in the energy of the laser photons being shifted up or down. The shift in energy deals out essential information about the vibrational modes of biochemical components in cells and biological tissue.
In this paper, we demonstrate the ability of Thermo Scientific™ DXR™2 microscope to discriminate between subcellular components between normal or cancer cells or, at level of tissues, to discriminate and grading chondrogenic tumors giving the possibility to grade without a doubt the level of malignancy of the cartilaginous tumors under investigation.
2. Materials and Methods
We have applied the RS to samples composed either by singles cells (MSC, osteo-differentiated and osteosarcoma cells) or chondrogenic tissues. Details on such samples can be found in [
4,
5], respectively. Here, we briefly report on some specific details on cell culture and Raman spectroscopy detection mode.
3.1. Cell Culture
Normal and cancerous cells were cultured on glass slides, as follows:
(i) Undifferentiated MSCs. MSCs were isolated from human bone marrow and plated on glass slides inside Petri dishes at a density of 20,000 cells in DMEM-LG supplemented with 10% fetal bovine serum (FBS). The samples were cultured for 72 h, then fixed in 1% neutral buffered formalin for 10 min at 4 °C. (ii) Osteo-differentiated MSCs. After 24 h the culture medium of MSCs was replaced with osteogenic medium consisting of DMEM-LG, 10% FBS, 10 mM β-glycerophosphate, 50 µg/mL ascorbic acid and 10−7 M hydrocortisone. Osteogenic medium was renewed twice a week for 14 days in order to initiate early mineral matrix deposition, namely, expression of mature osteoblast phenotype. (iii) Osteosarcoma cells. MG-63 (human osteosarcoma cell line ATCC® CRL-1427) cells were seeded on 6 slides at 10,000 cells in Eagle’s Minimum Essential Medium (EMEM) supplemented with 10% FBS and cultured for 72 h; thereafter the samples were formalin fixed, as in (i).
3.2. Chondogenic Tissues
All the tumor tissue samples were prepared in accordance with existing histopathological procedures, details of which can be found in [
5].
3.3. Raman Spectroscopy
Raman spectra were recorded with a Thermo Fisher Scientific DXR2xi Raman microscope with the following experimental parameters: laser wavelengths 532 nm and 785 nm; power laser of 5–10 mW; 400–3400 cm−1 full range grating; 10×, 50× and 100× objectives; 25 μm confocal pinhole; 5(FWHM) cm−1 spectral resolution. Integration time for acquiring a Raman spectrum was 1 s and 10 scans for any spectrum.
In order to identify the best experimental parameters, preliminary measurements were performed to optimize the signal-to-noise ratio, and minimize the sample fluorescence. The background-subtracted Raman spectra were normalized for the area under the curve for standardization of the Raman intensities. The samples did not undergo any kind of pre-treatment before Raman examination. In turn, to assess intra-sample variability, multiple measurements were carried out at different regions within the sample.
3.4. Statistical Methods
Multivariate analysis was performed making use of Classical Least Squares (CLS), Principal component analysis (PCA), and Linear Discriminate Analysis (LDA). In addition, Omnic 9.0 software for pre-processing and background removal, and an ad-hoc code written in Matlab® for managing spectral data and statistical data analysis were used.
4. Results
Conventional biochemical methods widely employed to evaluate the MSC-osteoblast or MSC pre-osteoblast-osteosarcoma differentiation, such as immunostaining or reverse transcription polymerase chain reaction, are time consuming and may require a quite large amount of cells, in special way for immunostaining. In addition, the significance of histological results is limited by inter-observer variability, in particular if the cells fall into intermediate range of maturity making a quantitative assessment difficult. On the contrary, RS is a label-free optical technology and recent investigations suggest that RS can be used as a clinical tool in cancer diagnosis to improve diagnostic accuracy.
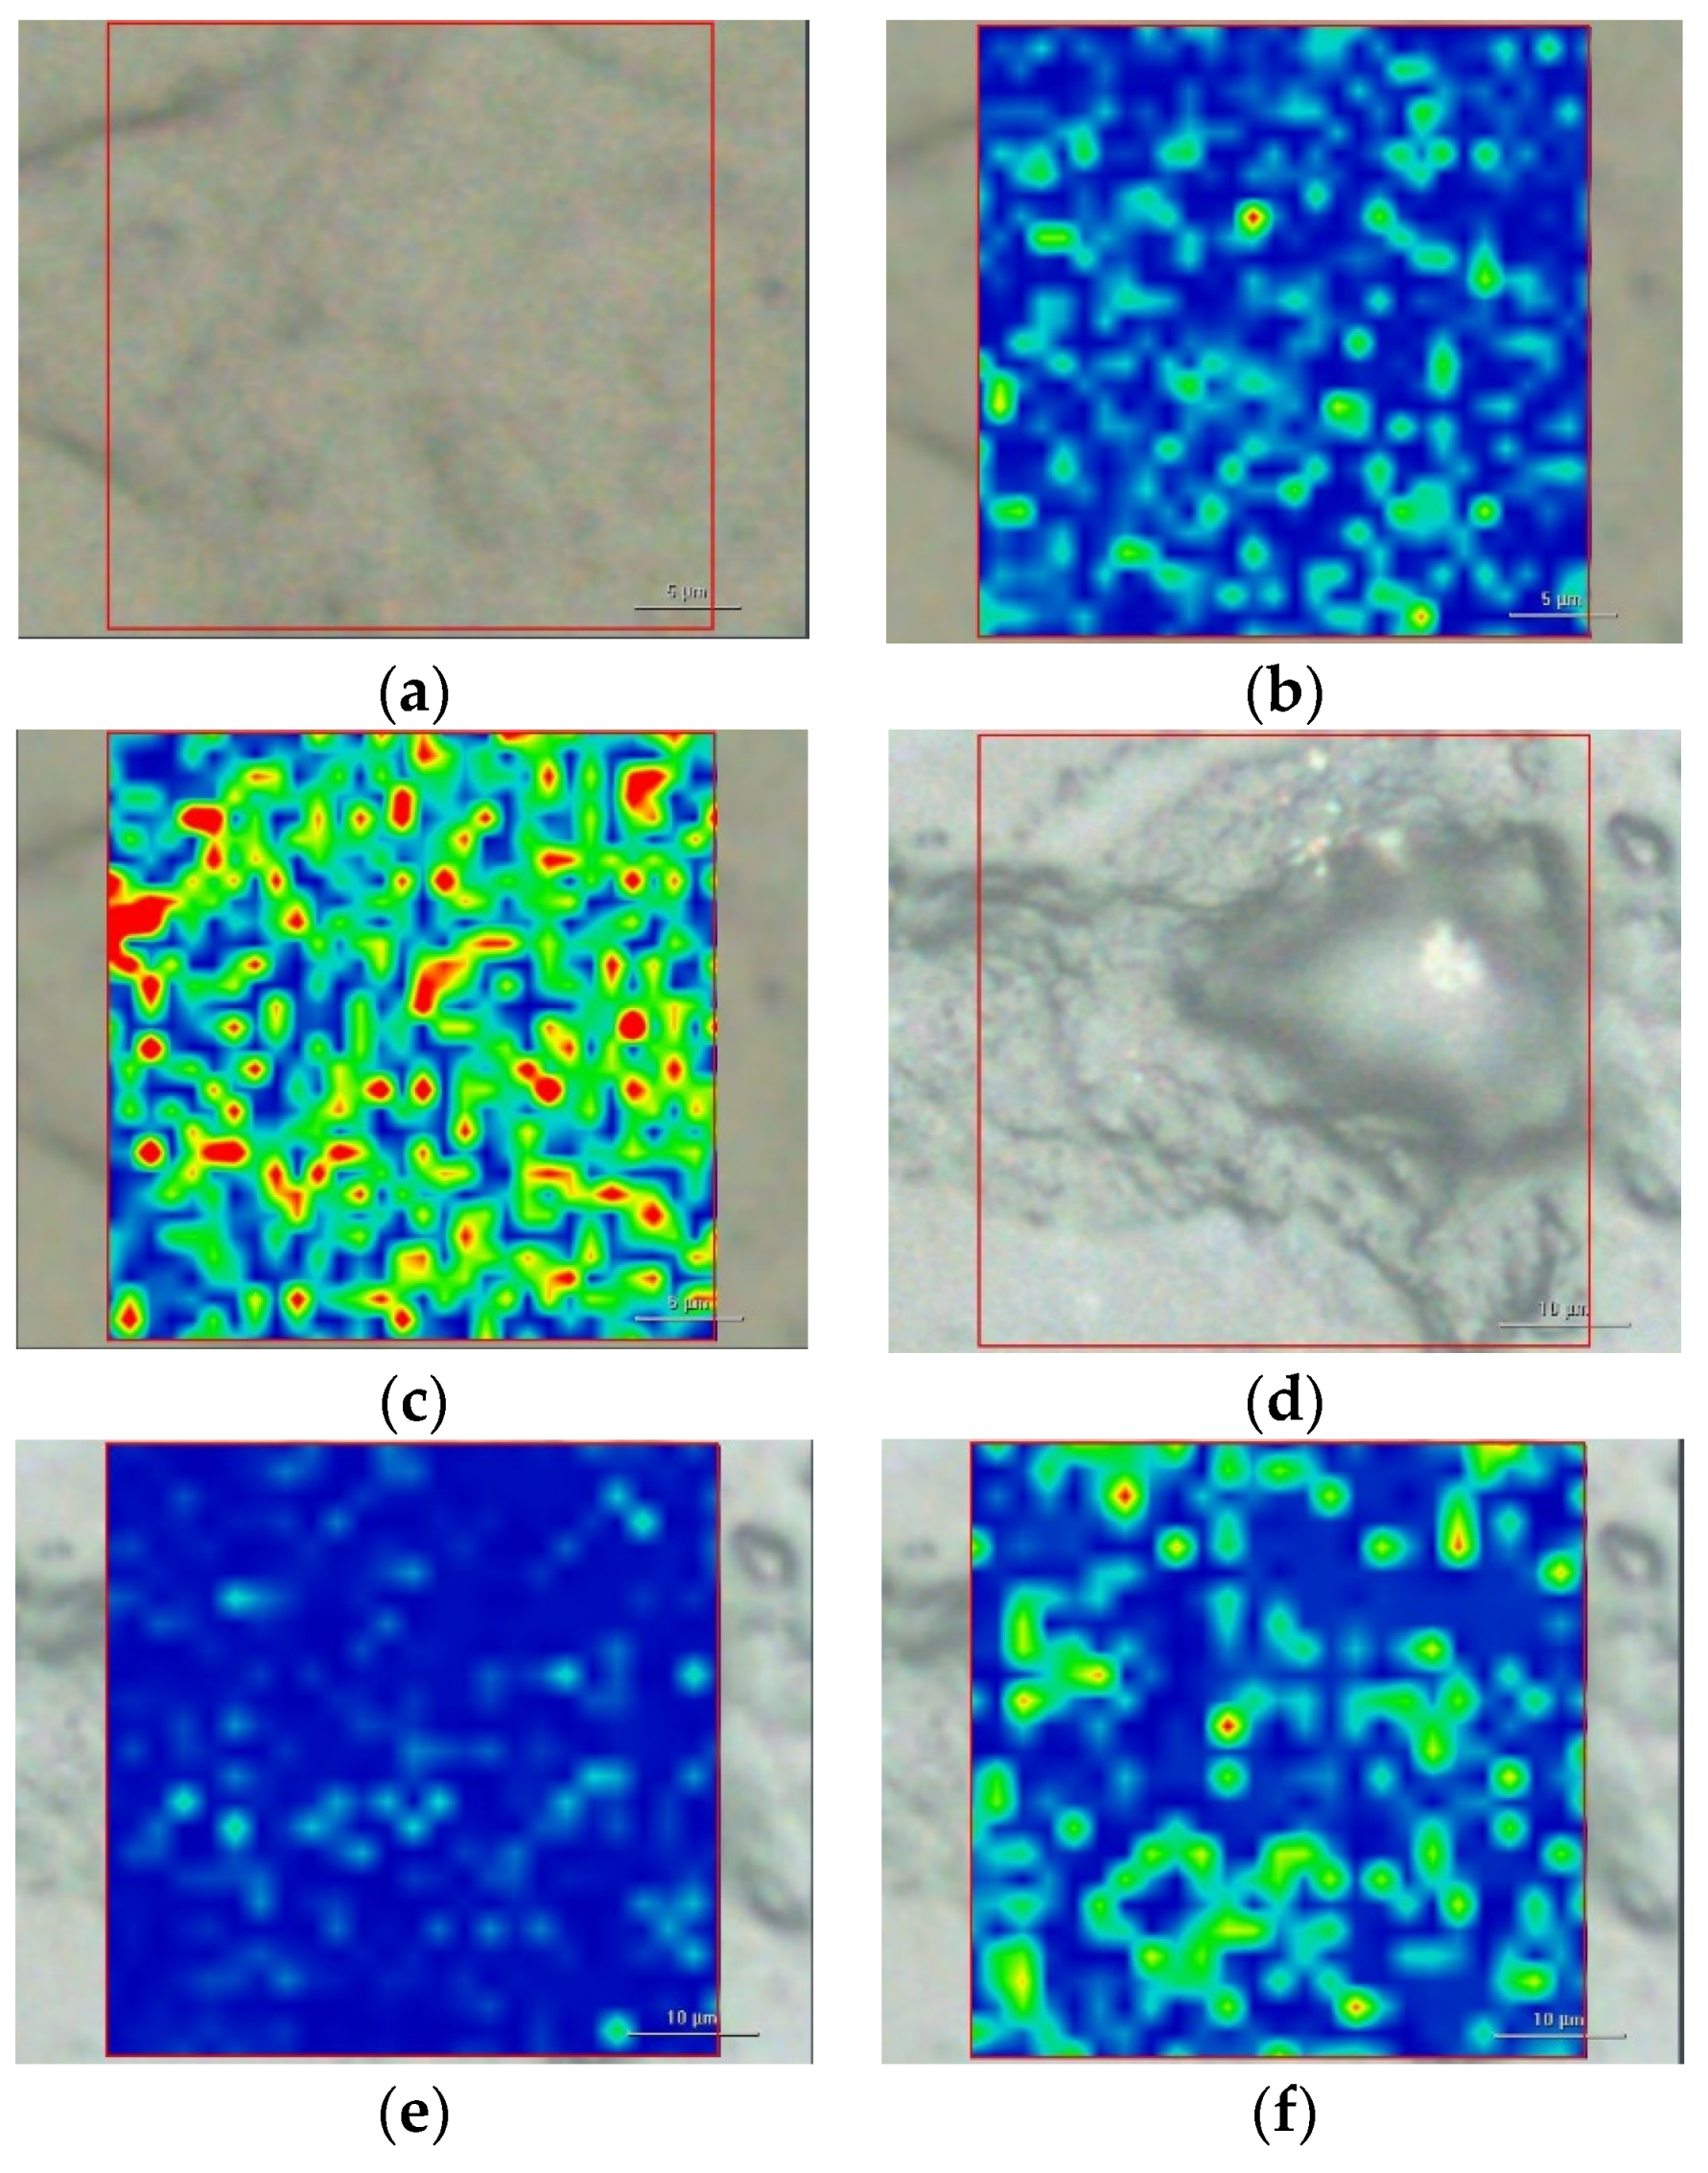
When applied to osteosarcoma cells, we used RS to the identification and discrimination of MG-63 cells from osteo-differentiated MCSs. The identification was focused on characteristic Cysteine (characteristic band at 668 cm
−1) and Hydroxyapatite (HA) (960 cm
−1) Raman peaks,
Figure 1. The results show unequivocally that the presence of these indicators are much greater in the MG-63 cells. The consequences of these results to improve the diagnostic tools are immediate. Raman imaging microscopy has shown high sensitivity, a direct and quantitative measurement of the mineralization level of cells.
In addition, combined with gold nanoshells (~120 nm core- + ~30 nm shell-diameter) and exploiting SERS effect, RS makes possible a local evaluation of osteosarcoma and osteo-differentiated MSCs cells through an amplified signal with a resolution lower than 1 μm.
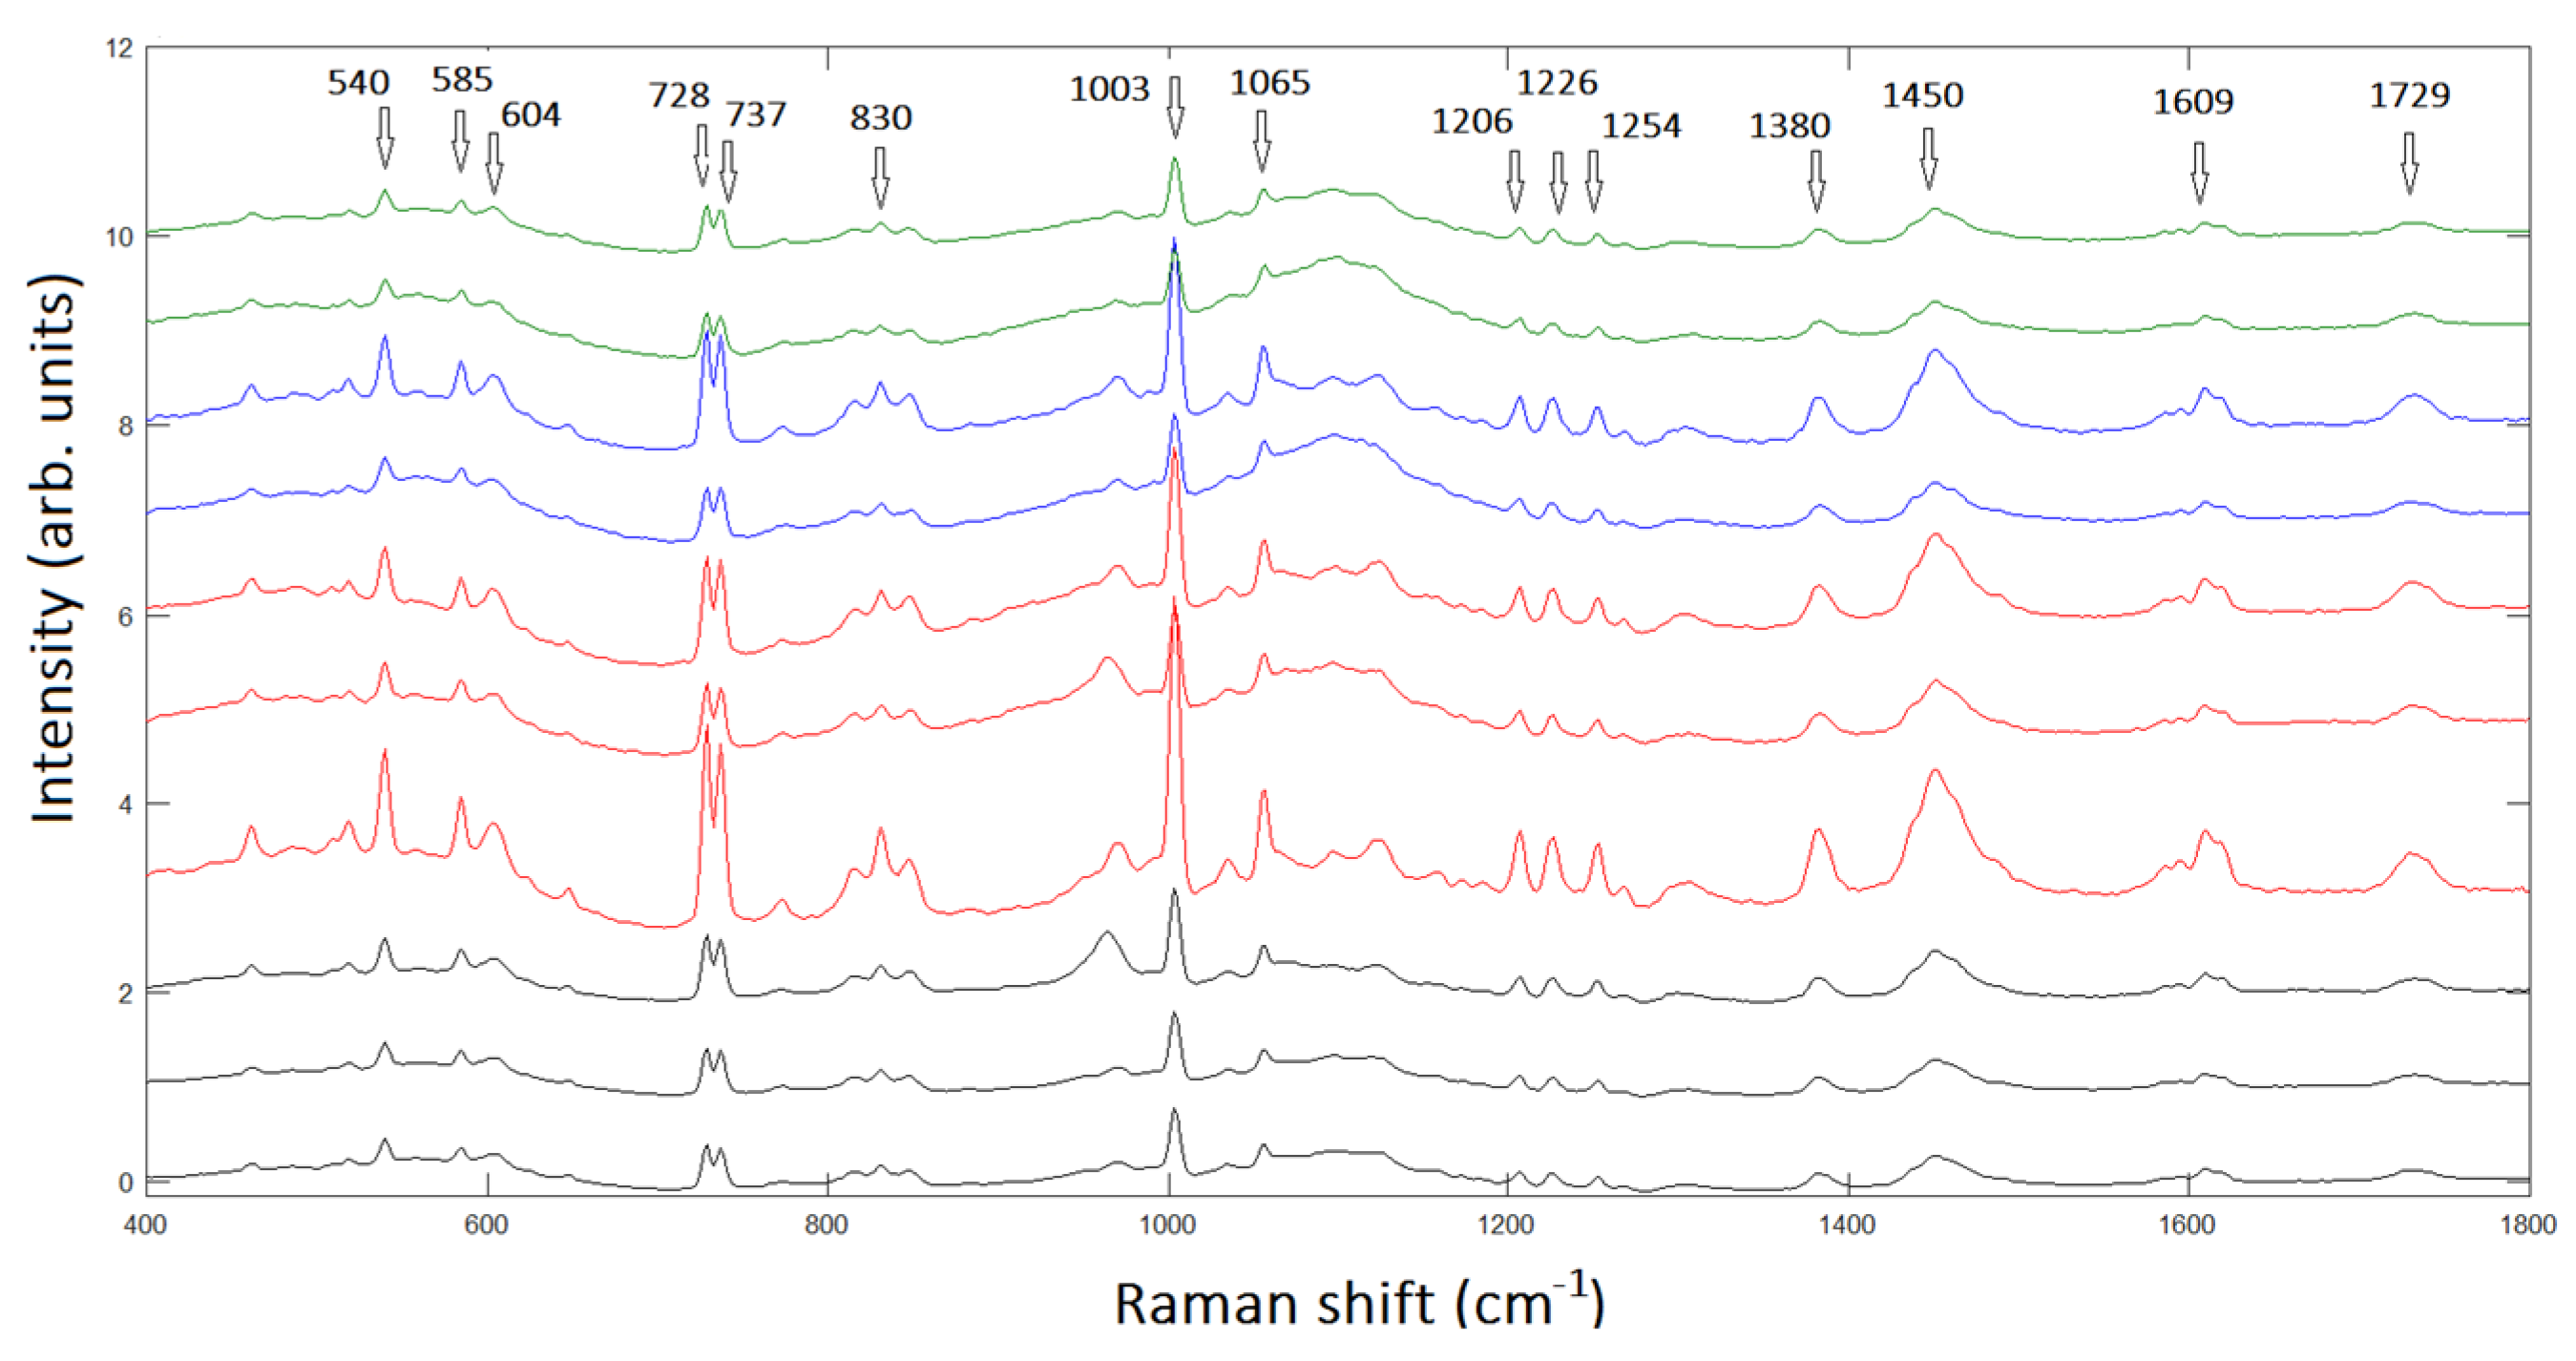
In turn, when applied to chondrogenic tumors, RS is able to deal out biochemical information on the progressive tumorgenisis of the different tumors tissues giving the possibility to grade the level of malignancy of the cartilaginous tumors supporting hystopatology analysis. In
Figure 2, we report the averaged Raman spectra of 10 patients with different levels of malignancy ranging from EC to CS G3. The progressive changes in the spectra correspondent to progressive malignancy of chondrosarcoma are evident.
In conclusion, an important consequence of this study is the possibility of satisfactorily using RS as a fundamental tool in the histopathological analysis of the tumors under examination. This is because, the method is highly cost-effective, being based solely on the analysis of unstained tissue sections. Our results are likely to give a significant advance in the imaging investigation of cartilaginous tissues leading to possible improvements of clinical applications in diagnostic accuracy and reducing inter-observer variability of chondrosarcoma tissues.
Author Contributions
M.D. conceived the study and performed Raman spectroscopy data acquisition and their statistical analysis treatment. B.B. and L.C. supported the experimental activity and discussed the results.
Funding
M.D. received external funding out within the framework of the BIO-ICT joint laboratory between the Institute of Biophysics and the Institute of Information Science and Technologies, both of the National Research Council of Italy, in Pisa.
Acknowledgments
M.D. is grateful to Thermo Fisher Scientific Company for DXR xi Raman system supplied during the measurement stage.
Conflicts of Interest
Authors declare no conflict of interest.
References
- COST Action BM 1401. Raman for Clinics. Available online: www.raman4clinics.eu (accessed on 17 September 2019).
- Kong, K.; Kendall, C.; Stone, N.; Notingher, I. Raman spectroscopy for medical diagnostics- from in-vitro biofluid assays to in-vivo cancer detection. Adv. Drug Deliv. Rev. 2015, 7, 2813–2824. [Google Scholar] [CrossRef] [PubMed]
- Auner, G.W.; Koya, S.K.; Huang, C.; Broadbent, B.; Trexler, M.; Auner, Z.; Elias, A.; Mehne, K.C.; Brusatori, M.A. Applications of Raman spectroscopy in cancer diagnosis. Cancer Metastasis Rev. 2018, 37, 691–717. [Google Scholar] [CrossRef] [PubMed]
- D’Acunto, M.; Trombi, L.; D’Alessandro, D.; Danti, S. Raman Spectroscopy of Osteosarcoma Cells. Phys. Biol. 2019, 16, 016007. [Google Scholar] [CrossRef] [PubMed]
- D’Acunto, M.; Gaeta, R.; Capanna, R.; Franchi, A. Contribution of Raman Spectroscopy to Diagnosis and Grading of Chondrogenic Tumors. Sci. Rep. under review. [CrossRef] [PubMed]
| Disclaimer/Publisher’s Note: The statements, opinions and data contained in all publications are solely those of the individual author(s) and contributor(s) and not of MDPI and/or the editor(s). MDPI and/or the editor(s) disclaim responsibility for any injury to people or property resulting from any ideas, methods, instructions or products referred to in the content. |
© 2019 by the authors. Licensee MDPI, Basel, Switzerland. This article is an open access article distributed under the terms and conditions of the Creative Commons Attribution (CC BY) license (https://creativecommons.org/licenses/by/4.0/).


