Proceeding Paper

Assessment of Vertical Accuracy for TanDEM-X 90 m DEMs in Plain, Moderate, and Rugged Terrain †

by
Ashutosh Bhardwaj
Indian Institute of Remote Sensing, Dehradun 248001, India
Presented at the 2nd International Electronic Conference on Geosciences, 8–15 June 2019; Available online: https://iecg2019.sciforum.net/.
Proceedings 2019, 24(1), 8; https://doi.org/10.3390/IECG2019-06208
Published: 5 June 2019
(This article belongs to the Proceedings of The 2nd International Electronic Conference on Geosciences)

Abstract

:
Synthetic Aperture Radar (SAR) interferometry technique generates digital elevation models (DEMs) and is used by various agencies widely. The recently released TanDEM-X DEM by DLR at 90 m spatial resolution is available for free download to users. This paper examines the accuracy of TanDEM-X DEM at different experimental sites with different topographic characteristics. Three sites were chosen, namely Kendrapara (Odisha), Jaipur (Rajasthan), and Dehradun (Uttarakhand) with plain, moderate, and highly undulating terrain conditions. The root mean square error (RMSE) were calculated using ground control points (GCPs) collected by differential GPS method for experimental sites at Dehradun, Jaipur, and Kendrapara. The accuracy of TanDEM-X 90 m datasets is compared with other openly accessible optically-derived DEMs (ASTER GDEM V2, CartoDEM V3 R1, AW3D30) and InSAR-derived DEMs (SRTM, ALOS PALSAR RTC HR). The RMSEs reveal that at Jaipur site with moderate terrain with urban and agriculture as major land use land cover (LULC) classes, the results of TanDEM-X 90 m DEM have higher accuracy than ALOS PALSAR RTC HR DEM. However, it is observed that in a predominantly plain region with agriculture practice (Kendrapara site, Odisha) and rugged region (Dehradun site, Uttarakhand) with mixed land use land cover (LULC) (e.g., forest, urban, streams, and agriculture) the results of ALOS PALSAR RTC HR data have higher accuracy than TanDEM-X 90 m DEM. Further, the study indicates that for a relatively plain site at Kendrapara (Orissa), CartoDEM V3 R1 DEM has the best performance with an RMSE of 1.96 m, which is the lowest among all DEMs utilized in the study.

1. Introduction

Digital elevation models are the primary input to terrain analysis or geomorphometry essential in various applications in hydrology, environment, and climatology. A large number of openly accessible DEMs are now available for utilization in various models, which makes it essential to analyze the quality of DEM with quantitative accuracy assessments for best results. TanDEM-X is the latest DEM released by DLR at 90 m spatial resolutions. To prepare a global DEM with high accuracy, TanDEM-X mission utilizes the highly accurate orbits and baseline determination, while exploiting the InSAR capabilities of the two twin SAR satellites TerraSAR-X and TanDEM-X [1]. The parameters governing the selection of InSAR data pairs include view angle (ascending and descending pass), spatial or geometrical baseline, temporal baseline, time of acquisition, meteorological conditions, and coherence [2,3]. TanDEM-X DEM had systematic height errors like offsets and tilts in the order of some meters, which requires DEM calibration [4].
Researchers have compared TanDEM-X DEM with DEMs available from airborne LiDAR, photogrammetry, SRTM, and ICESat elevation point data [5]. An extensive study used over 15,000 accurate GCPs from the Australian National Gravity Database (ANGD) to estimate the absolute accuracy of the TanDEM-X IDEM over Tasmania and it was found to have an RMS error of 6.6 m, which is superior to that of SRTM or ASTER [6]. Vertical standard deviation of 2.42 m was found for TanDEM-X (12 m) in southern Central Andean Plateau characterized by diverse topography and relief, lack of vegetation, and clear skies. that create ideal conditions for remote sensing [7]. TanDEM-X has been used for applications like extraction of digital building height models [8], archaeological sites [9], DEM fusion using ANN techniques [10] and DEM super-resolution [11]. AW3D30 was found to be the most promising while investigating the performances of seven public freely-accessed DEM datasets (ASTER GDEM V2, SRTM-3 V4.1 DEM, SRTM-1 DEM, AW3D30 DEM, VFP-DEM, MERIT DEM, Seamless SRTM-1 DEM) over the HMA region (Hengduan Mountains and Himalayas) by referring to high-accuracy elevation data from ICESat altimetry [12]. TanDEM-X was assessed in four regions revealing that it is accurate in flat to slightly undulating terrains, but overestimated in treacherous terrain [13].
The objective of the presented study was to examine the quality and suitability of recently released Tandem-X 90 m global DEM in different types of terrain conditions. Three locations with plain, moderate, and rugged topographic conditions were selected for experimentation. These experimental sites were previously surveyed and have been available for ongoing and potential future studies at Indian Institute of Remote Sensing (IIRS), Dehradun. The research design aims to answer the question of whether TanDEM-X 90 m DEM data products are useable under different types of topographic regions.

2. Materials and Methods

2.1. Study Area

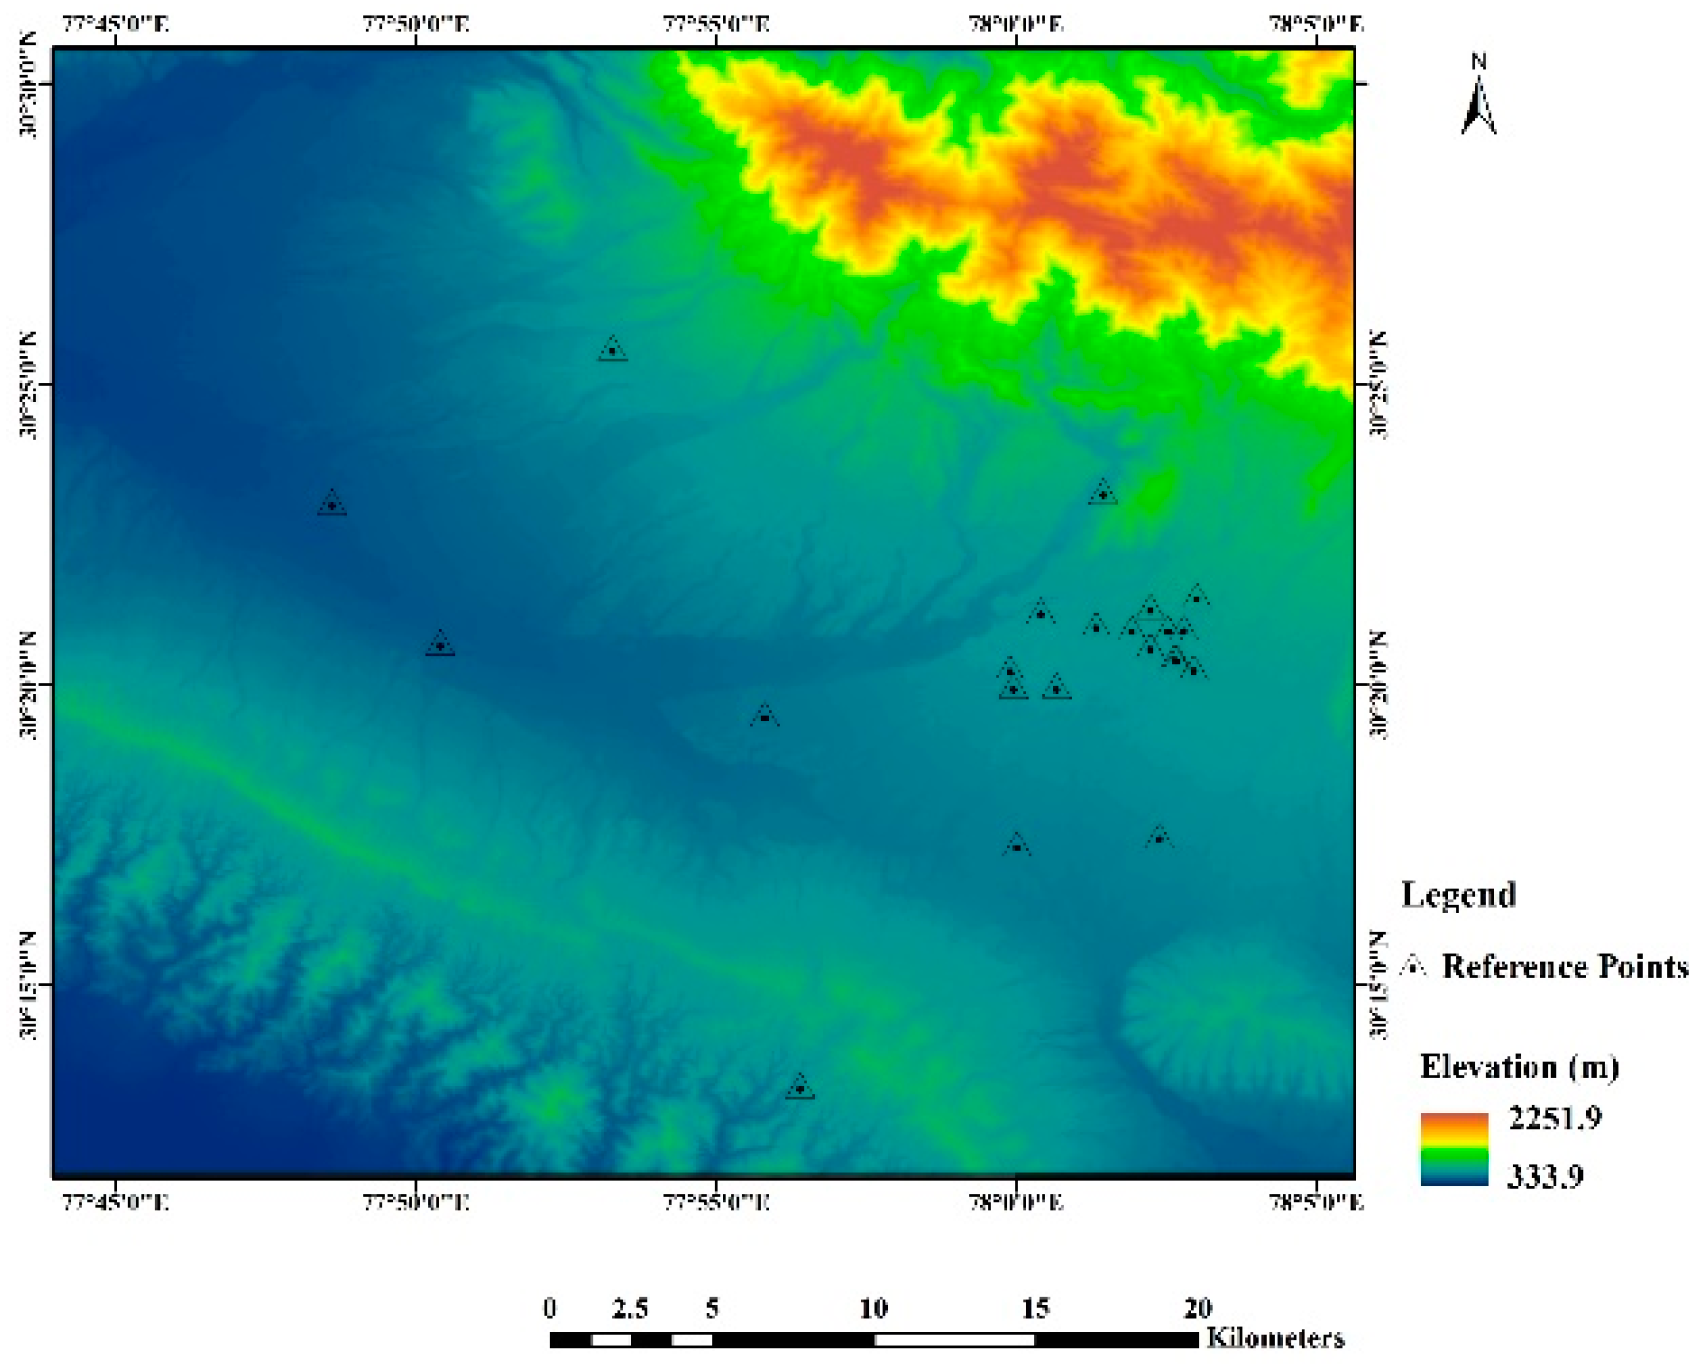
The three experimental sites selected for the study were chosen in three different terrains (Figure 1). The first study area includes Dehradun city and its surroundings with general elevation ranging from about 300 to 2250 m above MSL. Dehradun is the capital city of the Uttarakhand state, India and is located in the Doon valley. The open-source CartoDEM V3 R1 data utilized in the study lies between 30°11′36″ N to 30°26′32″ N latitude and 77°45′18″ E to 78° 05′46″ E longitude. The Dehradun site is characterized by highly rugged terrain comprising of Shivalik hills in the south and higher Himalayas on the north, the river Ganga in the east, and the river Yamuna in the west (Figure 2). The second experimental site includes Jaipur city and its surrounding regions. Jaipur is the capital city of Rajasthan state, India. The study area lies between 26°45′45″ N to 27°03′6″ N latitude and 75°43′9″ E to 76°2′37″ E longitude. The terrain ranges from the relatively flat urban area, extensive plain agriculture fields, a lake and hilly areas of Aravalli mountain range towards the NE side. The region has a semi-arid climate. The third site includes Kendrapara region lying between 20°19′10″ N to 20°38′17″ N latitude and 86°13′9″ E to 86°31′59″ E longitude. It is situated in the central coastal plain zone as per the agro-climatic classification of Odisha. The site predominantly consists of agricultural fields and has relatively plain terrain. The site is prone to yearly floods.

2.2. Materials and Methods

The TanDEM-X 90 m DEM datasets for the three experimental sites were downloaded from the website platform provided by DLR (https://tandemx-90m.dlr.de). The detailed specifications of TanDEM-X DEM products can be seen in the data guide provided by DLR. Major specifications (https://geoservice.dlr.de/web/dataguide/tdm90/#introduction) of TanDEM-X are given below in Table 1. The specifications of other openly accessible DEMs can be seen in the literature and websites of respective data providers.
The ground control points were used to calculate the absolute height error for the accuracy assessment of the DEMs. GCP numbers 22, 18, and 20 were used for analysis at Dehradun (Uttarakhand), Jaipur (Rajasthan), and Kendrapara (Odisha) sites, respectively. It is defined as the difference between the value of the respective height from the experimental DEM (Z(DEM), TanDEM-X 90 m here) product and the reference height (Z(DGPS)) measured in the field through DGPS survey. Accordingly, the absolute vertical accuracy expressed in terms of the root mean square error (RMSE) in height or elevation is given by the Equation (1) below.
R M S E = i = 1 n ( Z ( D G P S ) Z ( D E M ) ) 2 n
where n indicates the number of observations available for the validation.

3. Results

Ground control points (GCPs) collected through differential GPS (DGPS) survey technique are used for evaluation of DEMs at the experimental sites. The locations of GCPs are shown in Figure 1, Figure 2 and Figure 3, respectively, for the three sites at Dehradun (Uttarakhand), Jaipur (Rajasthan) and Kendrapara (Odisha). The RMSEs reveals that at Jaipur site with moderate terrain and with urban and agriculture as major LULC classes, the results of TanDEM-X 90 m DEM have higher accuracy than ALOS PALSAR RTC HR DEM. However, it is observed that in a predominantly plain region with agriculture practice (Kendrapara site) and rugged region (Dehradun site) with mixed LULC (e.g., forest, urban, streams, and agriculture) the results of ALOS PALSAR RTC HR data have higher accuracy than TanDEM-X (90 m) and other openly accessible DEMs. Further, the study indicates that for a relatively plain site at Kendrapara, Orissa, CartoDEM V3 R1 DEM has the best performance with an RMSE of 1.96 m (LE90 = 3.22 m), which is the lowest among all DEMs utilized in the study. Results reveal that in plain regions the CartoDEM V3 R1 has high accuracy and can be utilized directly in an application.
The RMSEs were calculated after the removal of outlier values and has shown improvement in the resulting accuracy. Linear error at 90 percentile (LE90, 90% confidence, LE90 = 1.6449* RMSE) is used extensively for accuracy assessments of DEMs [14,15]. The accuracy in the rugged terrain improved to 6.07 m (LE90 = 9.98 m) from 10.46 m (Figure 4) on blunder removal. Similarly, a marginal improvement in medium terrain 3.05 m (LE90 = 5.02 m) from 3.48 m is also observed. However, in plain terrain, the RMSE is 2.56 m (LE90 = 4.21 m) which is comparatively less accurate, as compared to CartoDEM V3 R1 data for the site.
Mean absolute errors (MAEs) for the experimental sites at Dehradun, Jaipur, and Kendrapara are 4.98, 3.02, and 1.83 m. RMSE and MAE both describe average model-performance errors, however RMSE gives more weight to larger errors, making MAE a more natural measure of average error [16]. Mean bias errors (MBEs) for the experimental sites at Dehradun, Jaipur and Kendrapara are 3.90, −0.92, and 2.04 m. The model bias for Jaipur site is the lowest, as the negative and positive biases cancel each other. It is observed that the slope, spatial resolution of DEMs, and elevated objects adjoining the GCP locations influence the accuracy.

4. Discussion

The variability in the quality of openly accessible DEMs suggests that these openly accessible DEMs should be utilized cautiously as per the application requirements. New techniques also demand correct selection of input DEMs, while executing DEM fusion or generation of super-resolution DEMs providing an opportunity to improve DEMs [10,11,17].

5. Conclusions

The study concluded that the TanDEM-X (90 m) DEM has high accuracy in plain region despite the resampling of the original TanDEM-X DEM (12 m). However, the accuracy degrades in the moderate and rugged terrain of Jaipur and Dehradun, respectively. The reduction in accuracy and quality in rugged terrain can be attributed to the increase in slope and high-frequency changes in the elevation values combined with the resampling of DEM from 12 to 90 m. Moreover, it is observed in the plain region with CartoDEM V3 R1 data has better performance than TanDEM-X.

Acknowledgments

Author would like to send the words of appreciation to ISRO, JAXA, NASA, and ESA for their insights and support through data sharing platforms, which is highly valuable in the presented study and helping the entire scientific fraternity at large.

Conflicts of Interest

The authors declare no conflict of interest.

Abbreviations

The following abbreviations are used in this manuscript:
DEMDigital elevation model
DGPSDifferential GPS
DLRDeutsche Zentrum für Luft- und Raumfahrt
GCPGround control points
InSARSAR interferometry
LE90Linear error at 90 percentile
MAEMean absolute error
MBEMean bias error
RMSERoot mean square error

References

  1. Rizzoli, P.; Martone, M.; Gonzalez, C.; Wecklich, C.; Tridon, D.B.; Bräutigam, B.; Bachmann, M.; Schulze, D.; Fritz, T.; Huber, M.; et al. Generation and performance assessment of the global TanDEM-X digital elevation model. ISPRS J. Photogramm. Remote Sens. 2017, 132, 119–139. [Google Scholar] [CrossRef]
  2. Rosen, P.A.; Hensley, S.; Joughin, I.R.; Li, F.K.; Madsen, S.N.; Rodriguez, E.; Goldstein, R.M. Synthetic aperture radar interferometry. Proc. IEEE 2000, 88, 333–382. [Google Scholar] [CrossRef]
  3. Massonnet, D.; Feigl, K.L. Radar interferometry and its application to changes in the Earth’s surface. Rev. Geophys. 1998, 36, 441–500. [Google Scholar] [CrossRef]
  4. Gruber, A.; Wessel, B.; Huber, M.; Roth, A. Operational TanDEM-X DEM calibration and first validation results. ISPRS J. Photogramm. Remote Sens. 2012, 73, 39–49. [Google Scholar] [CrossRef]
  5. Rao, Y.S.; Deo, R.; Nalini, J.; Pillai, A.M.; Muralikrishnan, S.; Dadhwal, V.K. Quality assessment of TanDEM-X DEMs using airborne LiDAR, photogrammetry and ICESat elevation data. In Proceedings of the ISPRS Technical Commission VIII Symposium, Hyderabad, India, 9–12 December 2014; pp. 187–192. [Google Scholar]
  6. Rexer, M.; Hirt, C. Evaluation of intermediate TanDEM-X digital elevation data products over Tasmania using other digital elevation models and accurate heights from the Australian National Gravity Database. Aust. J. Earth Sci. 2016, 63, 599–609. [Google Scholar] [CrossRef]
  7. Purinton, B.; Bookhagen, B. Validation of digital elevation models (DEMs) and comparison of geomorphic metrics on the southern Central Andean Plateau. Earth Surf. Dyn. 2017, 5, 211–237. [Google Scholar] [CrossRef]
  8. Misra, P.; Avtar, R.; Takeuchi, W.; Misra, P.; Avtar, R.; Takeuchi, W. Comparison of Digital Building Height Models Extracted from AW3D, TanDEM-X, ASTER, and SRTM Digital Surface Models over Yangon City. Remote Sens. 2018, 10, 2008. [Google Scholar] [CrossRef]
  9. Erasmi, S.; Rosenbauer, R.; Buchbach, R.; Busche, T.; Rutishauser, S. Evaluating the Quality and Accuracy of TanDEM-X Digital Elevation Models at Archaeological Sites in the Cilician Plain, Turkey. Remote Sens. 2014, 6, 9475–9493. [Google Scholar] [CrossRef]
  10. Bagheri, H.; Schmitt, M.; Zhu, X.X. Fusion of TanDEM-X and Cartosat-1 elevation data supported by neural network-predicted weight maps. ISPRS J. Photogramm. Remote Sens. 2018, 144, 285–297. [Google Scholar] [CrossRef]
  11. Xu, Z.; Chen, Z.; Yi, W.; Gui, Q.; Hou, W.; Ding, M. Deep gradient prior network for DEM super-resolution: Transfer learning from image to DEM. ISPRS J. Photogramm. Remote Sens. 2019, 150, 80–90. [Google Scholar] [CrossRef]
  12. Liu, K.; Song, C.; Ke, L.; Jiang, L.; Pan, Y.; Ma, R. Global open-access DEM performances in Earth’s most rugged region High Mountain Asia: A multi-level assessment. Geomorphology 2019, 338, 16–26. [Google Scholar] [CrossRef]
  13. Altunel, A.O. Evaluation of TanDEM-X 90 m Digital Elevation Model. Int. J. Remote Sens. 2019, 40, 2841–2854. [Google Scholar] [CrossRef]
  14. Gorokhovich, Y.; Voustianiouk, A. Accuracy assessment of the processed SRTM-based elevation data by CGIAR using field data from USA and Thailand and its relation to the terrain characteristics. Remote Sens. Environ. 2006, 104, 409–415. [Google Scholar] [CrossRef]
  15. Carabajal, C.C.; Harding, D.J. ICESat validation of SRTM C-band digital elevation models. Geophys. Res. Lett. 2005, 32, 1–5. [Google Scholar] [CrossRef]
  16. Willmott, C.J.; Matsuura, K. Advantages of the mean absolute error (MAE) over the root mean square error (RMSE) in assessing average model performance. Clim. Res. 2005, 30, 79–82. [Google Scholar] [CrossRef]
  17. Bhardwaj, A.; Chatterjee, R.S.; Jain, K. Assimilation of DEMs generated from optical stereo and InSAR pair through data fusion. Sci. Res. 2013, 1, 39–44. [Google Scholar] [CrossRef]
Figure 1. TanDEM-X (Dehradun site).
Proceedings 24 00008 g001
Figure 2. TanDEM-X (Kendrapara site).
Proceedings 24 00008 g002
Figure 3. TanDEM-X (Jaipur site).
Proceedings 24 00008 g003
Figure 4. Plot of RMSE I and RMSE II for TanDEM-X datasets at three experimental sites.
Proceedings 24 00008 g004
Table 1. Major Specifications of TanDEM-X datasets.
Specifications of TanDEM-XTanDEM-X
Acquisition techniqueRADAR
Data formatGeoTIFF
Vertical datumWGS84 ellipsoidal heights
Spatial resolution90 m
Projection systemGeographic
Absolute horizontal accuracy (CE90)below 10 m
Absolute vertical accuracy (LE90)below 10 m
Relative vertical accuracy for slopes at or below 20%2 m
Relative vertical accuracy for slopes above 20%4 m
Publisher’s Note: MDPI stays neutral with regard to jurisdictional claims in published maps and institutional affiliations.