Rice Monitoring Using Sentinel-1 Data in the Google Earth Engine Platform †


Abstract
:1. Introduction
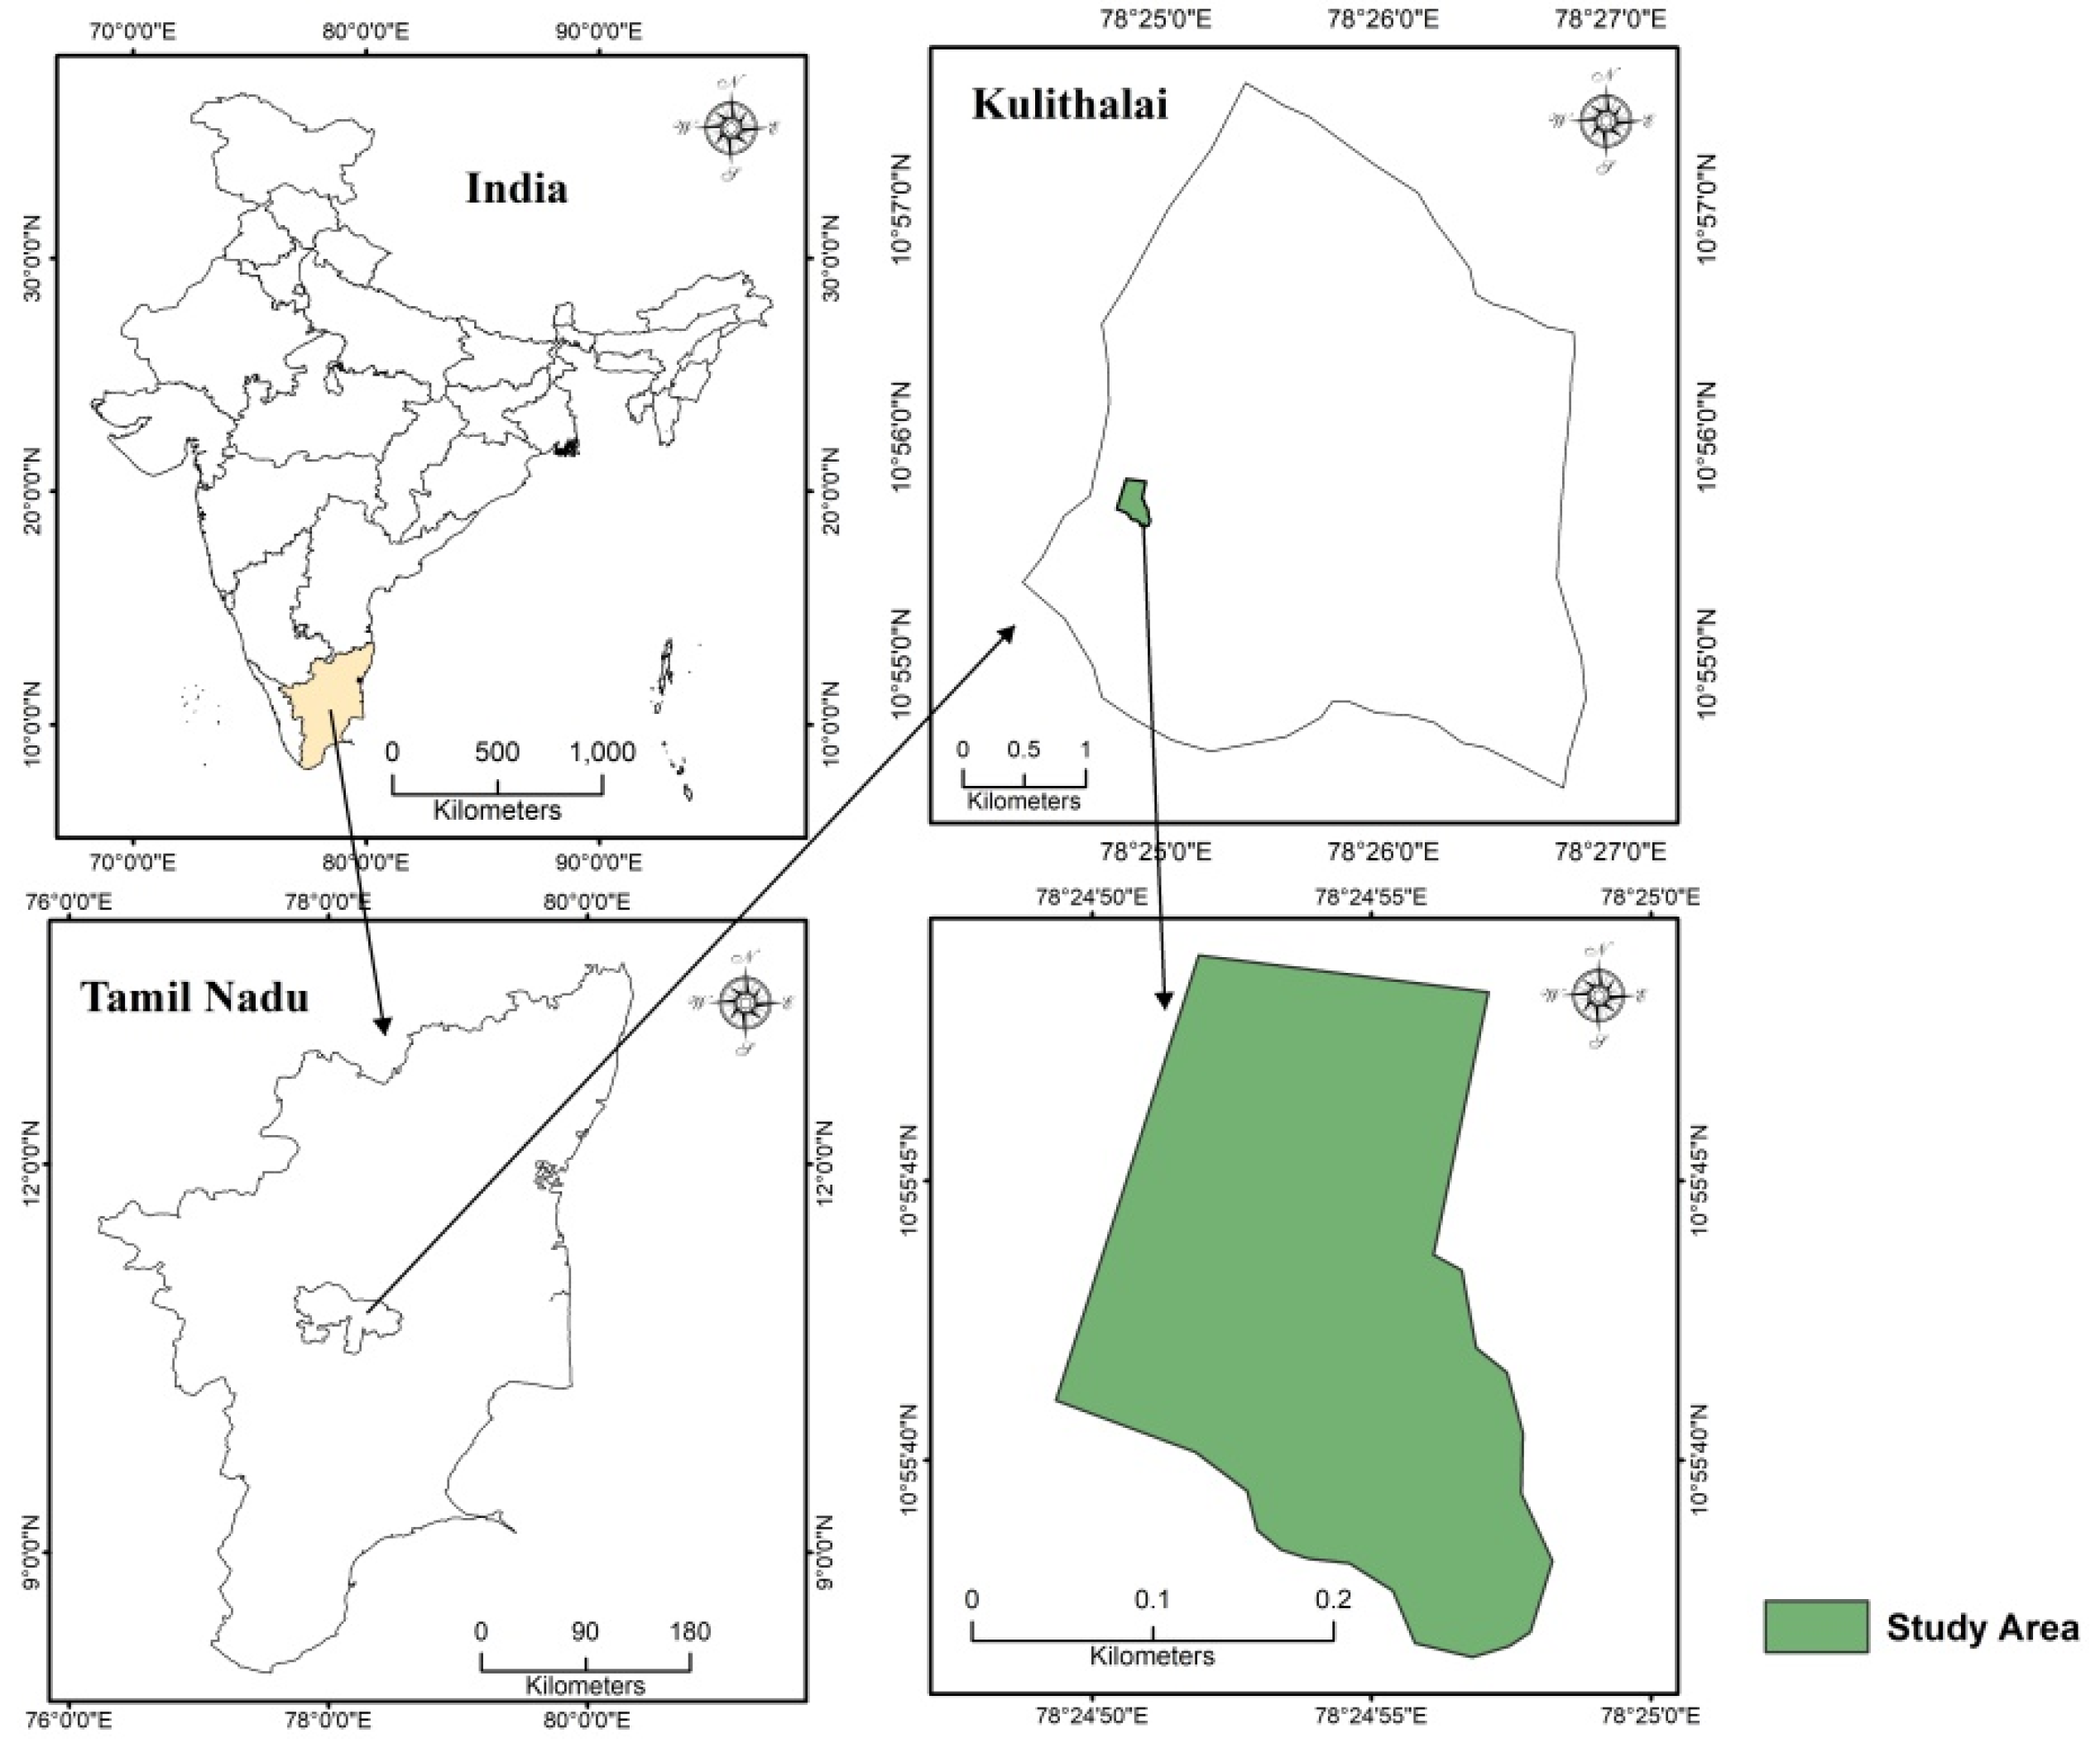
2. Study Area
3. Dataset
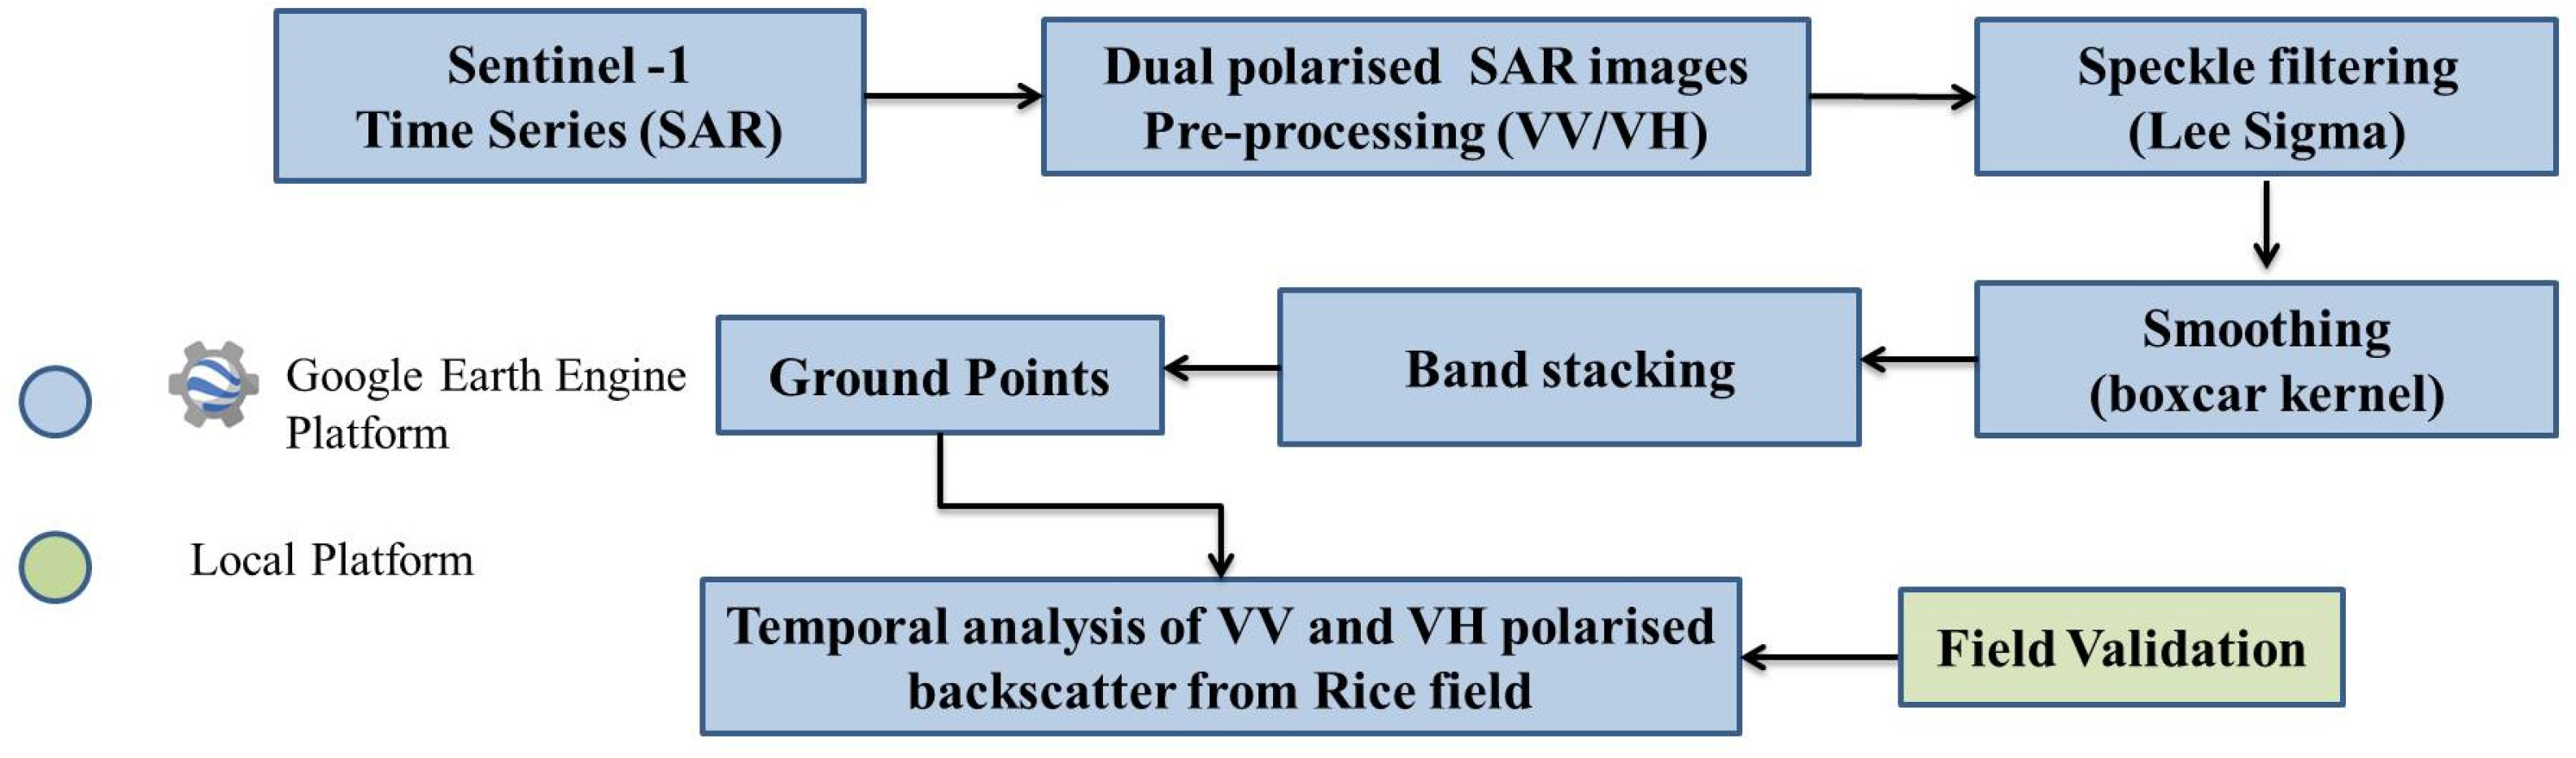
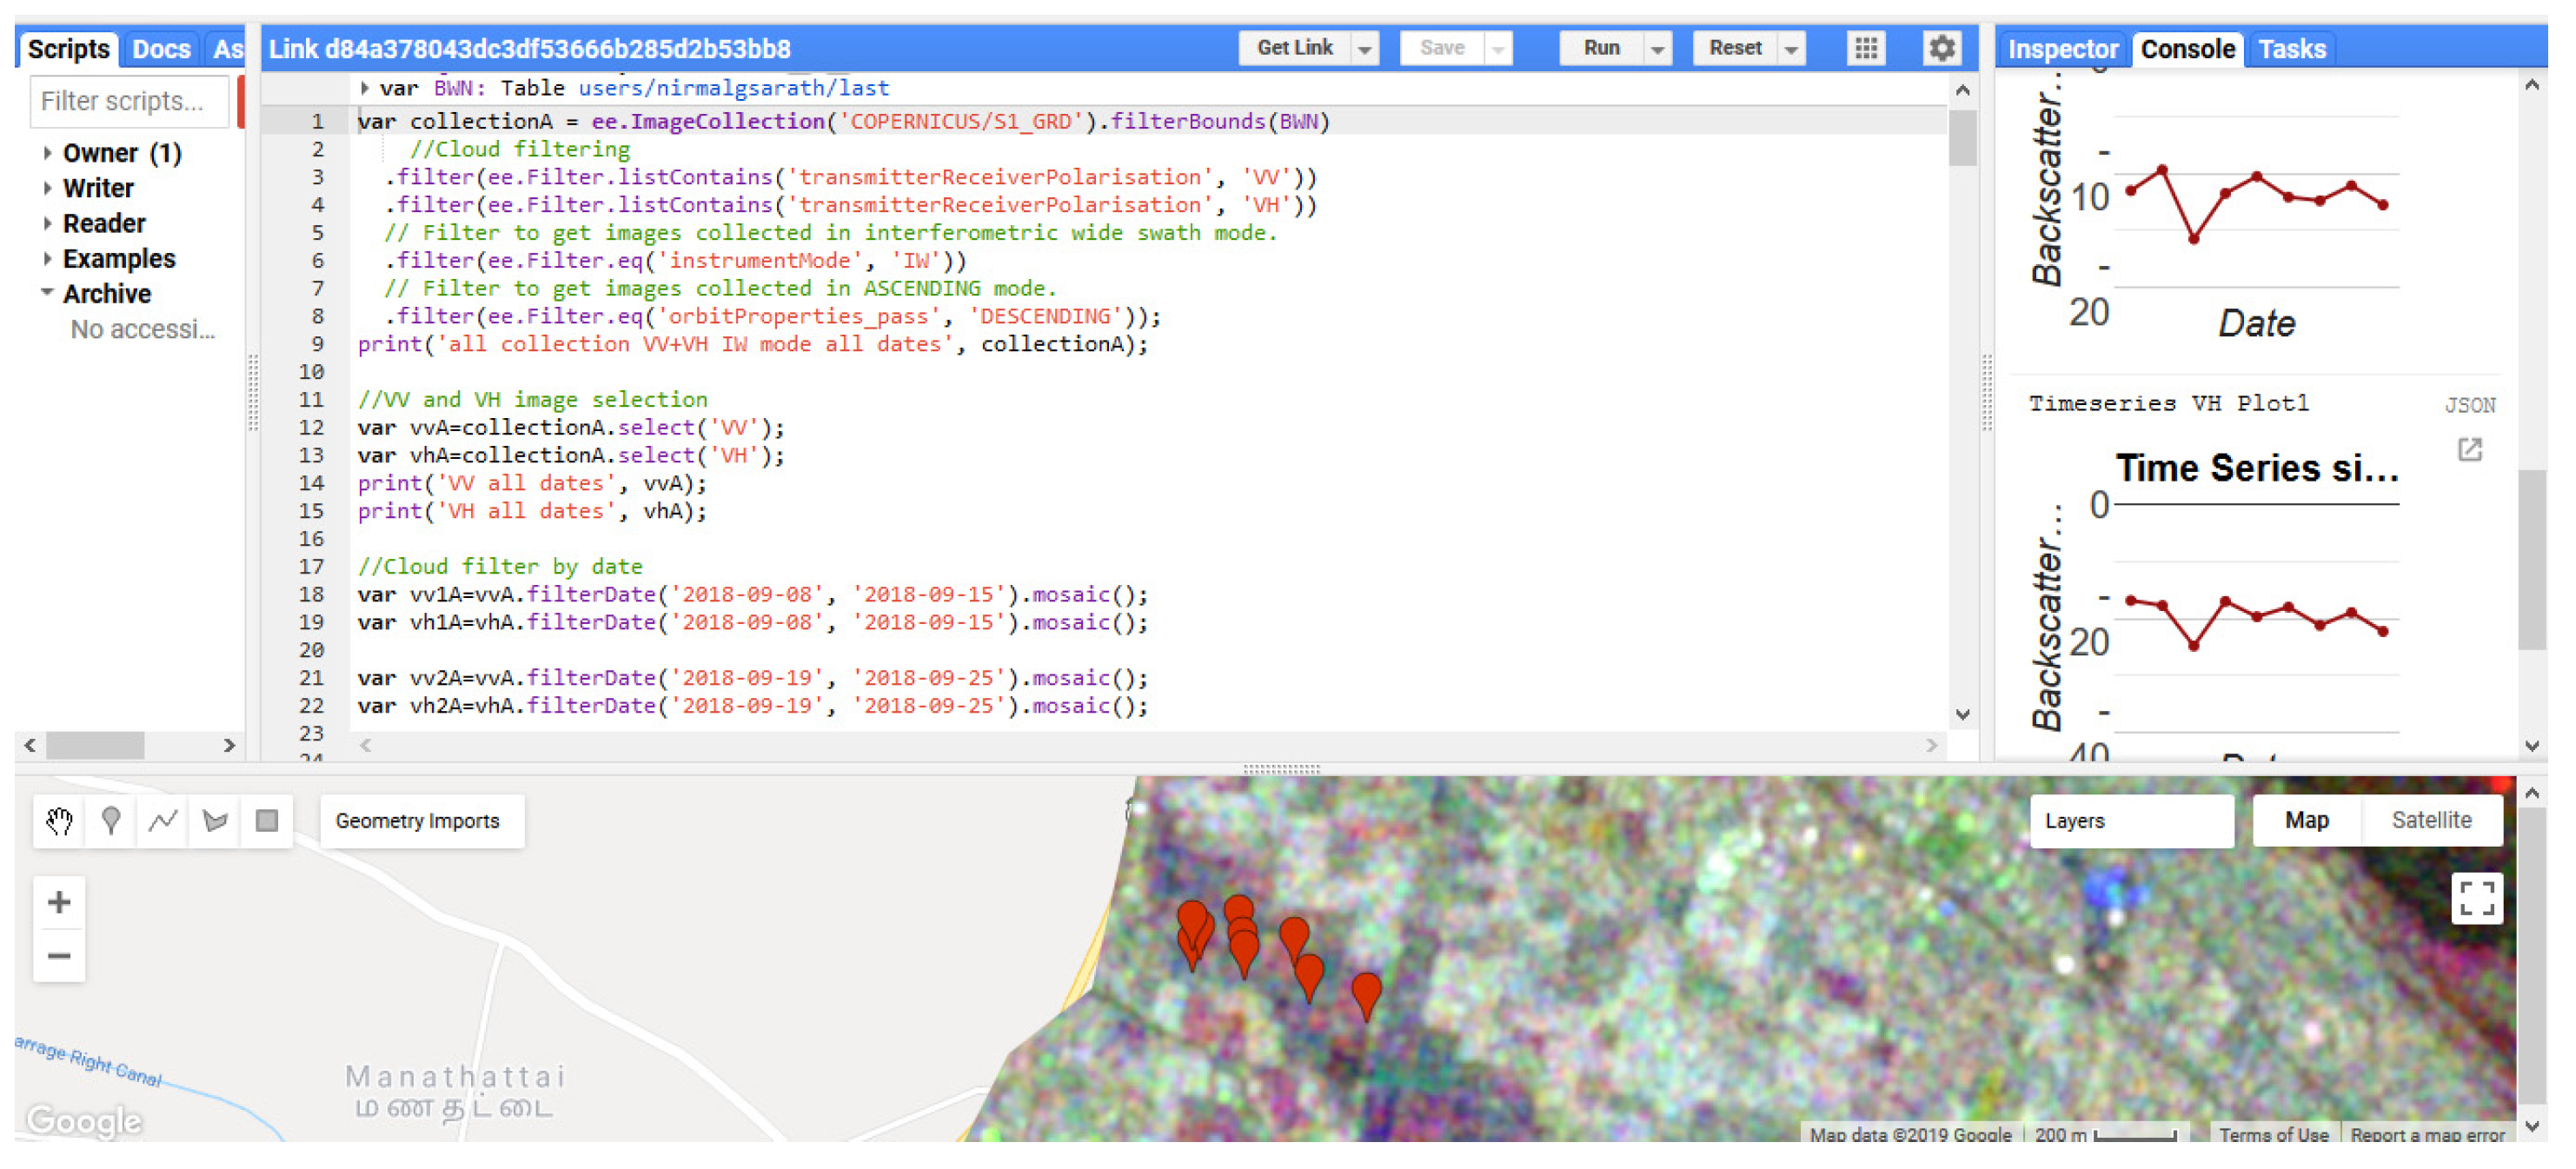
4. Methodology
5. Results and Discussion
6. Conclusions
Author Contributions
Funding
Conflicts of Interest
References
- Muthayya, S.; Sugimoto, J.D.; Montgomery, S.; Maberly, G.F. An overview of global rice production, supply, trade, and consumption. Ann. N. Y. Acad. Sci. 2014, 1324, 7–14. [Google Scholar] [CrossRef] [PubMed]
- Akinbile, C.O.; Abd El-Latif, K.M.; Abdullah, R.; Yusoff, M.S. Rice Production and Water use Efficiency for Self-Sufficiency in Malaysia: A Review. Trends Appl. Sci. Res. 2011, 6, 1127–1140. [Google Scholar] [CrossRef]
- Masutomi, Y.; Takahashi, K.; Harasawa, H.; Matsuoka, Y. Impact Assessment of Climate Change on Rice Production in Asia in Comprehensive Consideration of Process/Parameter Uncertainty in General Circulation Models. Agric. Ecosyst. Environ. 2009, 131, 281–291. [Google Scholar] [CrossRef]
- Nguyen, D.B.; Gruber, A.; Wagner, W. Mapping rice extent and cropping scheme in the Mekong Delta using Sentinel-1A data. Remote Sens. Lett. 2016, 7, 1209–1218. [Google Scholar] [CrossRef]
- Toan, T.L.; Ribbes, F.; Wang, L.F.; Floury, N.; Ding, K.H.; Kong, J.A.; Fujita, M.; Kurosu, T. Rice Crop Mapping and Monitoring Using ERS-1 Data Based on Experiment and Modeling Results. Ieee Trans. Geosci. Remote Sens. 1997, 35, 41–56. [Google Scholar] [CrossRef]
- Onojeghuo, A.O.; Blackburn, G.A.; Wang, Q.; Atkinson, P.M.; Kindred, D.; Miao, Y. Mapping paddy rice fields by applying machine learning algorithms to multi-temporal Sentinel-1A and Landsat data. Int. J. Remote Sens. 2018, 39, 1042–1067. [Google Scholar] [CrossRef]
- Kuenzer, C.; Knauer, K. Remote Sensing of Rice Crop Areas. Int. J. Remote Sens. 2013, 34, 2101–2139. [Google Scholar] [CrossRef]
- Mosleh, M.; Hassan, Q.; Chowdhury, E. Application of Remote Sensors in Mapping Rice Area and Forecasting Its Production: A Review. Sensors 2015, 15, 769–791. [Google Scholar] [CrossRef] [PubMed]
- Bazzi, H.; Baghdadi, N.; Hajj, M.E.; Zribi, M.; Minh, D.H.T.; Ndikumana, E.; Courault, D.; Belhouchette, H. Mapping Paddy Rice Using Sentinel-1 SAR Time Series in Camargue, France. Remote Sens. 2019, 11, 887. [Google Scholar] [CrossRef]
- Ndikumana, E.; Ho Tong Minh, D.; Baghdadi, N.; Courault, D.; Hossard, L. Deep Recurrent Neural Network for Agricultural Classification using multitemporal SAR Sentinel-1 for Camargue, France. Remote Sens. 2018, 10, 1217. [Google Scholar] [CrossRef]
- Gorelick, N.; Hancher, M.; Dixon, M.; Ilyushchenko, S.; Thau, D.; Moore, R. Google Earth Engine: Planetary-scale geospatial analysis for everyone. Remote Sens. Environ. 2017, 202, 18–27. [Google Scholar] [CrossRef]
- Sidhu, N.; Pebesma, E.; Camara, G. Using Google Earth Engine to detect land cover change: Singapore as a use case. Eur. J. Remote Sens. 2018, 51, 486–500. [Google Scholar] [CrossRef]
- Shelestov, A.; Lavreniuk, M.; Kussul, N.; Novikov, A.; Skakun, S. Exploring Google Earth Engine Platform for Big Data Processing: Classification of Multi-Temporal Satellite Imagery for Crop Mapping. Front. Earth Sci. 2017, 5, 17. [Google Scholar] [CrossRef]
- Singha, M.; Dong, J.; Zhang, G.; Xiao, X. High resolution paddy rice maps in cloud-prone Bangladesh and Northeast India using Sentinel-1 data. Sci. Data 2019, 6. [Google Scholar] [CrossRef] [PubMed]

© 2019 by the authors. Licensee MDPI, Basel, Switzerland. This article is an open access article distributed under the terms and conditions of the Creative Commons Attribution (CC BY) license (https://creativecommons.org/licenses/by/4.0/).
Share and Cite
Dineshkumar, C.; Kumar, J.S.; Nitheshnirmal, S. Rice Monitoring Using Sentinel-1 Data in the Google Earth Engine Platform. Proceedings 2019, 24, 4. https://doi.org/10.3390/IECG2019-06206
Dineshkumar C, Kumar JS, Nitheshnirmal S. Rice Monitoring Using Sentinel-1 Data in the Google Earth Engine Platform. Proceedings. 2019; 24(1):4. https://doi.org/10.3390/IECG2019-06206
Chicago/Turabian StyleDineshkumar, C., J. Satish Kumar, and S. Nitheshnirmal. 2019. "Rice Monitoring Using Sentinel-1 Data in the Google Earth Engine Platform" Proceedings 24, no. 1: 4. https://doi.org/10.3390/IECG2019-06206
APA StyleDineshkumar, C., Kumar, J. S., & Nitheshnirmal, S. (2019). Rice Monitoring Using Sentinel-1 Data in the Google Earth Engine Platform. Proceedings, 24(1), 4. https://doi.org/10.3390/IECG2019-06206