Proceeding Paper

Multifractal Characterization of Seismic Activity in the Provinces of Esmeraldas and Manabí, Ecuador †

by
David I. Cuenca
1,
Javier Estévez
2,* and
Amanda P. García-Marín
2
1
Global Change Master Area, University of Cordoba, 14071 Córdoba, Spain
2
Projects Engineering Area, University of Córdoba, 14071 Córdoba, Spain
*
Author to whom correspondence should be addressed.
Presented at the 2nd International Electronic Conference on Geosciences, 8–15 June 2019.
Proceedings 2019, 24(1), 27; https://doi.org/10.3390/IECG2019-06196
Published: 4 June 2019
(This article belongs to the Proceedings of The 2nd International Electronic Conference on Geosciences)

Abstract

:
Due to the enormous impact of seismic activity and the need to deepen knowledge of its behavior, this research work carries out an analysis of the multifractal nature of the magnitude, inter-distance and interevent time series of earthquakes that occurred in Ecuador during the years 2011–2017 in the provinces of Manabí and Esmeraldas, two areas with high seismic activity. For this study we use multifractal detrended fluctuation analysis (MF-DFA), which allows the detection of multifractality in a non-stationary series as well as in a series of parameters of non-linear characterization. The obtained results revealed that an interevent time series presents a higher degree of multifractality than the two previously mentioned. In addition, the Hurst exponent values were in a non-proportional function to (q), which is a weight value indicating the multifractal behavior of the dynamics of the earthquakes analyzed in this work. Finally, several multifractal parameters were calculated, and as a result all series were skewed to the right. This reveals that small variations in the analyzed series were more dominant than large fluctuations.

1. Introduction

Subduction is activated as a product of the interaction between continental and oceanic plates. This occurs when a low-density plate enters below the plate that produces the highest density in a subduction zone. As a result, the produced friction plane gives rise to earthquakes, volcanism and magmatism, causing failures and sutures [1].
For this reason, Ecuador is considered seismically active. During the past 110 years there have been earthquakes that have been studied for their magnitudes and origins, a clear example being the earthquake of Esmeraldas in 1906, whose magnitude was 8.8 on the Richter scale and which was one of the largest earthquakes in recorded history [2]. Earthquakes are natural catastrophes that cannot be accurately predicted or avoided at present. Thus, this work focuses on previous data that serve as a basis for a map of susceptibility, and a demonstration of seismic scenarios, all of which depends on land, geographical location, load on the ground, and so on. [3].
Compaction, subsidence, liquefaction, landslides, settlements, cracks, balance, faults, cracks, and so on are some of the effects of an earthquake that are related to shaking or vibrations [4]. All of these damages can be estimated using probabilistic methods to reduce their damage by reinforcing structures in common seismic zones or implementing safe zones for the people affected.
This research work focuses on a characterization of the seismic hazards of the areas indicated above, determining the sizes of forces and the sets of the actions that could affect soil in specific places during future earthquakes. Because earthquakes affect the constructions, which implies potential damages or collateral effects, a very important factor to take into account is seismic risk, which is the estimate of expected damages or losses.

2. Art State: Fractals

The concept of a “fractal” was introduced by Mandelbrot in 1975, and it refers to the geometry of a basic structure that is fragmented and repeated at different self-similar scales. Due to its irregular nature, a fractal cannot be described in traditional geometrical terms. Taking this initial definition into account and using the theoretical development of fractality, we can analyze many manifestations that present the characteristics of chaos and order at the same time. Fractals present a set of new rules to know and describe nature [5]. There are two types of fractals, the “ideal”, which is a geometrical figure that mathematicians create by means of an iterative algorithm or repetitive rule with a shape (irregular, interrupted or fragmented) that remains the same at any scale at which the observation occurs, fulfilling the property of exact self-similarity [6]. In addition to the “ideal” fractals, there are also “natural” fractals, which are an element of nature that can be described through fractal geometry [7]. Earthquakes, mountains, the circulatory system, coastal lines or snowflakes are natural fractals. This representation is approximate, because the properties attributed to ideal fractal objects, such as infinite detail, have limits in the physical world.
With the development of computers, it has been possible to produce fractal graphics that require highly complex calculations. Thus, mathematicians and artists have found a new means of research and expression.

3. Data Source

Data collection is the first step in performing Multifractal Detrended Fluctuations Analysis (MF-DFA). All data were provided by the Military Geographic Institute of Ecuador [8] after requesting the information [9]. The two provinces used in this work (Esmeraldas and Manabí) were selected due to their high seismic activity [10].
From a total of 2190 earthquakes (Figure 1) produced between 2011 and 2017, 1020 were used in this work, according to their coordinates and importance [11].
The variables provided by the Military Geographic Institute of Ecuador were: Date and hour, Deep, Duration time, Coordinates and Magnitude.
The interevent series is determined by comparing the exact times of each earthquake occurrence (that is, it is the time difference between each earthquake). In order to obtain the inter-distance series, a similar analysis is carried out, determining the coordinates at which each earthquake occurs, from which a distance difference is calculated. Subsequently, each of the series is divided into sets (q) that takes positive and negative values, in this case 5 and −5.
For an appropriate characterization of the selected provinces, multifractal analysis has been carried out using rescaled range analysis, which is defined below along with other concepts.

4. Methodology

Multifractal Detrended Fluctuation Analysis (MF-DFA)

This method is described in detail by [12] and is a general procedure consisting of five steps. At the beginning we assume a series xk with a length = N, which is a set of k indexes with xk non-zero values. The series is compact if the values xk = 0; that is, it is a negligible fraction compared to the total length of the series. For the null components of the series, values are not assigned to the index k.
Step 1: The next profile to be analyzed is determined using Equation (1).
Y i k = 1 i x k x , i = 1 , , N .
where <x> represents the arithmetic mean:
x = 1 N k = 1 N x ( k )
The subtraction of the mean <x> is not mandatory since it will be eliminated later using Equation (2).
Step 2: The obtained profile using Equation (1) is divided into N s i n t ( N s ) segments that are not overlapping with length s. Because the length N of the series is not always a multiple of s, the same procedure is repeated from the opposite side of the series in order not to neglect the remaining interval of the end. Thus, an amount of 2 N s segments are obtained.
Step 3: By adjusting the least squares, the local trend of each of the segments is determined for each of 2 N s segments. Subsequently, the covariance is calculated using Equation (2)
F 2 v , s 1 s i = 1 s Y v 1 s + i y v ( i ) 2
for each of the segments v , v =1,…, N s and also for v = N s + 1 , , 2 N s . The y v ( i ) value is a polynomial fit for the segment v -th. Depending on the order of polynomial adjustment (you can use linear, quadratic, cubic or higher-order polynomials in the fitting procedure), the order m of the detrended fluctuation analysis (DFA) is defined (DFA1, DFA2, . . . ), respectively.
F 2 v , s 1 s i = 1 s Y N ( v 1 s + i y v ( i ) 2
Step 4: To obtain the function of the q-th order fluctuation, the average of all the segments is determined using Equation (5).
F q ( s ) 1 2 N s v = 1 2 N s F 2 ( v , s ) q 2 1 q
where (q) can take any real value except zero. For different values such as q = 2, the scalar exponent h(2) provides information on the fluctuations of the data series. By repeating the process described above, the s time scales vary if the function F q ( s ) increases as s increases. It should also be noted that F q ( s ) depends on the order m in the DFA, which is defined as s ≥ m+2.
Step 5: Through the graphical representation in the logarithmic scale of F q ( s ) vs. s, the scalar behavior of the fluctuation function is determined for each value of q. The function F q ( s ) increases for large values of s when the x i series presents a long-range correlation. This as a power law, represented by Equation (6).
F q s ~ s h ( q )
In order to quantify the multifractal character in a time series, the multifractal spectrum ƒ( α ) is used as a relationship between the generalized exponent of Hurst H(q) and the classical exponent τ (q) [13], which is a scalar exponent of Renyi. When it depends linearly on q, the set is monofractal, otherwise the set is multifractal. To calculate this exponent, Equation (7) is used:
τ q = q H q 1
By the Legendre transformation, you get
α = τ ( q ) ƒ α = q α τ ( q )
where α is the Hölder exponent, and ƒ α determines the dimension of the subsets of the series, which depend on α (this is the same as the exponent that measures the strength of the multifractal structure) [11]. Broadly speaking, a small value of α indicates the process of a fine structure being lost, and its appearance becomes more regular; however, if the value is large, a complex structure is ensured. In that aspect, it is possible to use the Hurst exponent as α in Equation (9).
α = H q + q H ( q )   y ƒ α = q α H ( q ) + 1
Next, a polynomial fit of the second order is calculated around the position of α max or α 0 (Equation (10)).
ƒ α = A ( α α 0 ) 2 + B α α 0 + C
where C is a constant equal to 1, and the coefficient B refers to the asymmetry of the multifractal spectrum, being either zero or equal to zero for a symmetrical spectrum. When it is higher than zero, the multifractal structure is quite solid; on the other hand, when it is lower than zero, the multifractal structure is more regular and smoother, indicating fewer fractal exponents.

5. Results and Discussion

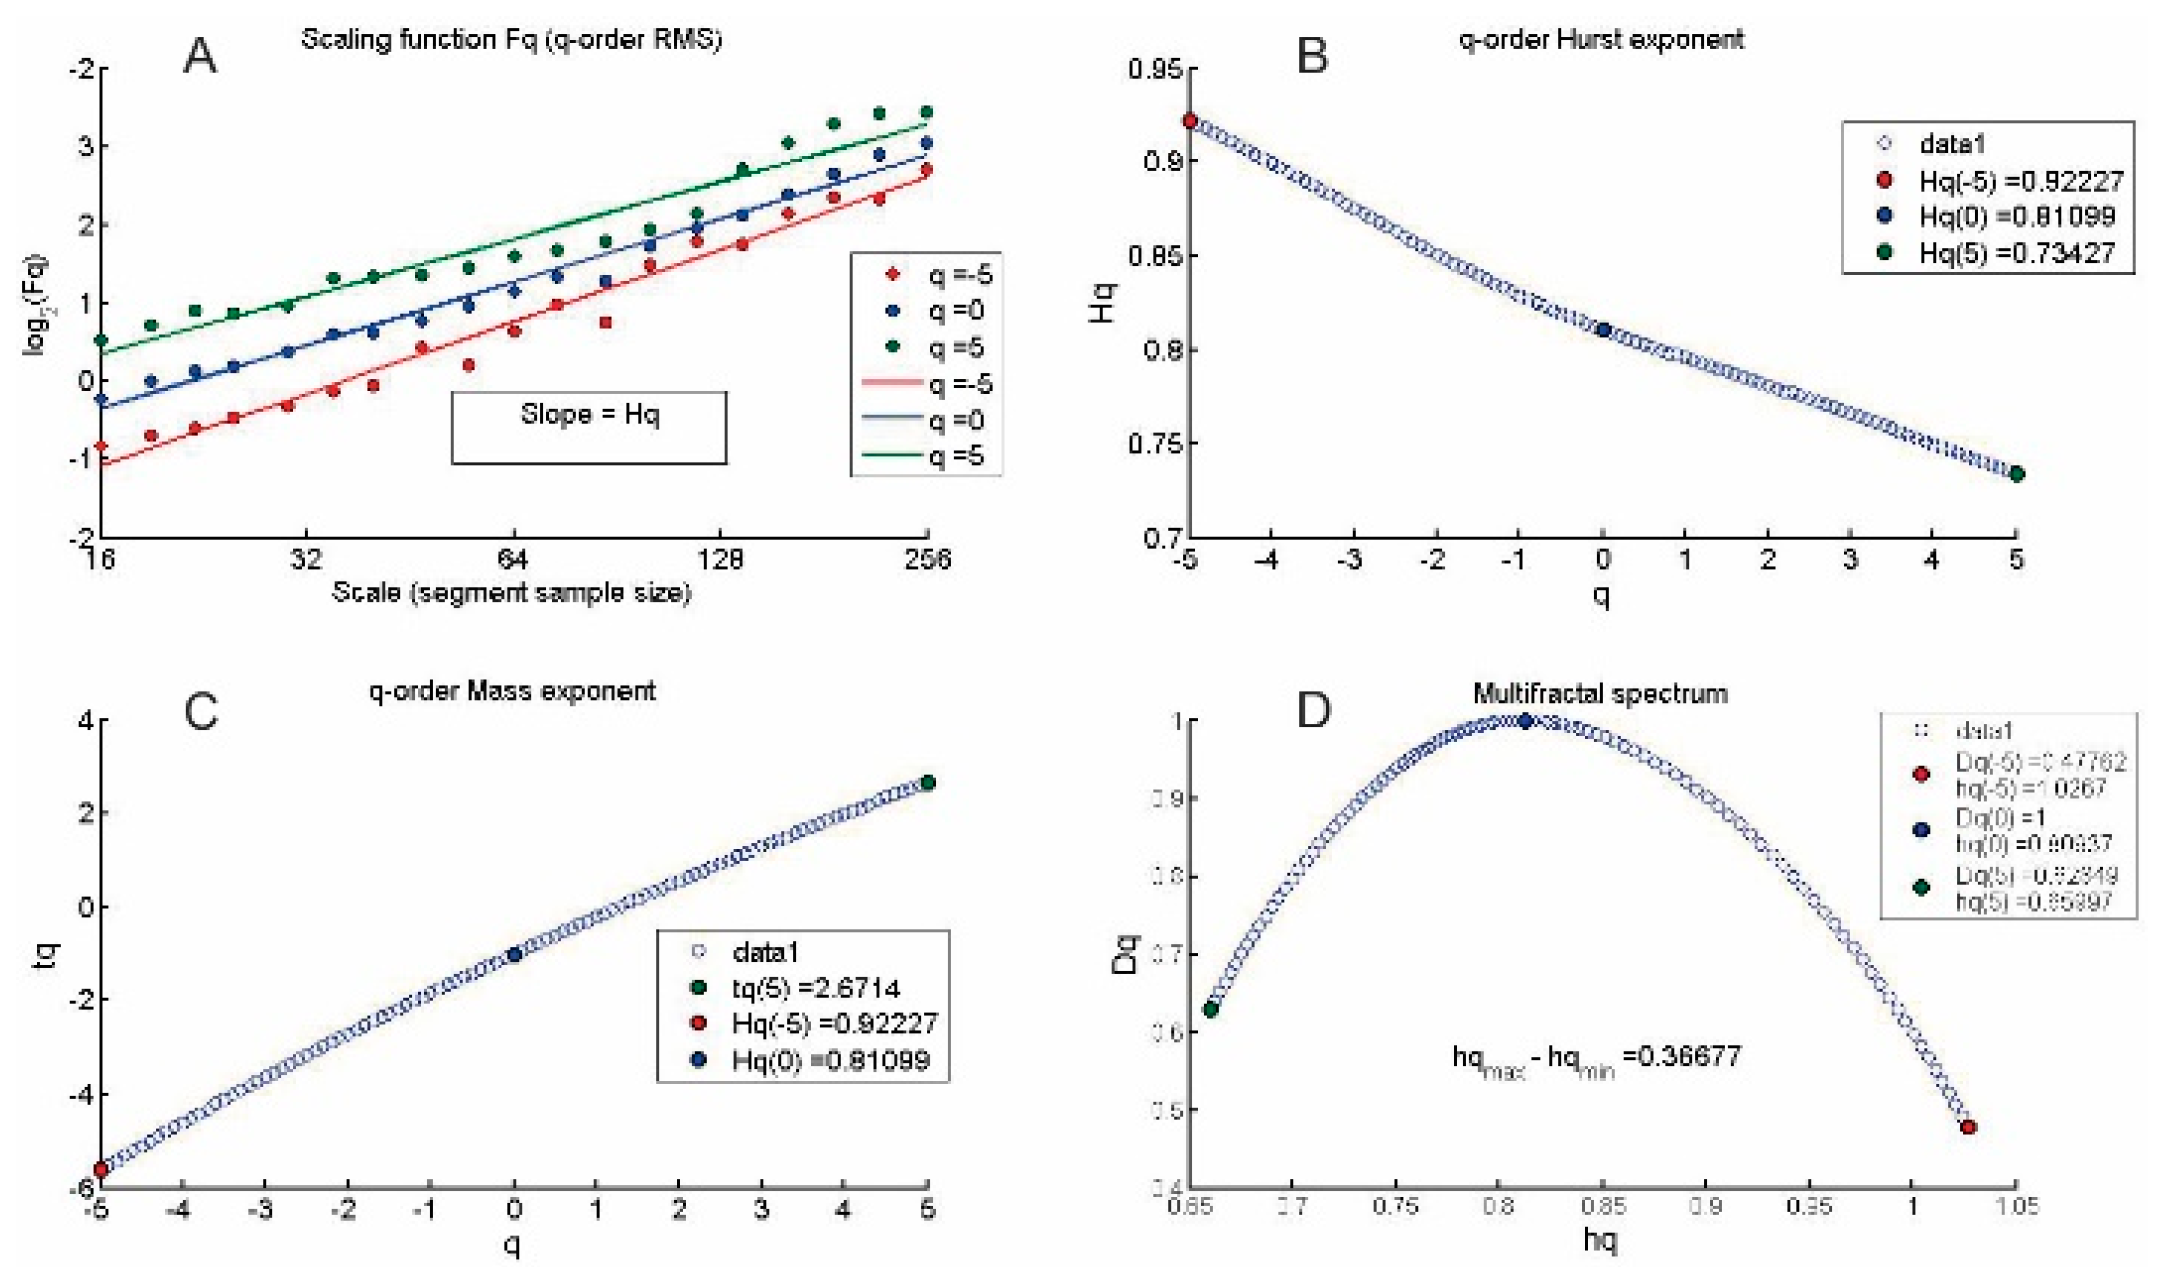
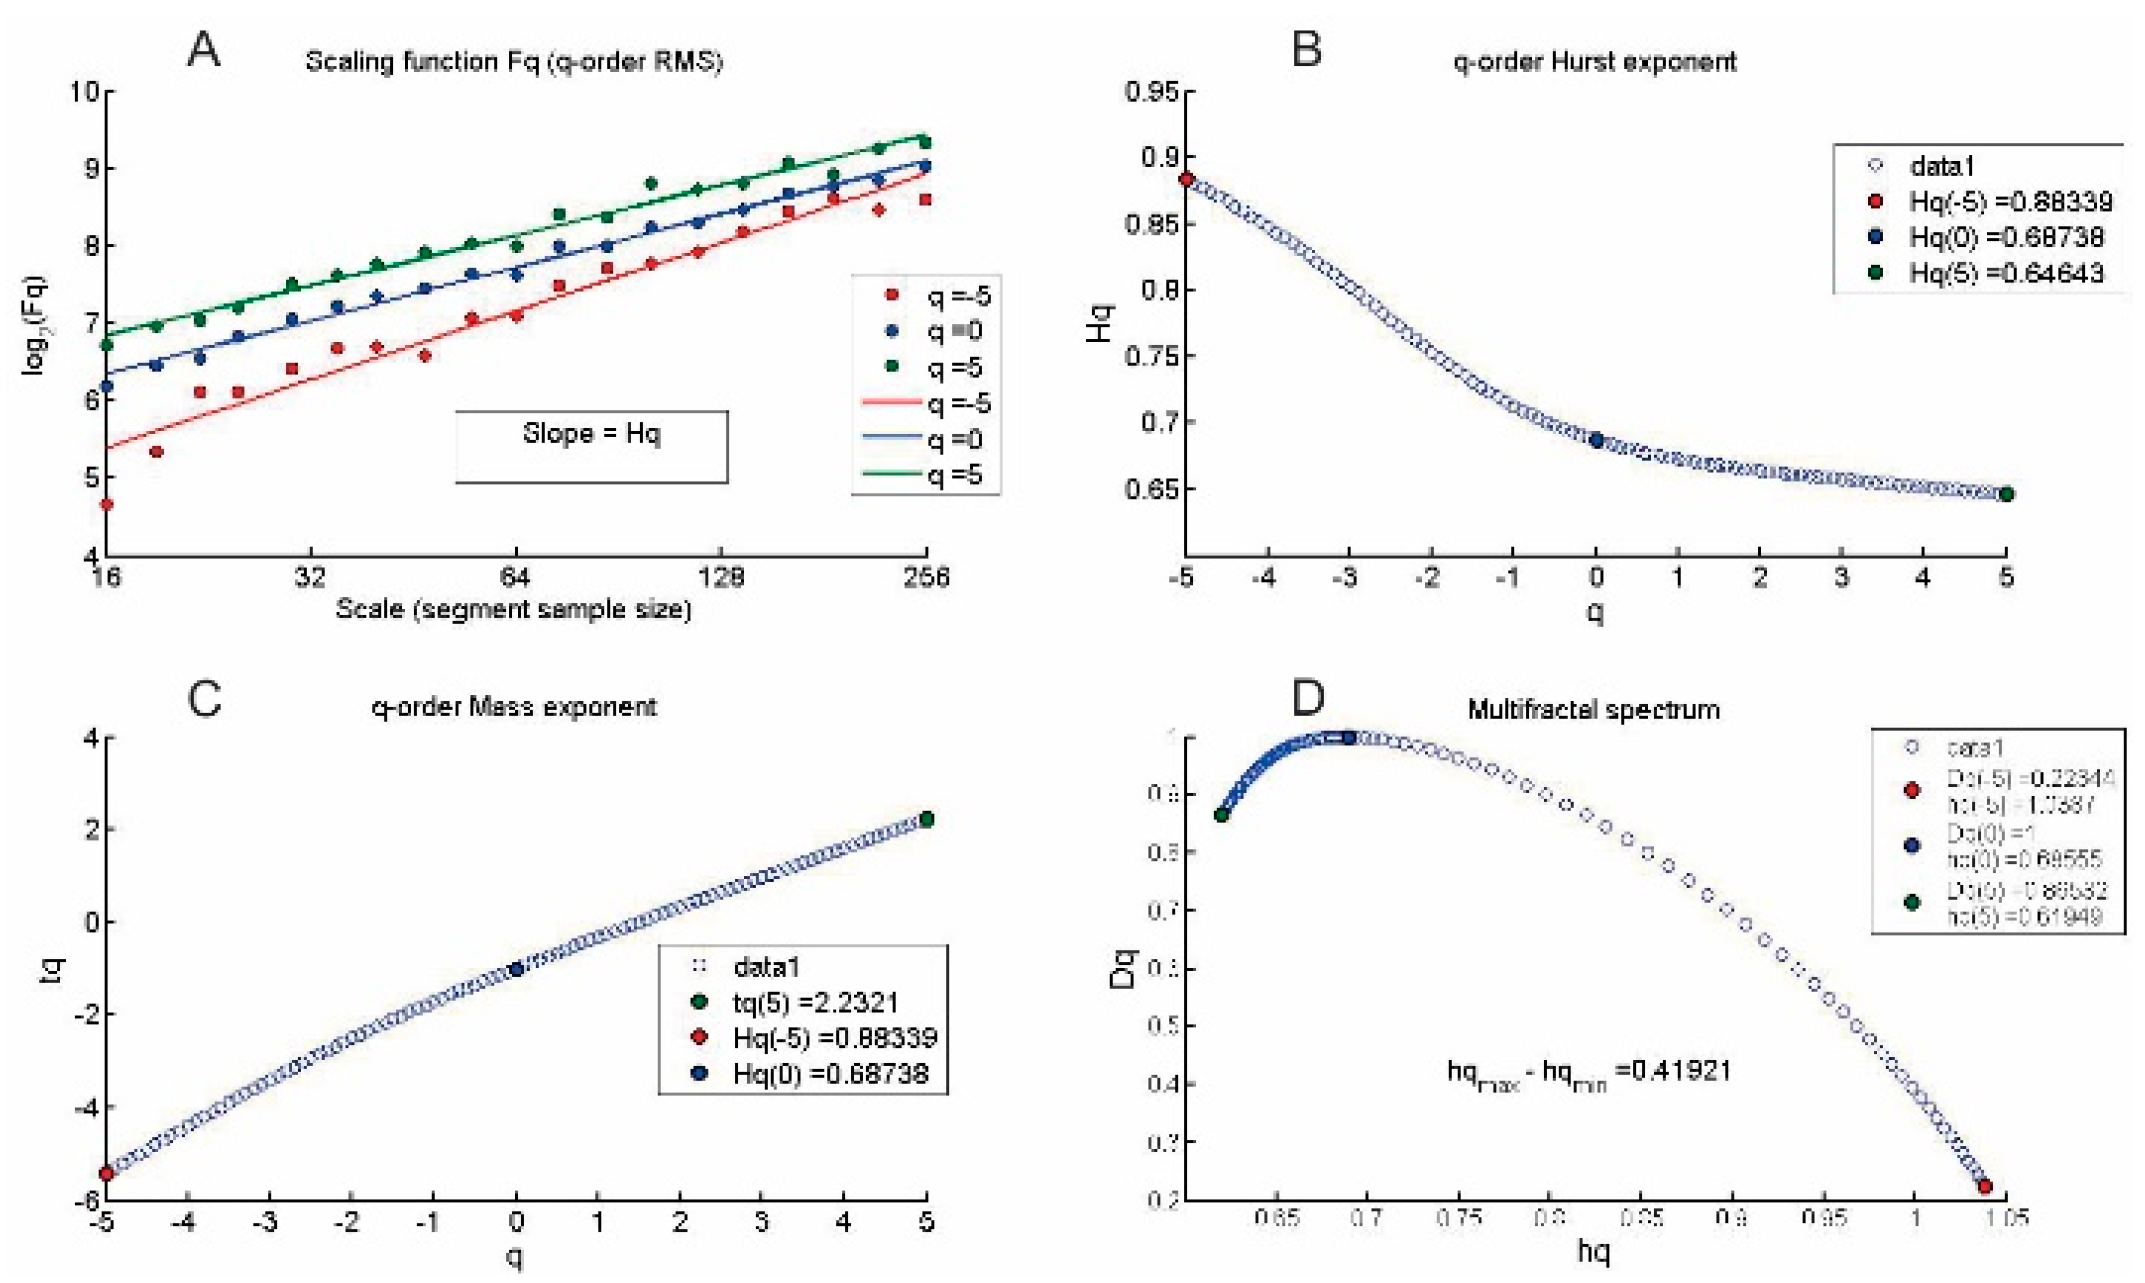
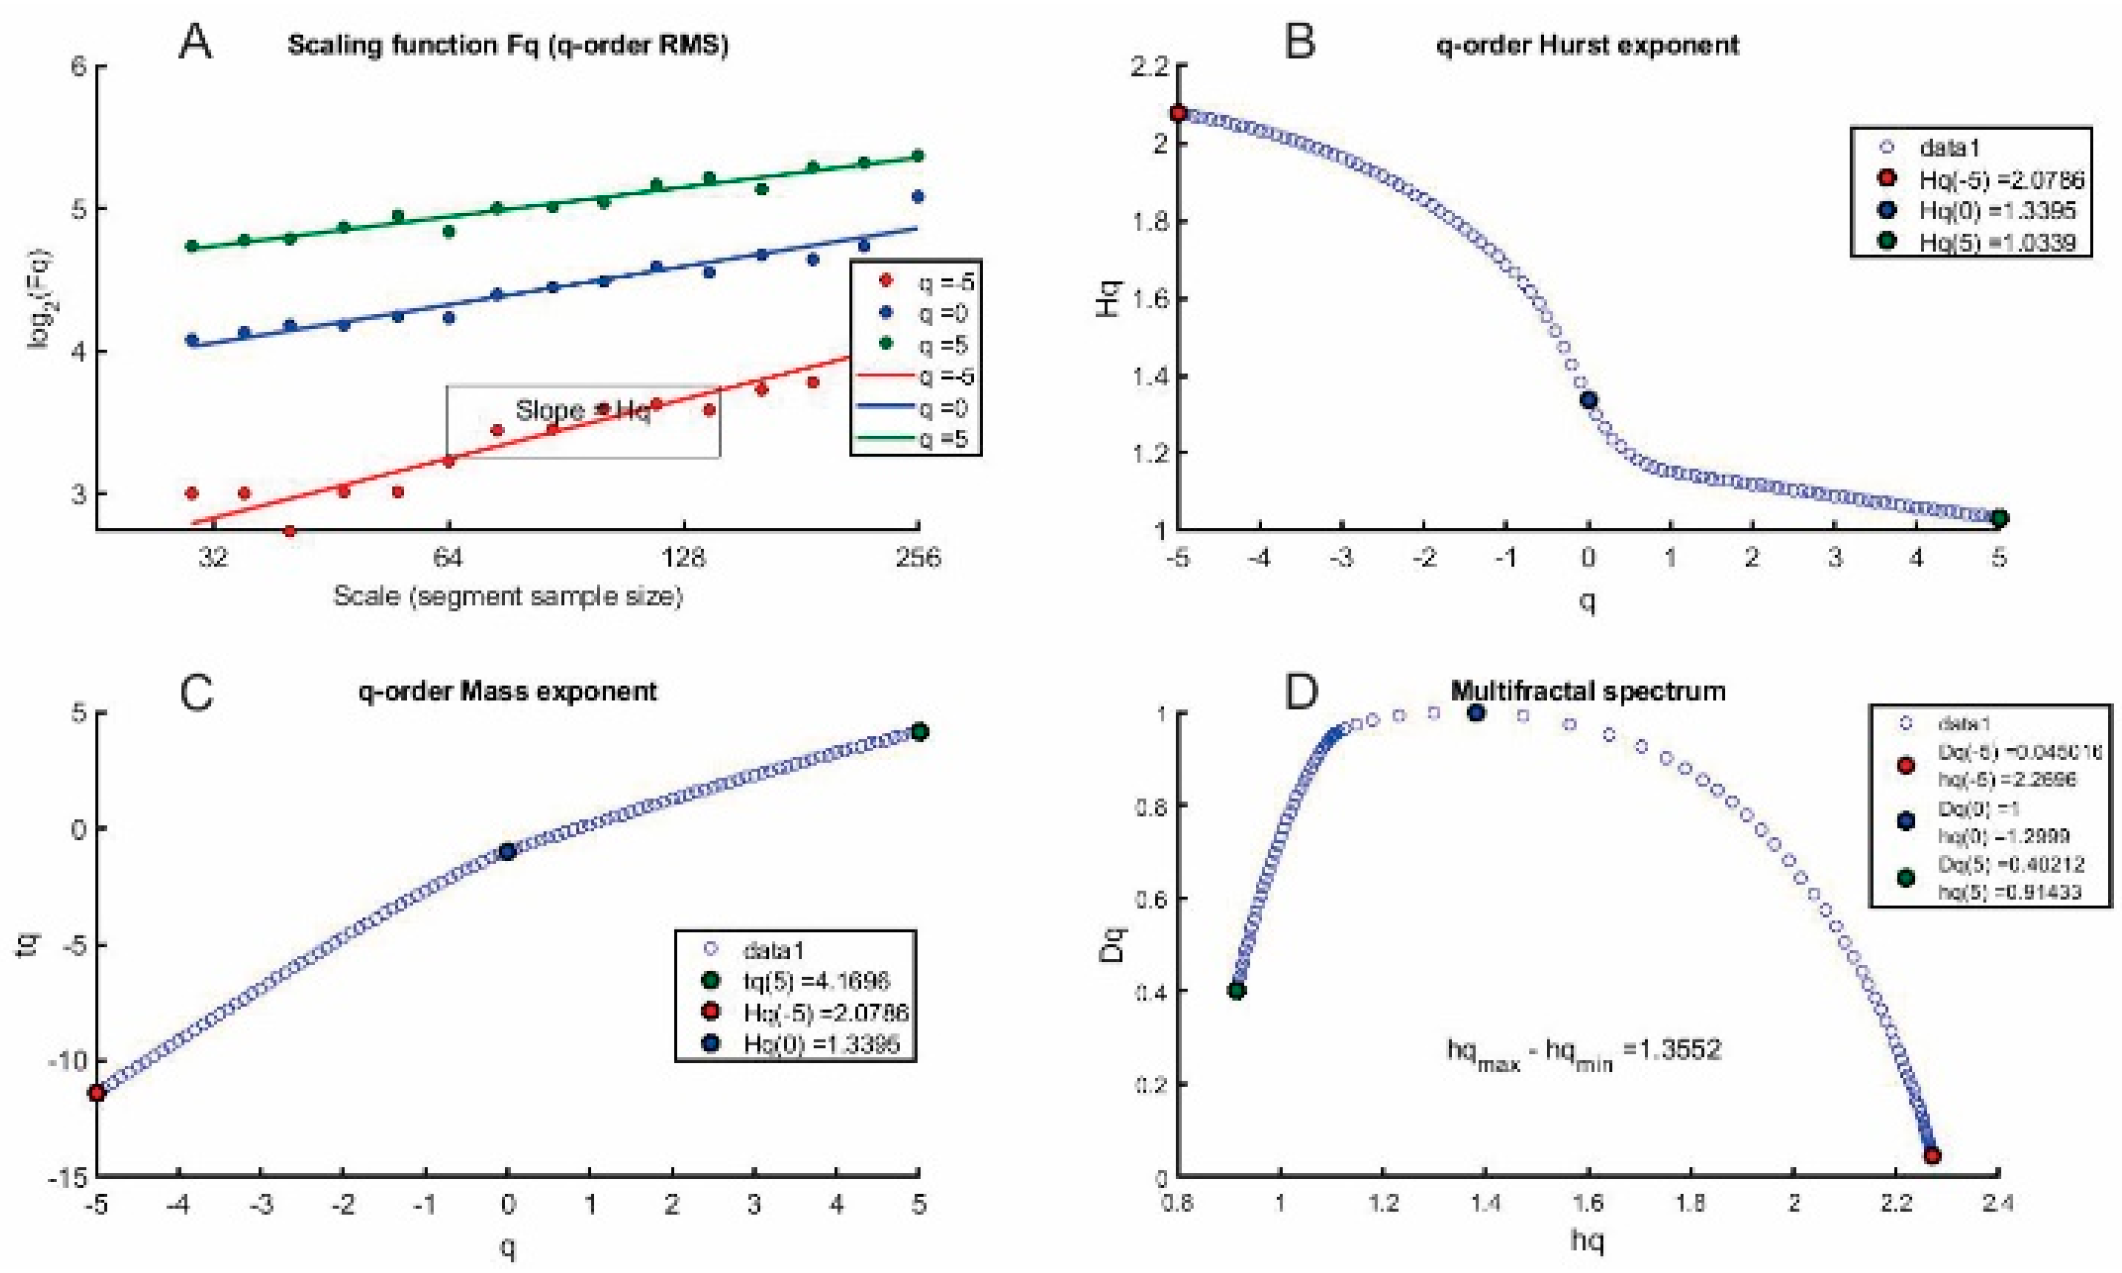
The variables analyzed were magnitude (Figure 2), inter-distance (Figure 3) and interevents (Figure 4). The scaling function Fq is represented in Figure 1A for different q values and estimates the slope Hq. Except for some fluctuations, it can be seen that the fluctuation function Fq follows a linear trend in logarithmic coordinates. Thus, we can identify the generalized exponent of Hurst H(q) in Figure 2B, with the slope for each order of q according to the potential law. The values given to (q) are –5 and 5, considering a set of events ranging from a scale of 5 to a total of N/4 (N is the total value of our samples). According to [14], the different slopes of the fluctuation curves indicate that the fluctuations of small and large events are scaled differently.
Likewise, if we compare each of Figure 2A, Figure 3A and Figure 4A, we can determine that the results of the variable magnitude and inter-distance are similar (almost parallel to each other) in comparison with the results of the interevent variable with steeper slopes, resulting in different and strongly dependent Hurst exponents of (q).
Figure 2B, Figure 3B and Figure 4B relate each of the q values to its corresponding Hurst exponent for magnitude, inter-distance and interevent variables, respectively. As can be observed, the lower the value of (q), the greater the Hurst exponent, and vice versa. A clarification regarding the curves of the interevent series it is necessary, where multifractal behavior was not detected in scales less than 32 due to a non-linear relationship.
In Figure 2D, Figure 3D and Figure 4D the multifractal spectrum obtained by applying the Legendre transformation (Equation (8)) is represented for each variable. The multifractal spectrum allows the multifractality of a time series to be described qualitatively and quantitatively considering its width (W), which determines the richness of the multifractal structure.
Regarding Hurst exponents (Hq) in the magnitude series, a value for H2 = 0.78 was obtained. This indicates a persistence or the presence of a long-range correlation in the series, such that large values are preceded by the same type of values. This was also detected for the inter-distance series (H2 = 0.66). However, the interevent series presented H2 = 1.16, indicating that the dynamics of this variable corresponds to fluctuating noise, which is common in critical self-similar systems. In Table 1, the characteristic parameters of the multifractal spectrum are summarized.
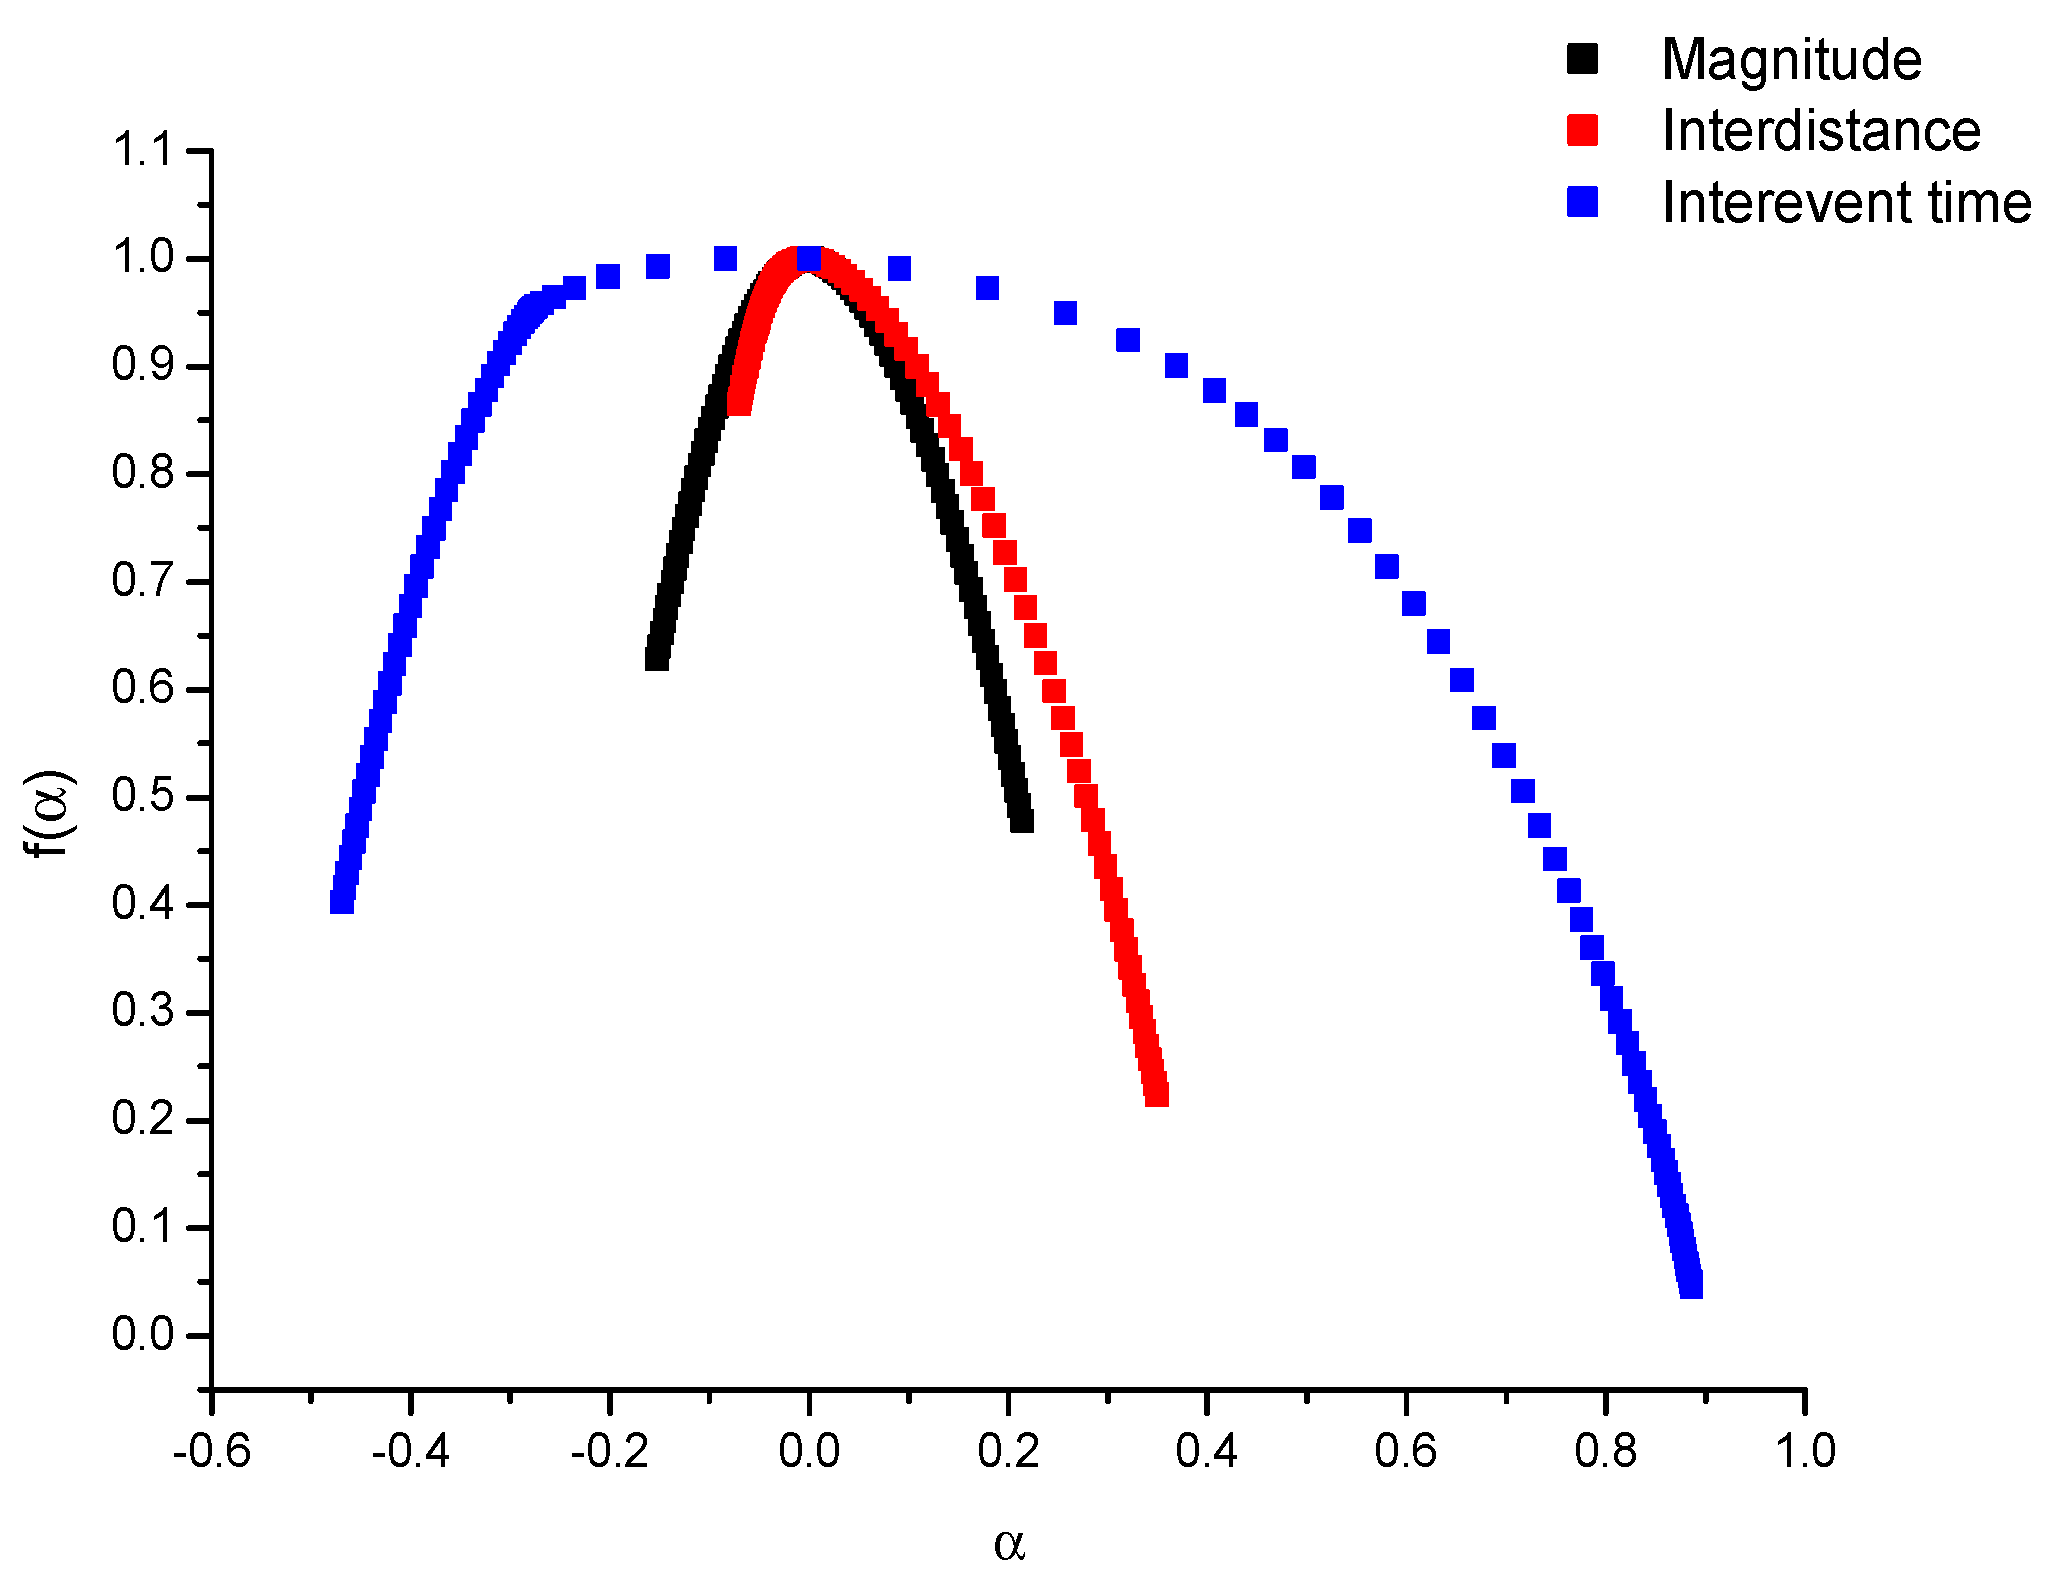
Based on the data reported in Table 1, and by comparing the three multifractional spectra (Figure 5), it is observed that the interevent series has a greater degree of multifractality than the other two series, and that the inter-distance series presents a multifractality slightly greater than the magnitude series. All series appear biased to the right, which is consistent with r > 1. This indicates that small variations in the series are more dominant than large fluctuations. It seems, also, that such dominance is more intense for the interevent series than the other two series.

6. Conclusions

-
Due to its enormous importance and the need to expand knowledge, multifractal analysis of the seismic activity of the provinces of Esmeraldas and Manabí in Ecuador was carried out by obtaining their multifractal spectra.
-
The studied seismic phenomena displayed a dynamic change of heterogeneity towards homogeneity, and from variance to becoming constant during the activation of the replica. This was revealed by a loss of multifractality after a main event.
-
The results of this study revealed a persistent behavior of the magnitude and inter-distance series, while the interevent series showed a behavior of fluctuating noise.
-
When determining a relationship between the resulting curves, all series appeared biased to the right, which was consistent with r > 1. This indicates that small variations in the series are more dominant than large fluctuations. It seems, also, that such dominance is more intense for the interevent series than the other two, due to the resulting values for each of the series and their respective exponents of Hurst.

Funding

This work was partially funded by the Spanish Ministry of Science, Innovation and Universities with Project No. AGL2017-87658-R.

Acknowledgments

The authors acknowledge the valuable help of the researcher Luciano Telesca.

Conflicts of Interest

The authors declare no conflict of interest.

References

  1. Paladines, A.; Soto, J. Geología y Yacimientos Minerales del Ecuador; Universidad Técnica Particular de Loja: Loja, Ecuador, 2010; 223p. [Google Scholar]
  2. Cruz Atienza, V. Los sismos, una amenaza cotidiana; La caja de cerillos ediciones: Ciudad de México, México, 2013; 111p. [Google Scholar]
  3. Sánchez, F.V. Los Terremotos y sus Causas; España: Instituto Andaluz de Geofísica y Prevención de Desastres Sísmicos: Dialnet, Spain, 2000; 123p. [Google Scholar]
  4. Guartan, J.A.; Tamay, J.V. Optimización del proceso de recuperación de oro contenido en los relaves de molienda de la planta “Vivanco” por el método de flotación-cianuración; Investigation; UTPL: Loja, Ecuador, 2003. [Google Scholar]
  5. Mandelbrot, B.B. The Fractal Geometry of Nature, Updated and augm. ed.; W.H. Freeman: New York, NY, USA, 1983; 460p. [Google Scholar]
  6. Senesi, N.; Wilkinson, K.J. Biophysical chemistry of fractal structures and processes in environmental systems; Wiley: Chichester, West Sussex, UK; Hoboken, NJ, USA, 2008; 340p. [Google Scholar]
  7. Spalla, M.I.; Marotta, A.M.; Gosso, G. Advances in Interpretation of Geological Processes: Refinement of Multi-Scale Data and Integration in Numerical Modelling; Geological Societ: London, UK; Williston, VT, USA, 2010; 240p. [Google Scholar]
  8. Instituto Geográfico Militar, I. Cartographer; Carta Topográfica: Esmeraldas, Ecuador, 2008. [Google Scholar]
  9. Brito, S. Instituto Nacional de Investigación Geológico Minero Metalúrgico, E. Atlas geológico minero del Ecuador; INIGEMM, Gobierno de Ecuador: Quito, Ecuador, 2017; 245p. [Google Scholar]
  10. Morejón, J. Es Provincia Verde; Fundación Naturaleza Viva Fundación Naturaleza Viva: Esmeraldas, Ecuador, 2012; 179p. [Google Scholar]
  11. Prefectura de Manabí. Plan de desarrollo y ordenamiento territorial de la provincia de Manabí, diagnostico estratégico; Prefectura de Manabí, Gobierno de Ecuador: Manabí, Ecuador, 2014; 335p. [Google Scholar]
  12. Kantelhradt, J.; Zschiegner, S.; Koscielny-Bunde, E. Multifractal Detrended Fluctuation Analysis of Noostationary Time Series. Phys. A Stat. Mech. Appl. 2002, 316, 87–114. [Google Scholar] [CrossRef]
  13. Mandelbrot, B.B.; Novak, M.M. Thinking in Patterns: Fractals and Related Phenomena in Nature, World Scientific: River Edge, NJ, USA, 2004; 323p.
  14. Telesca, L.; Lapenna, V. Measuring multifractality in seismic sequences. Tectonophysics 2006, 423, 115–123. [Google Scholar] [CrossRef]
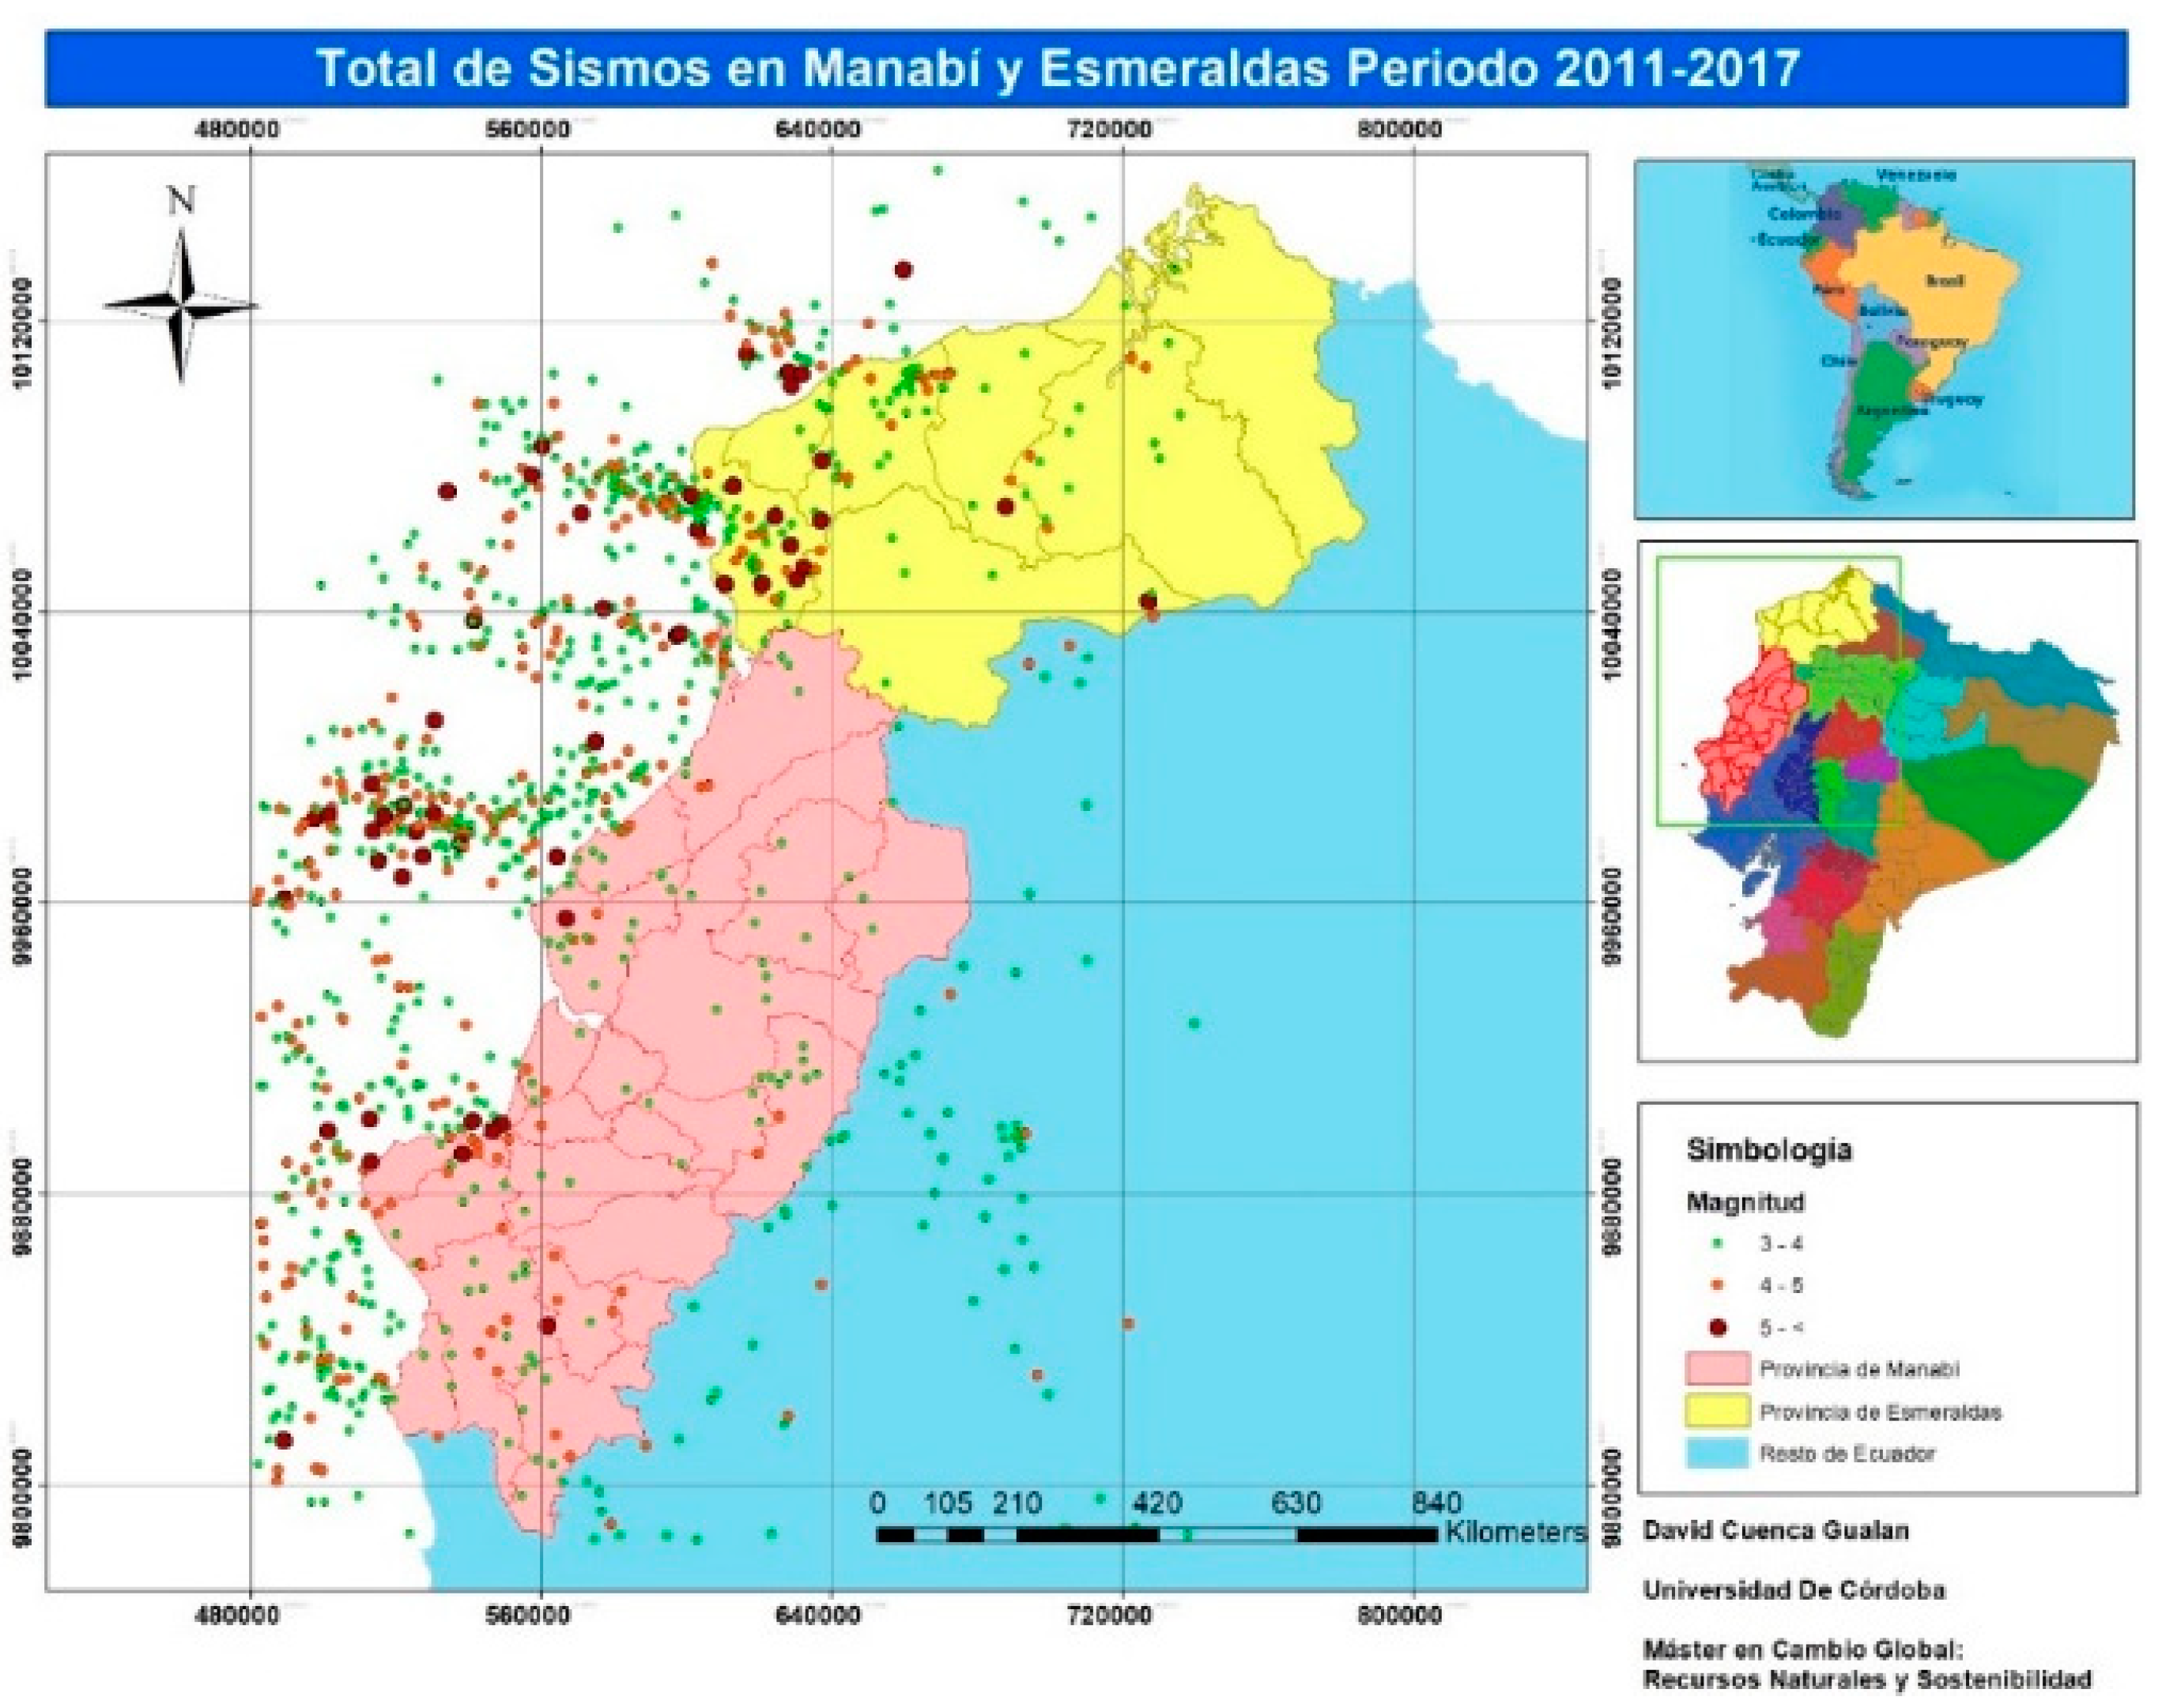
Figure 1. Total earthquakes in the study area.
Proceedings 24 00027 g001
Figure 2. Results from the multifractal analysis of magnitude.
Proceedings 24 00027 g002
Figure 3. Results from the multifractal analysis of inter-distance.
Proceedings 24 00027 g003
Figure 4. Results from the multifractal analysis of the interevent series.
Proceedings 24 00027 g004
Figure 5. Multifractal spectrum of the three variables studied.
Proceedings 24 00027 g005
Table 1. Characteristic parameters of the multifractal spectrum.
Magnitude
WidthAsymmetry rAverage h(q)St. Dev. h(q)Max. Delta.
0.551.230.82830.11060.2396
Inter-distance Km
WidthAsymmetry rAverage h(q)St. Dev. h(q)Max. Delta.
0.561.940.76490.14640.3579
Interevent (min)
WidthAsymmetry rAverage h(q)St. Dev. h(q)Max. Delta.
1.442.041.55620.55270.4584