Proceeding Paper

AVIRIS-NG Data for Geological Applications in Southeastern Parts of Aravalli Fold Belt, Rajasthan †

1
Department of Geosciences, Indian Institute of Remote Sensing, Indian Space Research Organization, Dehradun 248001, India
2
Department of Remote Sensing, Kerala University of Fisheries and Ocean studies, Kochi, Kerala 682506, India
*
Author to whom correspondence should be addressed.
Presented at the 2nd International Electronic Conference on Geosciences, 8–15 June 2019; Available online: https://iecg2019.sciforum.net/.
Proceedings 2019, 24(1), 16; https://doi.org/10.3390/IECG2019-06212
Published: 5 June 2019
(This article belongs to the Proceedings of The 2nd International Electronic Conference on Geosciences)

Abstract

:
Advanced techniques using high resolution hyperspectral remote sensing data has recently evolved as an emerging tool with potential to aid mineral exploration. In this study, pertinently, five mosaicked scenes of Airborne Visible InfraRed Imaging Spectrometer-Next Generation (AVIRIS-NG) hyperspectral data of southeastern parts of the Aravalli Fold belt in Jahazpur area, Rajasthan, were processed. The exposed Proterozoic rocks in this area is of immense economic and scientific interest because of richness of poly-metallic mineral resources and their unique metallogenesis. Analysis of high resolution multispectral satellite image reveals that there are many prominent lineaments which acted as potential conduits of hydrothermal fluid emanation, some of which resulted in altering the country rock. This study takes cues from studying those altered minerals to enrich our knowledge base on mineralized zones. In this imaging spectroscopic study we have identified different hydrothermally altered minerals consisting of hydroxyl, carbonate and iron-bearing species. Spectral signatures (image based) of minerals such as Kaosmec, Talc, Kaolinite, Dolomite, and Montmorillonite were derived in SWIR (Short wave infrared) region while Iron bearing minerals such as Goethite and Limonite were identified in the VNIR (Visible and Near Infrared) region of electromagnetic spectrum. Validation of the target minerals was done by subsequent ground truthing and X-ray diffractogram (XRD) analysis. The altered end members were further mapped by Spectral Angle Mapper (SAM) and Adaptive Coherence Estimator (ACE) techniques to detect target minerals. Accuracy assessment was reported to be 86.82% and 77.75% for SAM and ACE respectively. This study confirms that the AVIRIS-NG hyperspectral data provides better solution for identification of endmember minerals.

1. Introduction

Remote sensing techniques have significantly enhanced and eased mapping of structural controls like faults, fracture systems, host rocks, and alteration/ weathered zones indicative of mineral deposits [1,2,3,4,5]. Pertinently, high spectral resolution of hyperspectral data goes in tandem with multispectral and field based methods to aid mineral exploration. Hence, image and field based reflectance and emission spectroscopy in visible to near infrared and short/mid infra-red have been employed universally as an aid in mineral characterisation and exploration [6,7,8]. Data collected by hyperspectral sensors with contiguous and coherent band parameters provide crucial help in quantitative and qualitative identification and mapping. This allows a vivid characterisation of the spatially distributed heterogeneous mineralogical paragenesis, taking cues from different advanced image processing techniques [9,10,11,12,13,14]. Thus, spectrometry becoming more sophisticated and having a greater signal to noise ratio, the arena of space-borne, field or lab-based imaging spectroscopy has enhanced the application of remote sensing in its technical capability, and its potential for geological mapping and mineral exploration [15,16,17,18,19,20].
Though hyperspectral remote sensing techniques for mineralogical targeting and abundance mapping have been in operation since the 1980s, there application in the Indian sub-continent is at a budding stage. It is mainly because of a lack of space and air borne hyperspectral coverage. A joint airborne hyperspectral imaging campaign has been conducted by the Indian Space Research Organization (ISRO) and the National Aeronautics and Space Administration (NASA) for AVIRIS-NG analysis over the different parts of India since 2016. AVIRIS-NG measures in the 380–2510 nm spectral range, high spectral and spatial uniformity with high SNR (>2000 ≅ 600 nm and >1000 ≅ 2200 nm) with an accuracy of 95% [21]. This study has thus benefitted from AVIRIS-NG hyperspectral data, used to identify, characterize, and classify the alteration zones based on the abundance of diagnostic mineral assemblages, and therefore holds promise for their application in potentially mineralized areas which are so far unexplored or inadequately explored.

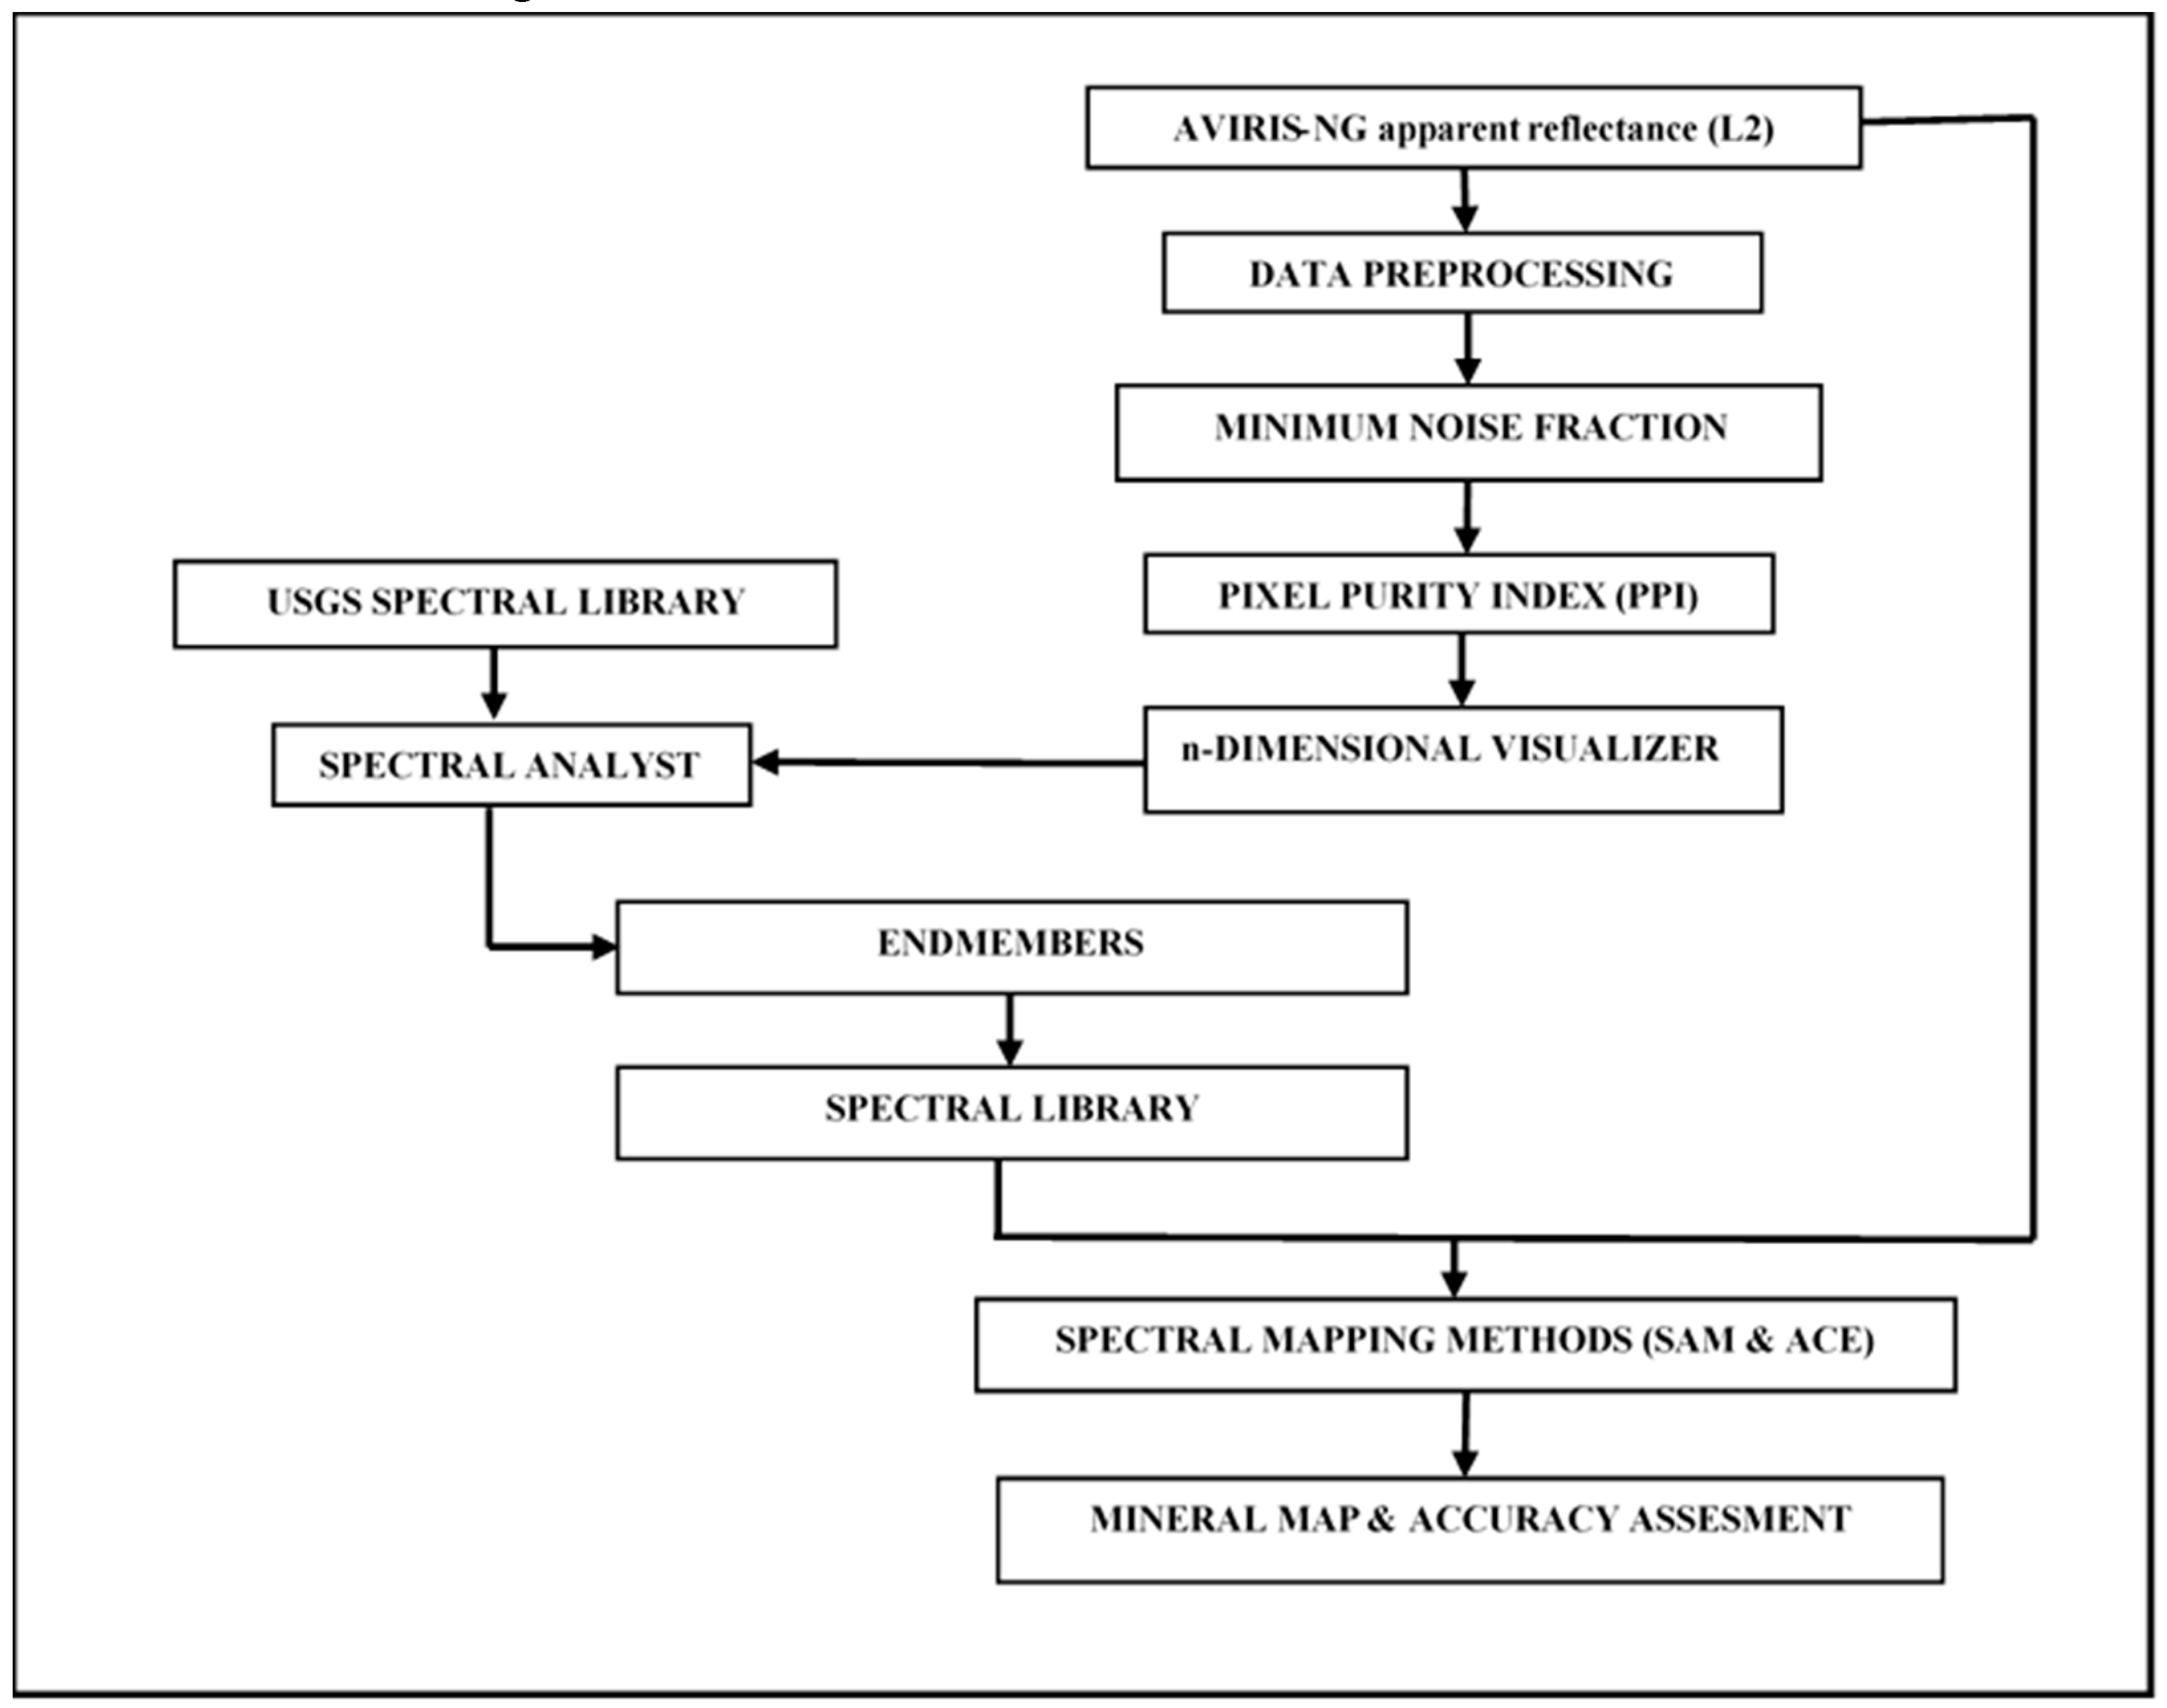
2. Materials and Methods

In this study, 364 VNIR (Visible and Near Infrared) and SWIR (Short wave infrared) channels out of 425 ranging from 376 to 2500 nm were analyzed for the identification of hydroxyl, carbonate, and iron-bearing mineral phases, and to map the basis of the nature and shape of diagnostic absorption features of minerals. Figure 1 describes the methodology/algorithm adopted for this study using a flow diagram. The apparent reflectance product (L2) was linearly transformed through minimum noise fraction (MNF) transform, which is a doubly cascaded principal component analysis [22]. The first step segregated the data in terms of noise and the second step was a standard statistical method i.e. Principal component analysis (PCA) transformation applied to the noise-whitened data. The MNF transformation calculated noise statistics in terms of eigenvalues from the input data. Eigenvalues were then used to understand the data dimensionality, which allows one to choose the maximum suitable MNF bands for further processing [22]. Subsequent to data dimensionality reduction, a pixel purity index (PPI) image i.e. image pixels containing spectrally most pure characteristic signatures, was generated to identify the spectrally pure pixels within the area. In the PPI image, each pixel value corresponds to the number of times that pixel was recorded as extreme. The n-dimensional visualizer was used to locate, identify and cluster the purest pixels and the most extreme spectral responses in a dataset. The spectra collected by the n-dimensional visualizer were used as endmembers to run the SAM (Spectral Angle Mapper) and ACE (Adaptive Coherence Estimator) classifier. Before running the SAM classifier, the identification of endmember spectra was obtained by comparing with the available predefined mineral spectra from the United States Geological Survey (USGS) spectral library, using the ENVI 5.0 (Research Systems, Inc., Boulder, CO, USA) spectral analyst tool. Well established mapping methods namely SAM and Spectral feature fitting (SFF), were used for the identification of the collected endmember spectra. SAM is a physical based spectral classification method that uses an n-D angle to match pixels to reference spectra. The algorithm determines the spectral similarity between two spectra by calculating the angle between the spectra and treating them as vectors in space with dimensionality equal to the number of bands [23]. In this study, a single value threshold of 0.1 rad was used as the maximum angle threshold. SFF is an absorption feature-based methodology. The reference spectral and the image spectra were scaled to match after the continuum was removed from both datasets. In this study, our aim was to map the hydroxyl, carbonate, and iron-bearing minerals that have characteristic absorption features in the VNIR as well as the SWIR region. This is the reason why we have given the same 0.5 weight to SAM and SFF. Also, in many cases, the spectral analyst lists multiple identical scores for different materials in the rule base. This indicates that the spectral analyst cannot discriminate between the two materials under identification conditions. In this case, different weighted methods should be used to produce a unique result. The SAM and ACE technique was then applied to the all five AVIRIS-NG scenes to classify hydroxyl, carbonate, and iron-bearing minerals. As accuracy assessment is an important part of any classification technique as it helps to find out how well the classification was performed. Published geological maps were used to further the accuracy assessment for determining the better method.

3. Results and Discussion

The apparent reflectance data (L2), before processing, were preprocessed by removing bad bands. After processing, 374 bands remained of 425. Data were first linearly transformed (MNF transformation) to generate 374 MNF bands. Out of the 374 MNF bands, the first 20 bands were chosen, on the basis of eigenvalues, which contained most of the spectral information. Mineral endmembers were extracted after processing PPI calculation and N-dimensional visualization analysis.
A total of nine endmembers (Figure 2) representative of different hydroxyl, carbonate, and iron bearing minerals selected from the image on the basis of shape, size and, position of spectral absorption features. A higher total score indicates higher proximity of an endmember to the designated mineral chosen from the USGS spectral library. The known versus unknown analysis revealed that the nine endmembers were talc, Kaosmec, montmorillonite, kaolinite, dolomite, goethite, limonite, goethite and montmorillonite, and hematite and Koasmec.
Endmembers were used to classify these five AVIRIS-NG scenes using SAM and ACE (Figure 3 and Figure 4), respectively. The mineral map obtained by applying the SAM and ACE classifiers were further subjected to accuracy assessment. The overall accuracy for both SAM and ACE is shown in Table 1. This shows that SAM is a better technique than ACE for producing mineral maps.

4. Conclusions:

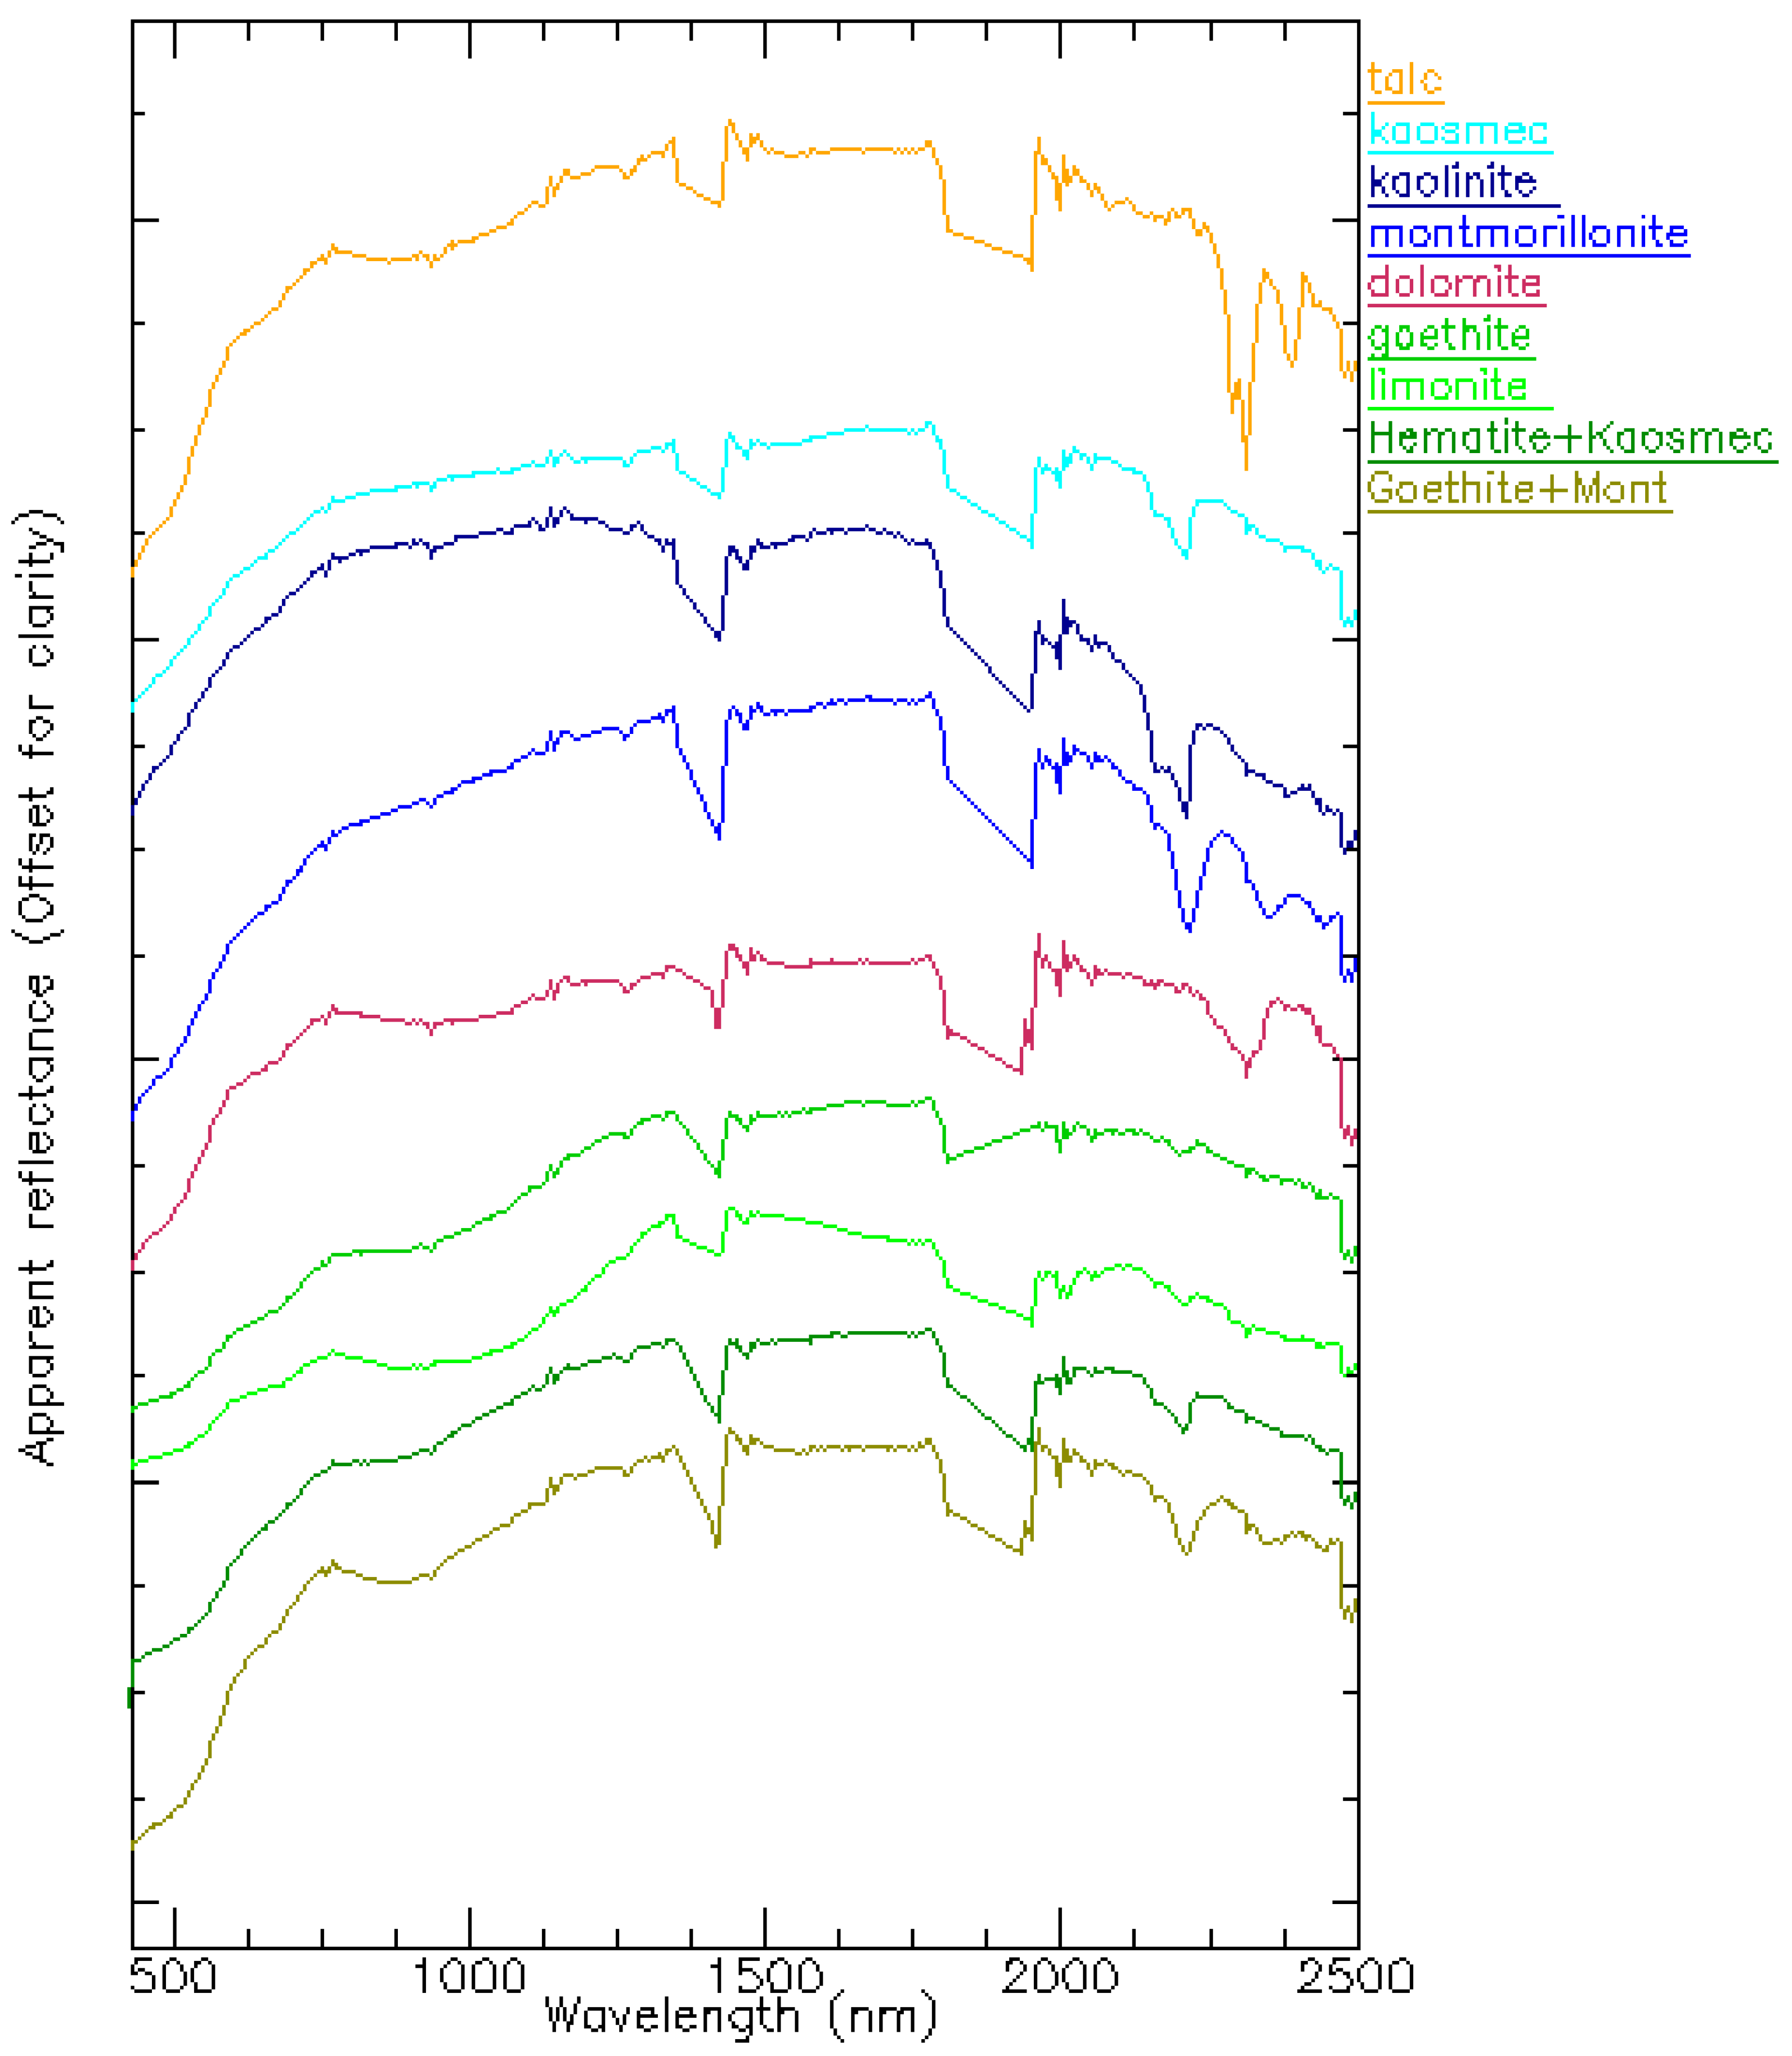
In the present study, mineral endmembers are identified from AVIRIS-NG hyperspectral images by using spectral and spatial data dimensionality reduction techniques.
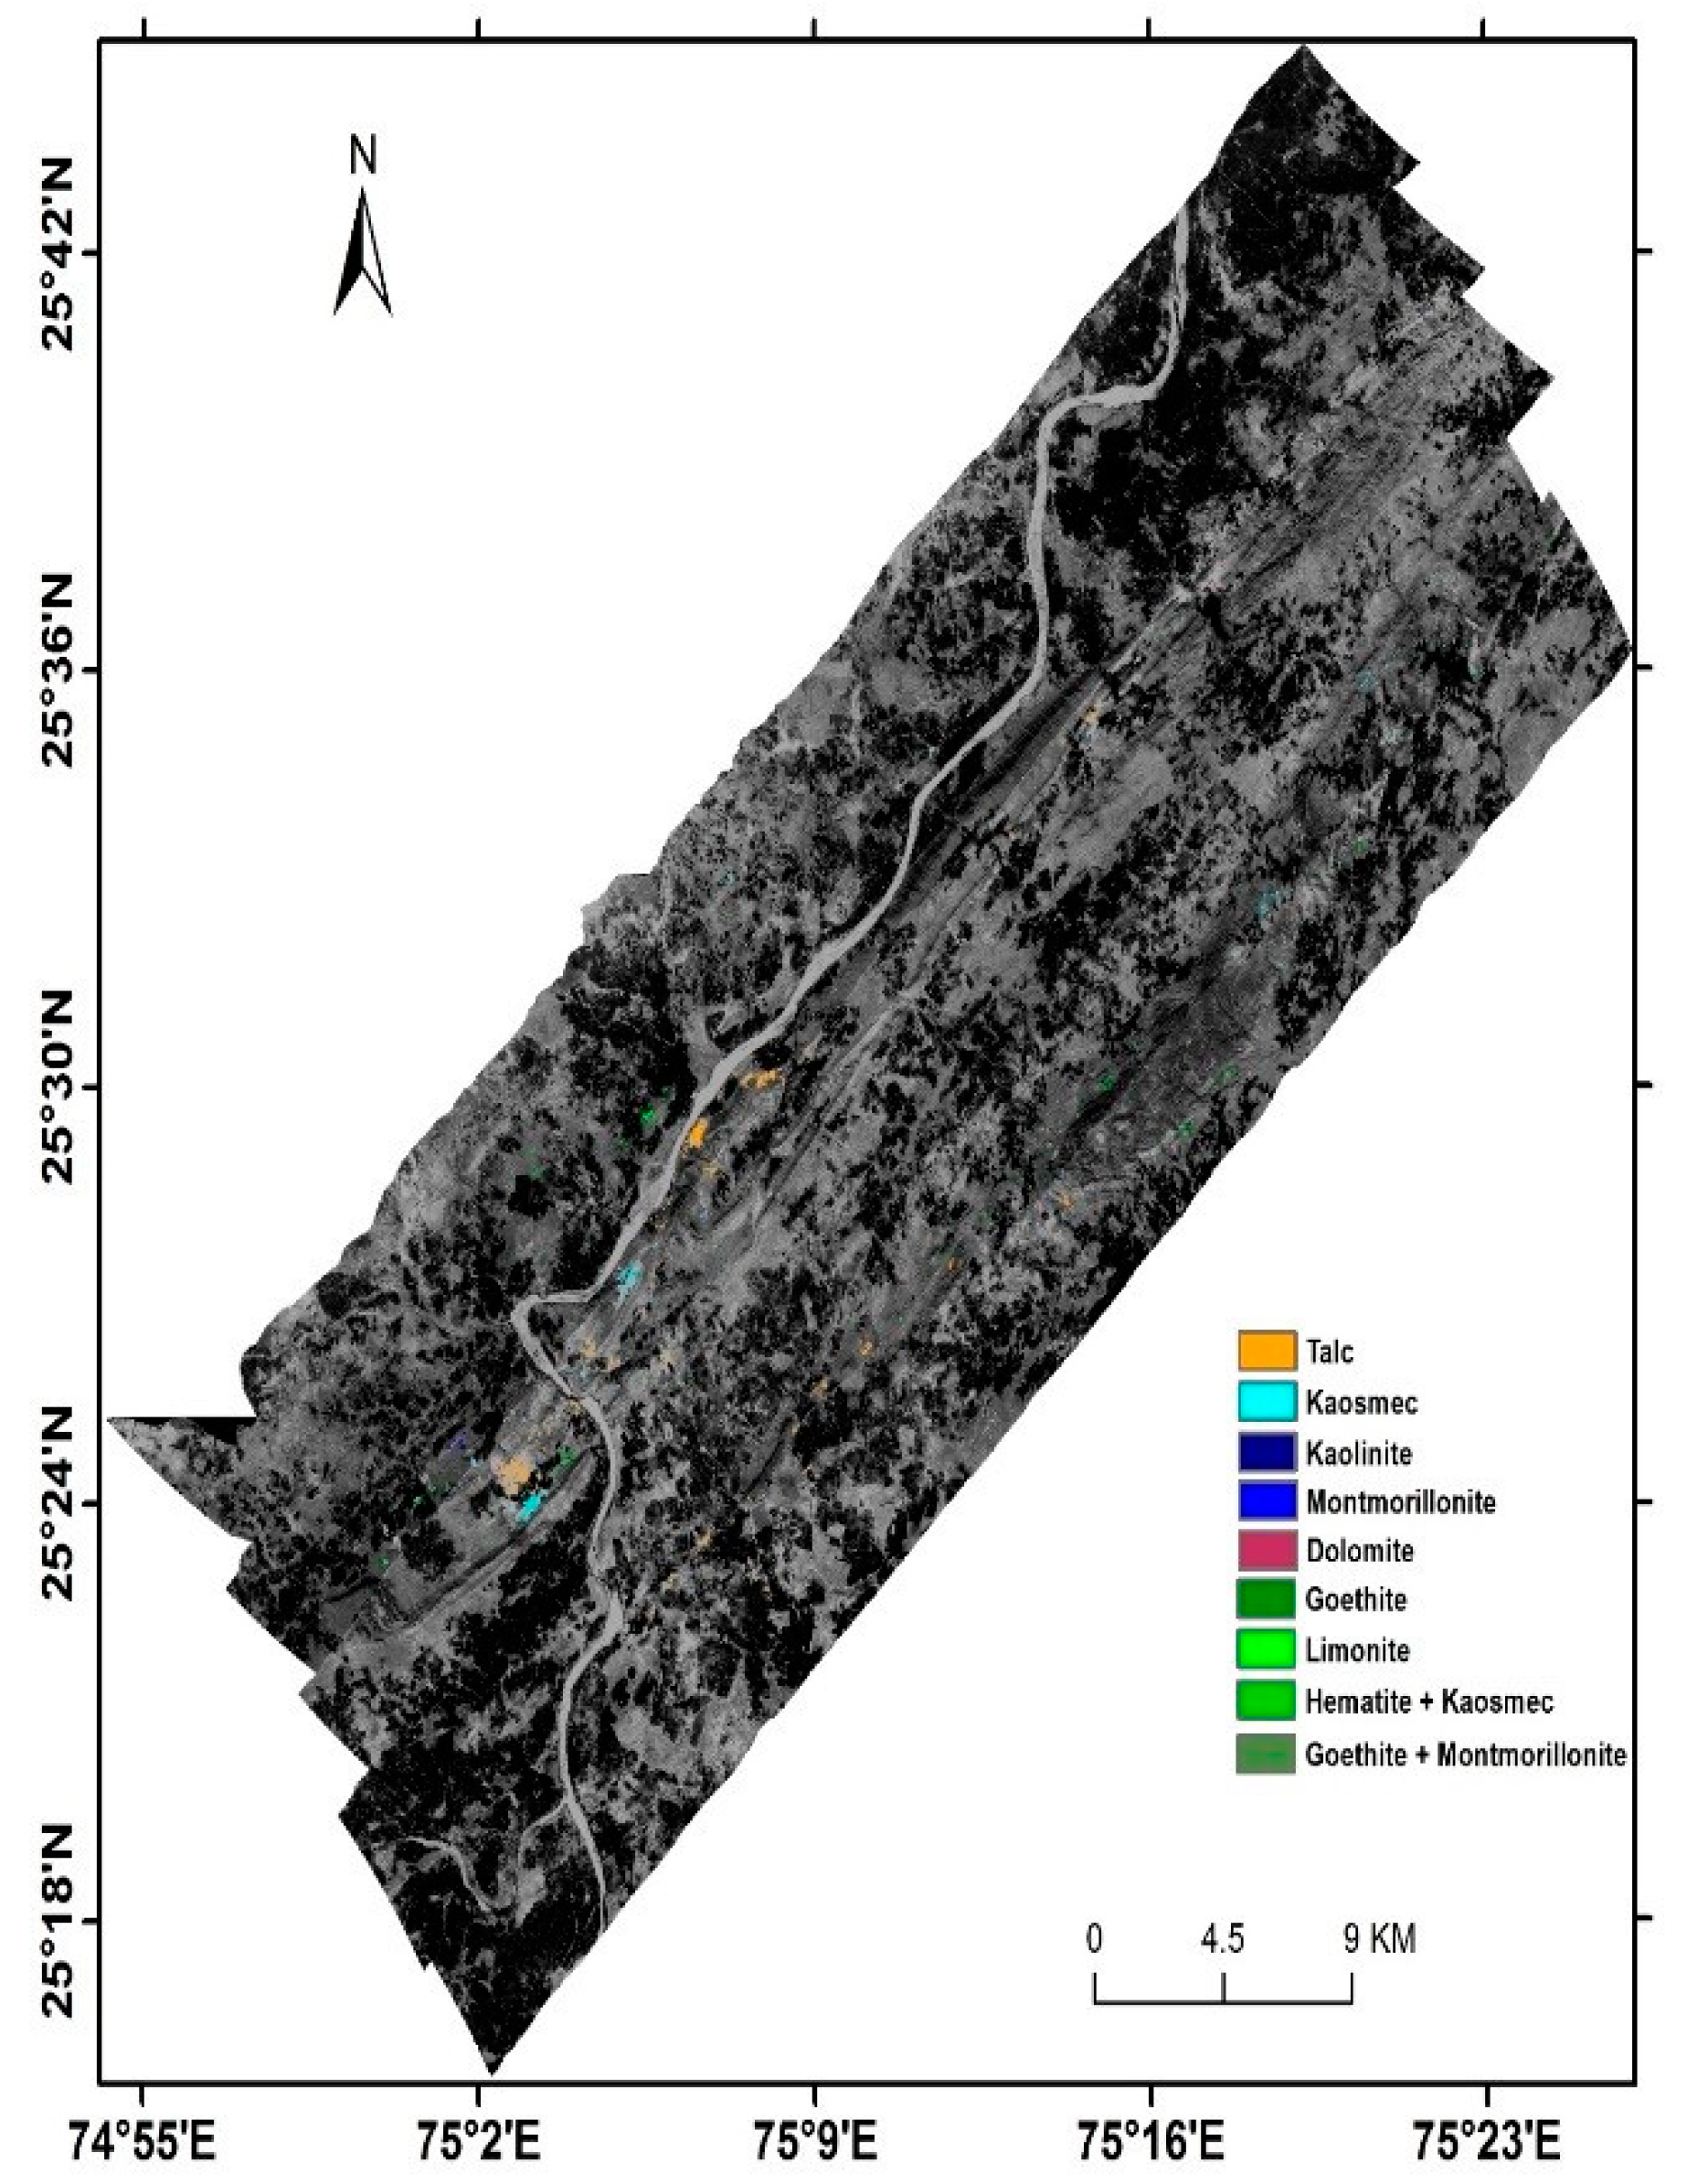
Because of the contiguous nature of AVIRIS-NG data, it has become possible to study the shape, size, and accurate location of spectral features, which in turn helps in identifying and discriminating various minerals, in particular phyllosilicate, carbonate, and iron bearing minerals.
Thus it can be calculated that AVIRIS-NG data, with high spectral and spatial resolution, can be very efficiently used for the identification and mapping of altered and clay components.
Accuracy assessment of mineral maps, by using SAM and ACE techniques, revealed that SAM produces better result.

References

  1. Goetz, A.F.H.; Vane, G.; Solomon, J.E.; Rock, B.N. Imaging spectrometry for earth remote sensing. Science 1985, 228, 1147–1153. [Google Scholar] [CrossRef] [PubMed]
  2. Hunt, G.R. Spectral signatures of particulate minerals in the visible and near infrared. Geophysics 1977, 42, 501–513. [Google Scholar] [CrossRef]
  3. Hunt, G.R.; Salisbury, J.W. Visible and near-infrared spectra of minerals and rocks: I silicate minerals. Mod. Geol. 1970, 1, 283–300. [Google Scholar]
  4. Hunt, G.R. Spectroscopic properties of rocks and minerals. In Handbook of Physical Properties Of rocks; CRC Press: Boca Raton, FL, USA, 1982; p. 92. [Google Scholar]
  5. Thompson, A.J.B.; Hauff, P.L.; Robitaille, A. Alteration mapping in exploration: Application of short-wave infrared (SWIR) spectroscopy. Soc. Econ. Geol. Newsl. 1999, 39, 16–27. [Google Scholar] [CrossRef]
  6. Cloutis, E.A. Hyperspectral geological remote sensing: Evaluation of analytical techniques. Int. Jour. Remote Sens. 1996, 17, 2215–2242. [Google Scholar] [CrossRef]
  7. Sabins, F.F. Remote sensing for mineral exploration. Ore Geol. Rev. 1999, 14, 157–183. [Google Scholar] [CrossRef]
  8. Kruse, F.A. Identification and mapping of minerals in drill core using hyperspectral image analysis of infrared reflectance spectra. Int. J. Remote Sens. 1996, 17, 1623–1632. [Google Scholar] [CrossRef]
  9. Van der Meer, F.; de Jong, S. (Eds.) Imaging Spectrometry: Basic Principles and Prospective Applications; Springer: Dordrecht, The Netherlands, 2001. [Google Scholar]
  10. van der Meer, F.D.; van der Werff, H.M.A.; van Ruitenbeek, F.J.A.; Hecker, C.A.; Bakker, W.H.; Noomen, M.F.; van der Meijde, M.; Carranza, E.J.M.; de Smeth, J.B.; Woldai, T. Multi- and hyperspectral geologic remote sensing: A review. Int. J. Appl. Earth Obs. Geoinf. 2012, 14, 112–128. [Google Scholar] [CrossRef]
  11. Van der Meer, F.D. Imaging spectrometry for geological remote sensing. Neth. J. Geosci. 1999, 77, 137–151. [Google Scholar]
  12. Van der Meer, F.D. Remote sensing image analysis and geostatistics. Int. J. Remote Sens. 2012, 33, 5644–5676. [Google Scholar] [CrossRef]
  13. Kruse, F.A.; Boardman, J.W.; Huntington, J.F. Evaluation and validation of EO-1 hyperion for mineral mapping. Ieee Trans. Geosci. Remote Sens. 2003, 41, 1388–1400. [Google Scholar] [CrossRef]
  14. Kruse, F.A. Mapping surface mineralogy using imaging spectrometry. Geomorphology 2012, 137, 41–56. [Google Scholar] [CrossRef]
  15. Goetz, A.F.H.; Chabrillat, S.; Lu, Z. Field reflectance spectrometry for detection of swelling clays at construction sites. Field Anal. Chem. Technol. 2001, 5, 143–155. [Google Scholar] [CrossRef]
  16. Goetz, F.H.A.; Curtiss, B.; Shiley, D.A. Rapid gangue mineral concentration measurement over conveyors by NIR reflectance spectroscopy. Miner. Eng. 2009, 22, 490–499. [Google Scholar] [CrossRef]
  17. Sun, Y.; Seccombe, P.K.; Yang, K. Application of IR spectroscopy to define alteration zones associated with Elura zinc–lead–silver deposit NSW Australia. J. Geochem. Explor. 2001, 73, 11–26. [Google Scholar] [CrossRef]
  18. Ramakrishnan, D.; Kusuma, K.N. (), Marine clays and its impact on the rapid urbanization developments: A case study of Mumbai area using EO-1-Hyperion data. Hyperspectral Remote Sens. Spectr. Signat. Appl. 2008, 2008, 53–64. [Google Scholar]
  19. Ramakrishnan, D.; Bharti, R.; Singh, K.D.; Nithya, M. Thermal inertia mapping and its application in mineral exploration: Results from Mamandur polymetal prospect, India. J. Earth Syst. Sci. 2013, 122, 93–106. [Google Scholar] [CrossRef]
  20. Pour, A.B.; Hashim, M. The application of ASTER remote sensing data to porphyry copper and epithermal gold deposits. Ore Geol. Rev. 2012, 44, 1–9. [Google Scholar] [CrossRef]
  21. Bhattacharya, B.K.; Green, R.O.; Rao, S.; Saxena, M.; Sharma, S.; Kumar, K.A.; Srinivasulu, P.; Sharma, S.; Dhar, D.; Bandyopadhyay, S.; et al. An overview of AVIRIS-NG airborne hyperspectral science campaign over India. Curr. Sci. 2019, 116, 1082–1088. [Google Scholar] [CrossRef]
  22. Green, A.A.; Berman, M.; Switzer, P.; Craig, M.D. A transformation for ordering multispectral data in terms of image quality with implications for noise removal. IEEE Trans. Geosci. Remote Sens. 1988, 26, 65–74. [Google Scholar] [CrossRef]
  23. Kruse, F.A.; Lefkoff, A.B.; Boardman, J.W.; Heidebrecht, K.B.; Shapiro, A.T.; Barloon, P.J.; Goetz, A.F.H. The spectral image processing system (SIPS)—Interactive visualization and analysis of imaging spectrometer data. Remote Sens. Environ. 1993, 44, 145–163. [Google Scholar] [CrossRef]
Figure 1. Flow diagram showing the methodology/algorithm adopted (Courtesy: ENVI 4.7 User’s guide 2009).
Proceedings 24 00016 g001
Figure 2. Endmember Collection Spectra.
Proceedings 24 00016 g002
Figure 3. Spectral Angle Mapper (SAM)-classified mineral map.
Proceedings 24 00016 g003
Figure 4. Adaptive Coherence Estimator (ACE)-classified mineral map.
Proceedings 24 00016 g004
Table 1. Comparison of accuracy assessment by SAM and ACE methods
Mapping MethodScene 1 (%)Scene 2 (%)Scene 3 (%)Scene 4 (%)Scene 5 (%)Overall Accuracy
Spectral Angle Mapper85.71487.50087.80485.58987.50086.821
Adaptive Coherence Estimator71.42879.16677.23577.61183.33377.754
Disclaimer/Publisher’s Note: The statements, opinions and data contained in all publications are solely those of the individual author(s) and contributor(s) and not of MDPI and/or the editor(s). MDPI and/or the editor(s) disclaim responsibility for any injury to people or property resulting from any ideas, methods, instructions or products referred to in the content.

