Integrated Hydrological Modelling over Upstream Catchments of Himalayan Rivers and Assessment of Hydrological Events in Tehri Dam and Srinagar Catchments †


Abstract
:1. Introduction
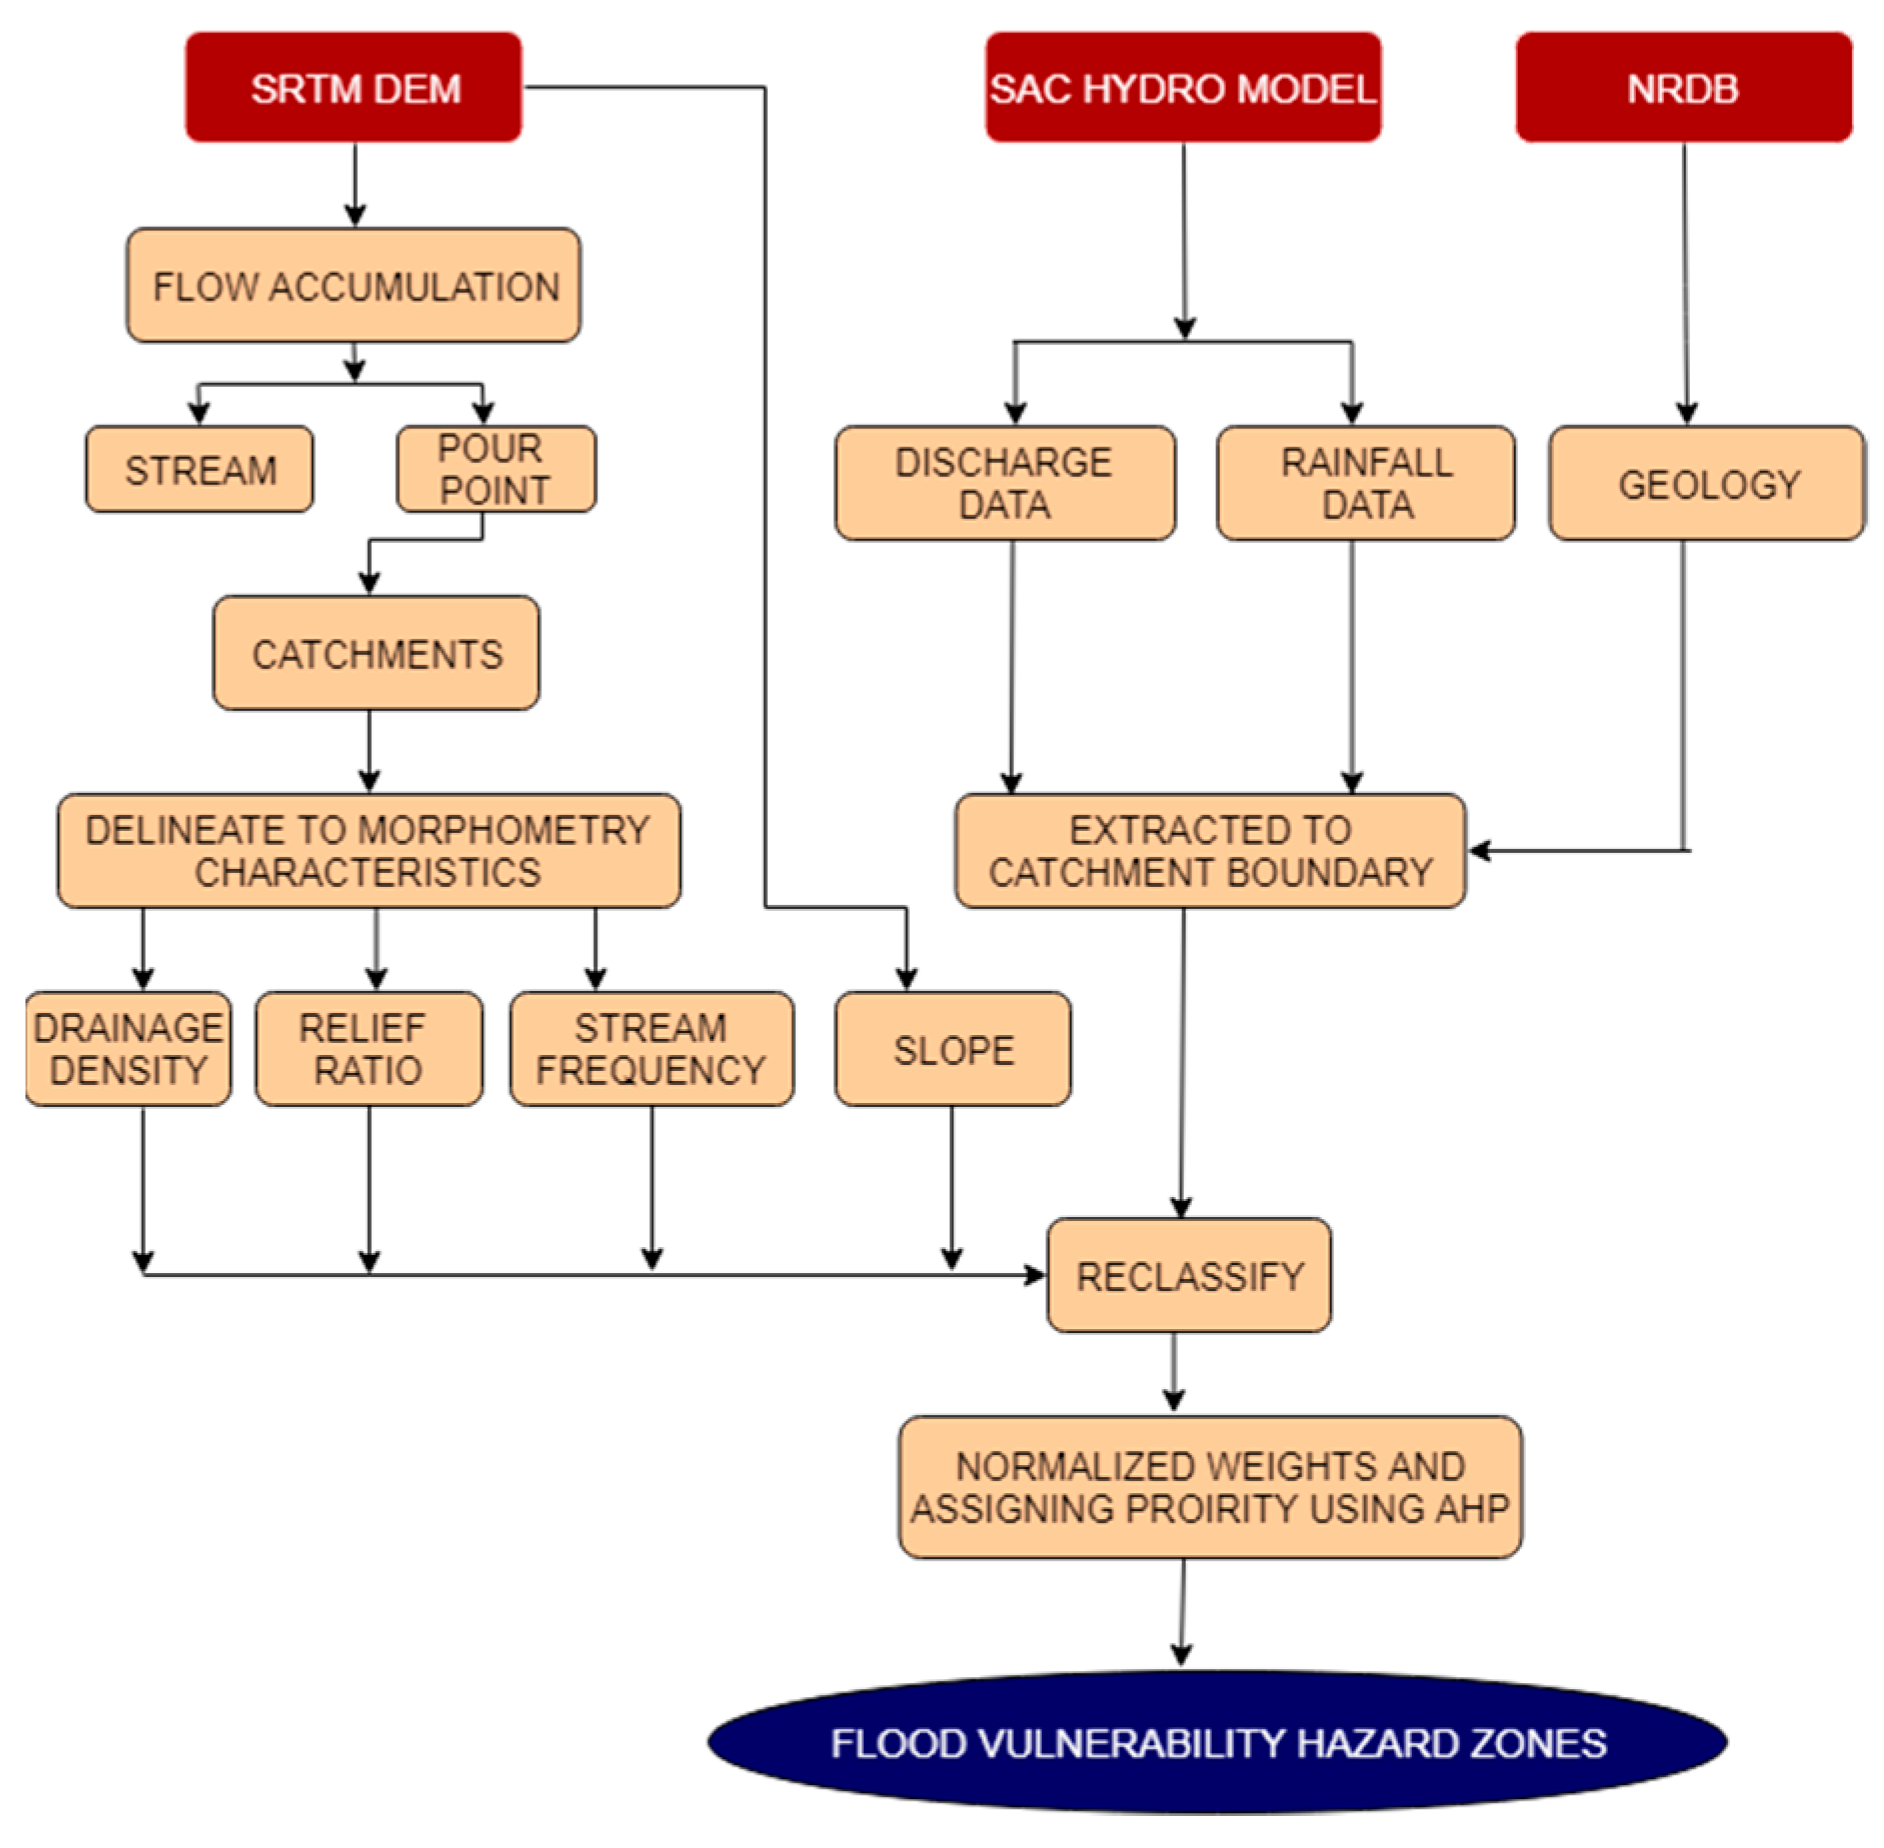
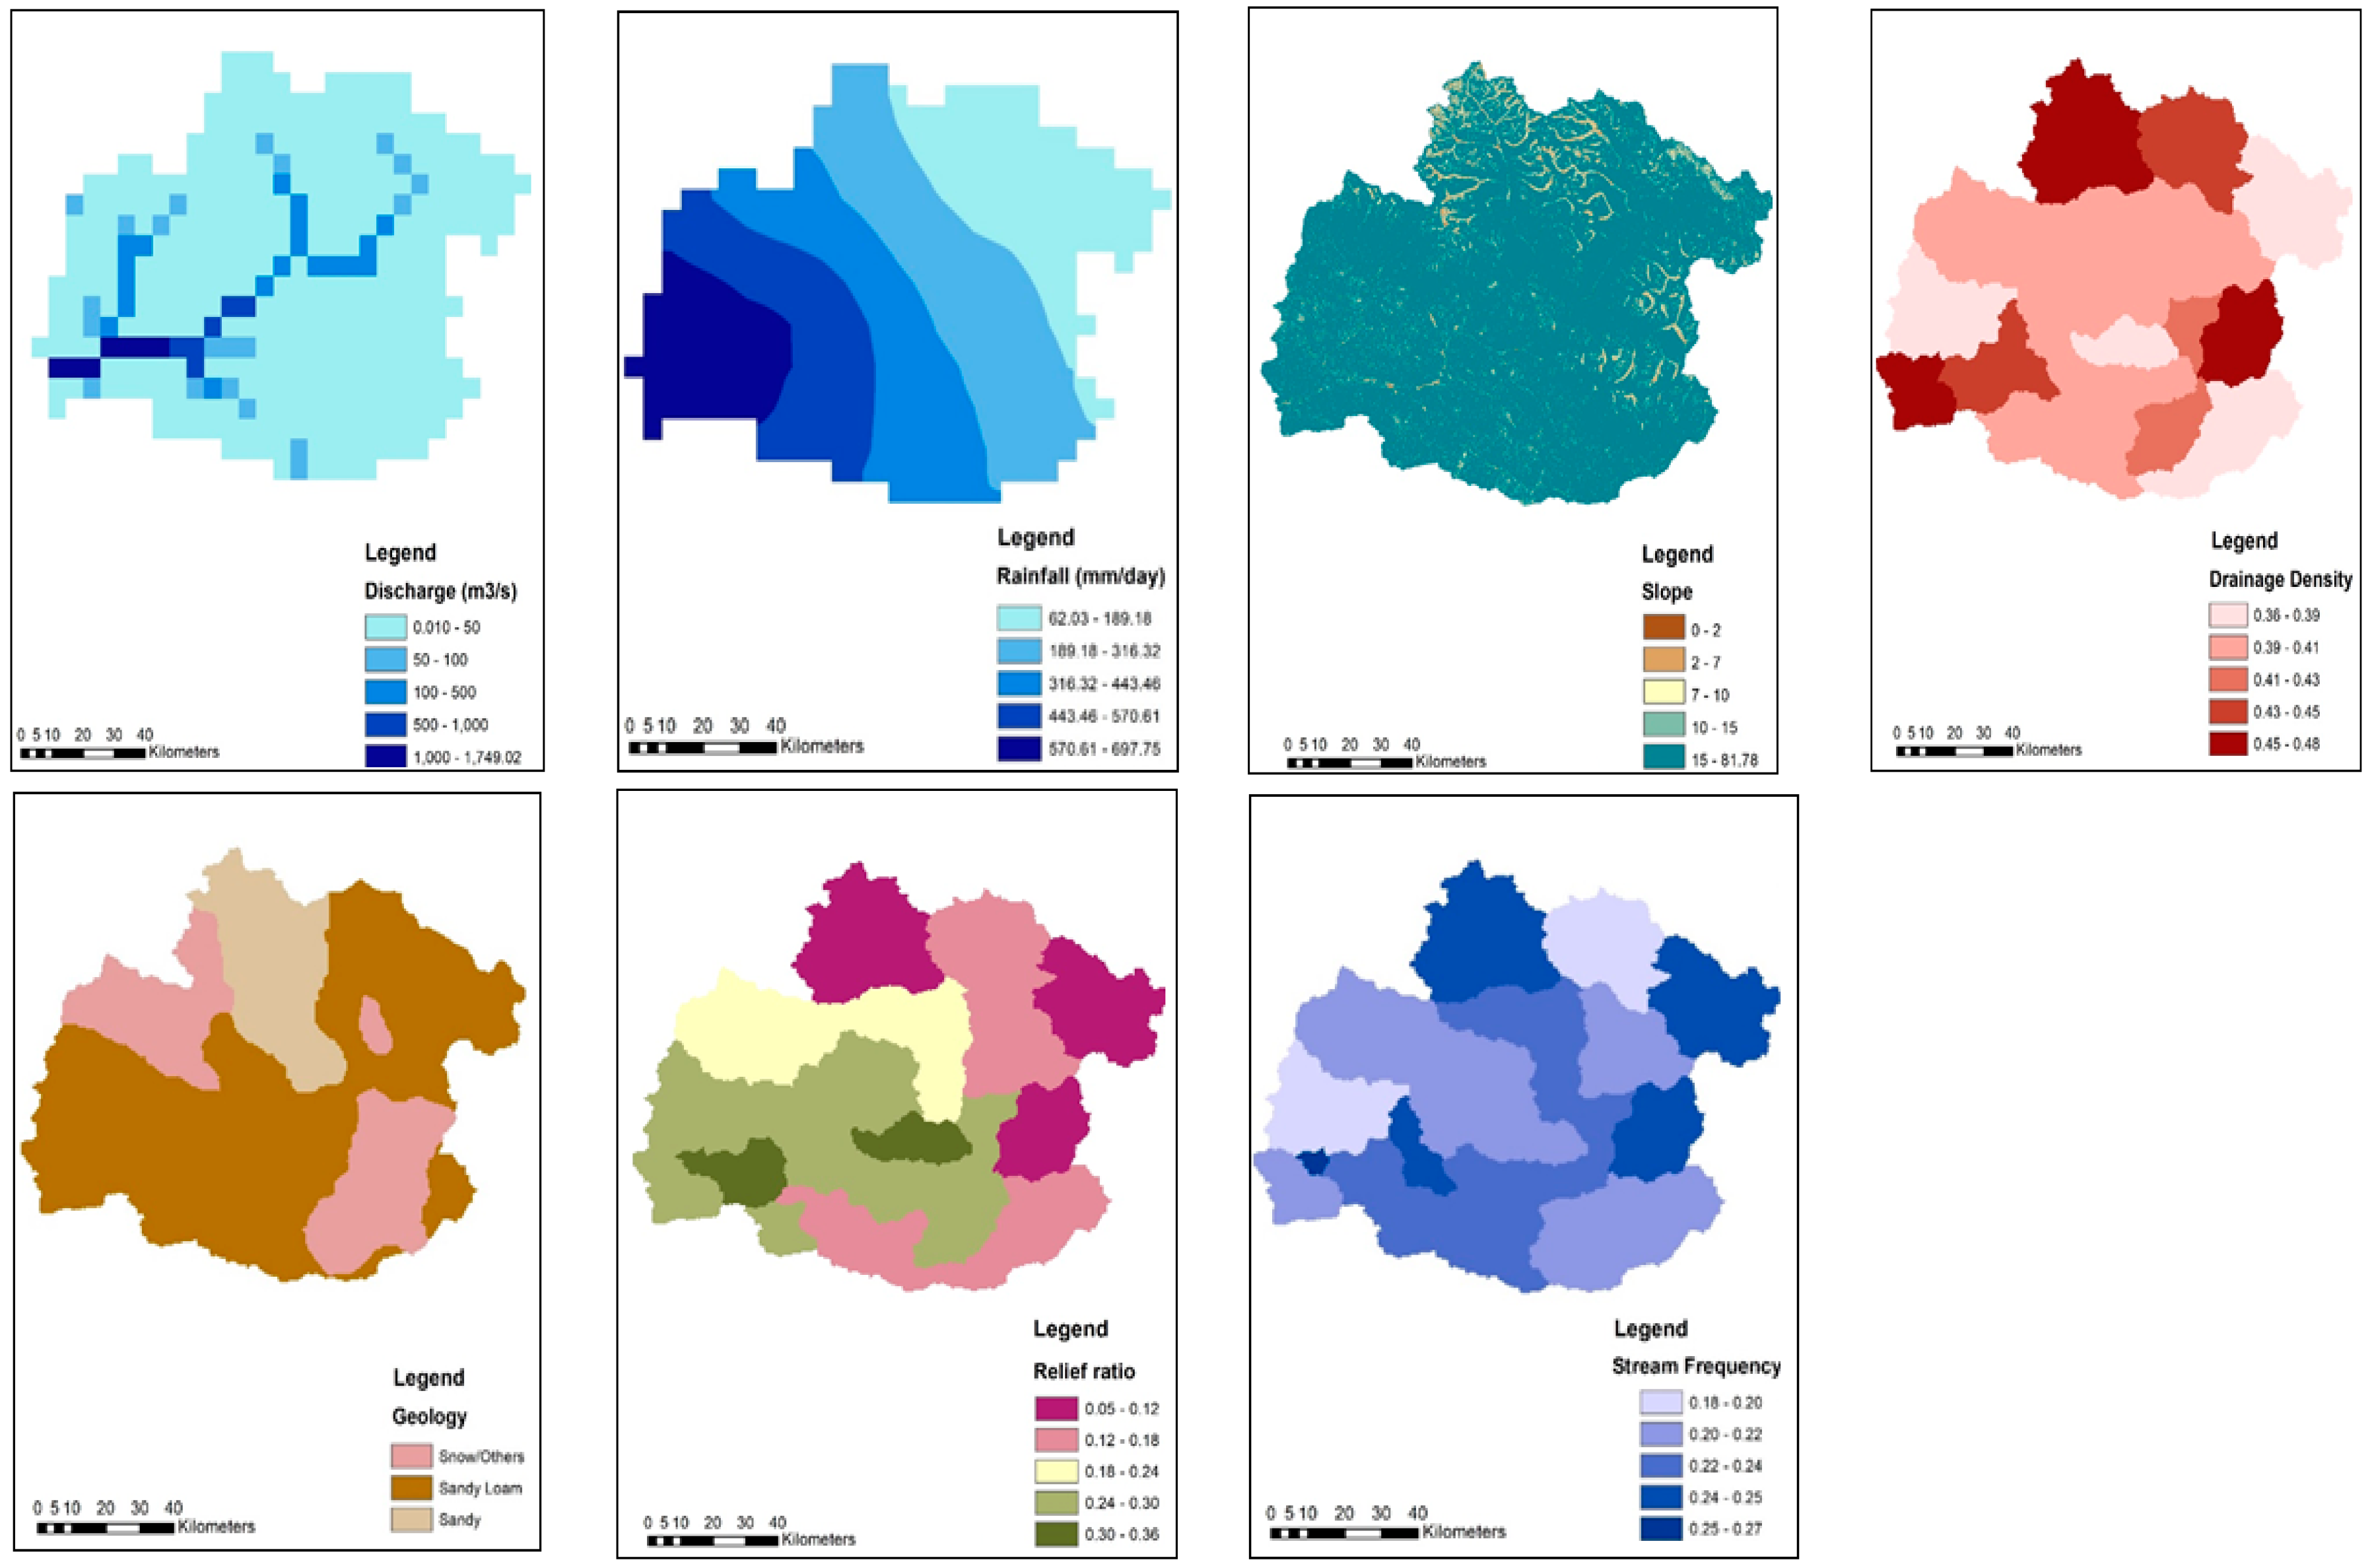
- Analysis of morphometry parameters using shuttle radar topography mission (SRTM) DEM integrated with discharge and rainfall data from SAC hydro model.
- Normalization of these parametric classified values via analytical hierarchy process by assigning priority weight to each parameter.
2. Materials and Methods
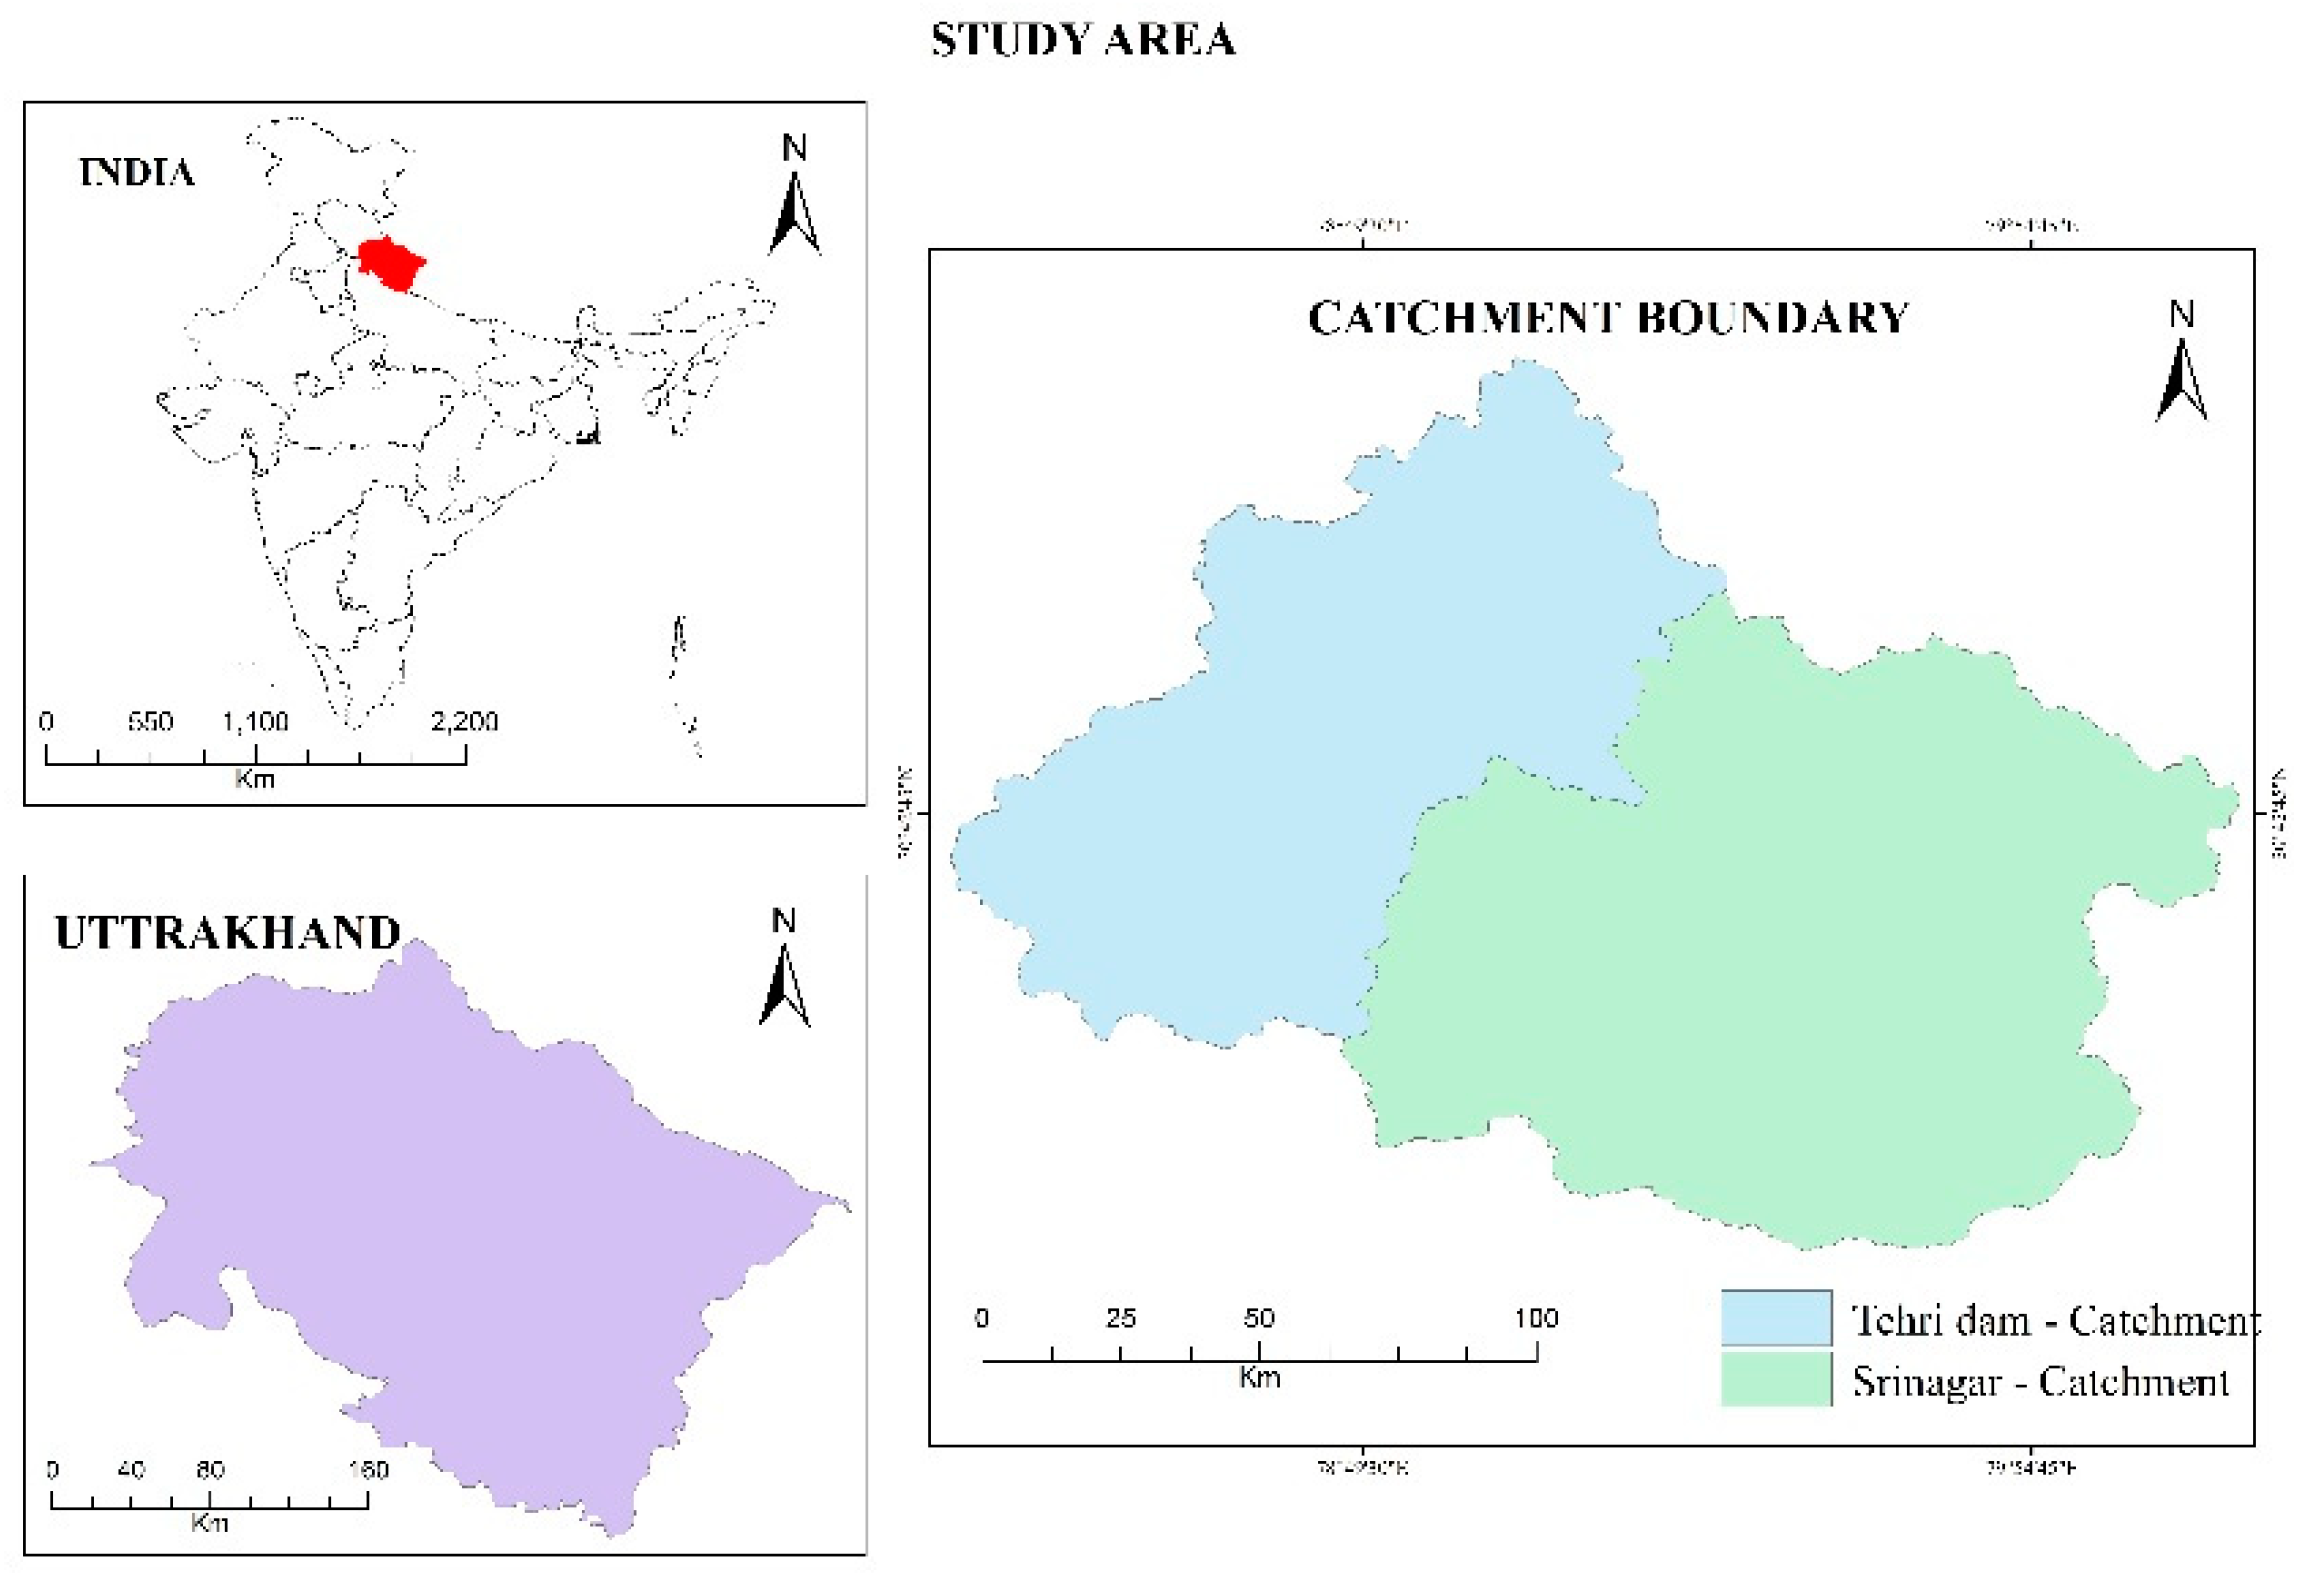
2.1. Study Area
2.2. Datasets
2.3. Methodology
2.3.1. Development of Catchment Morphometry
2.3.2. Analytical Hierarchy Process
3. Results and Discussion
3.1. Pair-Wise Comparison Matrix for Multi-Criteria and Its Consistency
3.2. Consistency Check
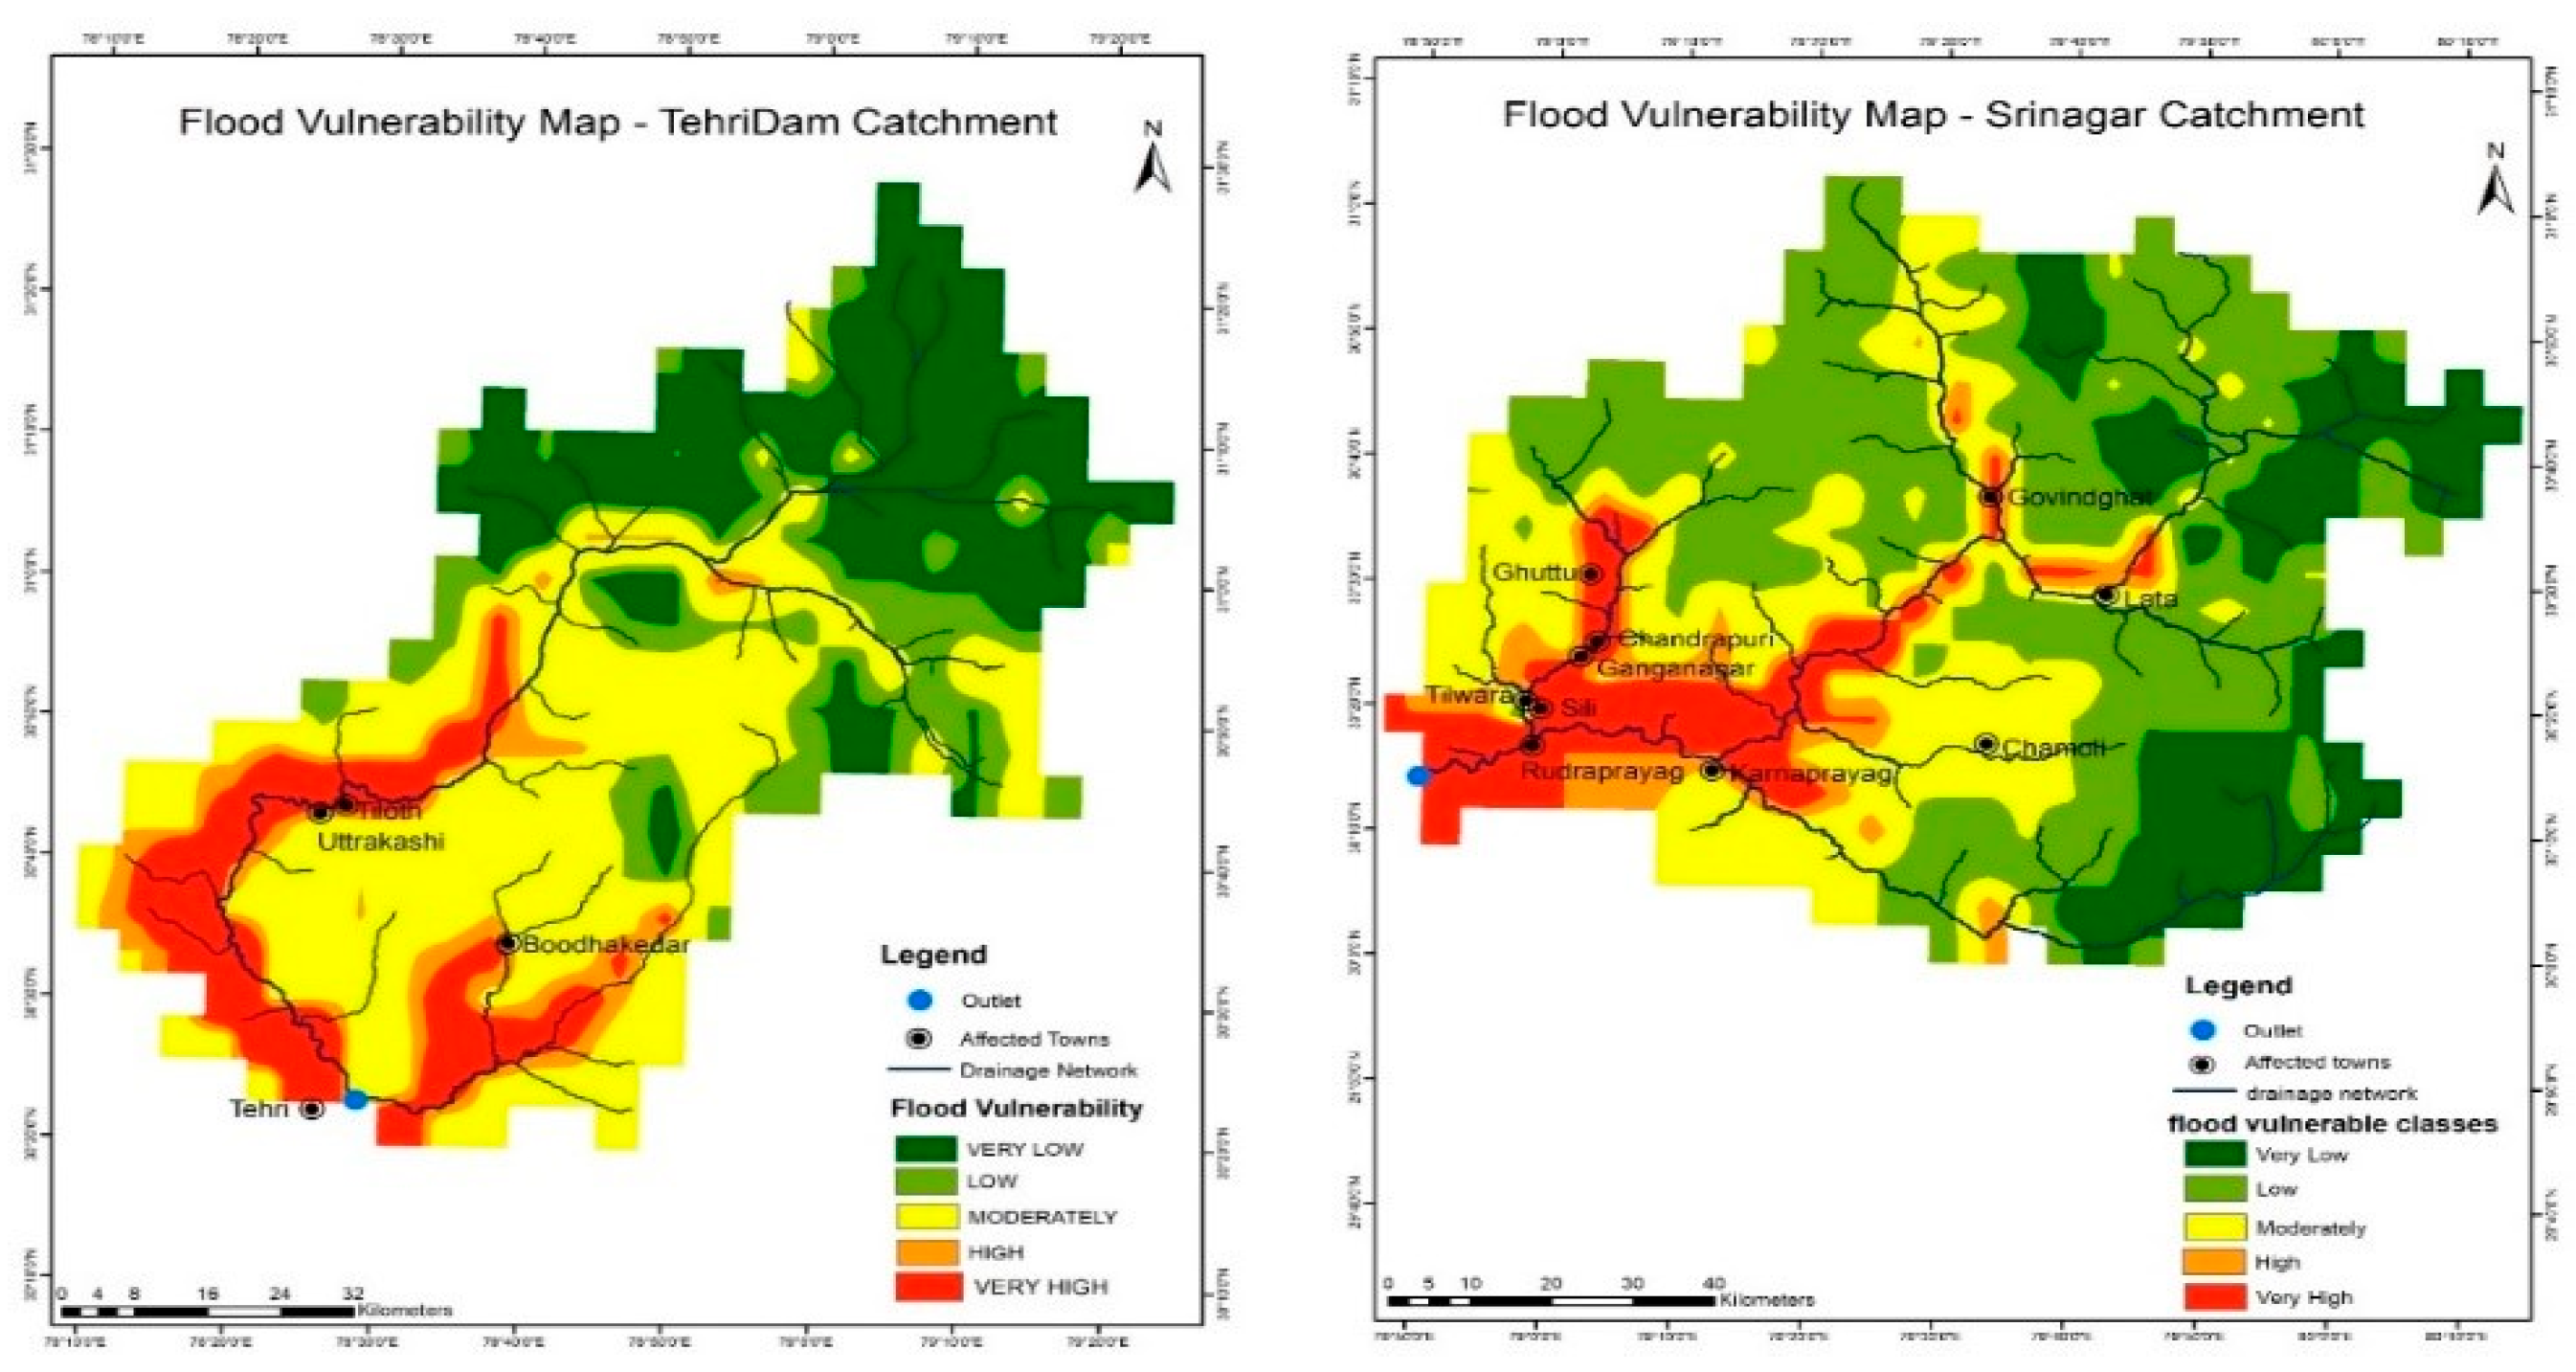
3.3. Flood Hazard Area Estimation
4. Conclusions
Author Contributions
Conflicts of Interest
References
- Sharma, D.D. Floods and Flash Floods in Himachal Pradesh: A Geographical Analysis; NIDM-National Institute of Disaster Management: New Delhi, India, 2006. [Google Scholar]
- Dimri, A.P.; Chevuturi, A.; Niyogi, D.; Thayyen, R.J.; Ray, K.; Tripathi, S.N.; Pandey, A.K.; Mohanty, U.C. Cloudbursts in Indian Himalayas: A review. Earth-Sci. Rev. 2017, 168, 1–23. [Google Scholar] [CrossRef]
- Diakakis, M. A method for flood hazard mapping based on basin morphometry: Application in two catchments in Greece. Nat. Hazards 2010, 56, 803–814. [Google Scholar] [CrossRef]
- Jesuleye, I.A.; Okeke, U.H.; Atijosan, A.O.; Badru, R.A.; Adewoyin, J.E.; Alaga, A.T. Morphometry assessment of Oba River basin and its implications for flood. J. Geogr. Environ. Earth Sci. Int. 2016, 8, 1–10. [Google Scholar] [CrossRef] [PubMed]
- Omran, A.; Schroeder, D.; El-Rayes, A.E.; Geriesh/Griesh, M.H. Flood hazard assessment in Wadi Dahab, Egypt based on basin morphometry using GIS techniques. In Proceedings of the Geoinformatics Forum Salzburg; Herbert Wichmann Verlag: Berlin/Offenbach, Germany, 2011. [Google Scholar] [CrossRef]
- Matori, A.N.; Lawal, D.U.; Yusof, K.W.; Hashim, M.A.; Balogun, A.-L. Spatial analytic hierarchy process model for flood forecasting: An integrated approach. IOP Conf. Ser. Earth Environ. Sci. 2014, 20, 012029. [Google Scholar] [CrossRef]
- Zehra, S.; Afsar, S. Flood hazard mapping of lower indus basin using multi-criteria analysis. J. Geosci. Environ. Prot. 2016, 4, 54–62. [Google Scholar] [CrossRef]
- Samson, S.; Eludoyin, A.; Ogbole, J.; Alaga, A.; Oloko-Oba, M.; Okeke, U.; Popoola, O. Drainage Basin Morphometric Analysis for Flood Potential Mapping in Owu Using Geospatial Techniques. J. Geogr. Environ. Earth Sci. Int. 2016, 4, 1–8. [Google Scholar] [CrossRef] [PubMed]
- Oyatayo, K.T.; Iguisi, E.O.; Sawa, B.A.; Ndabula, C.; Jidauna, G.G.; Iorkua, S.A. Assessment of parametric flood vulnerability pattern of Makurdi Town, Benue State, Nigeria. Conflu. J. Environ. Stud. 2018, 12, 11–28. [Google Scholar]
- Stefanidis, S.; Stathis, D. Assessment of flood hazard based on natural and anthropogenic factors using analytic hierarchy process (AHP). Nat. Hazards 2013, 68, 569–585. [Google Scholar] [CrossRef]
- Lawal, D.U.; Matori, A.N.; Hashim, A.M.; Yusof, K.W.; Chandio, I.A. Detecting flood-susceptible areas using GIS-based analytic hierarchy process. Int. Proc. Chem. Biol. Environ. Eng. 2012, 28, 1–5. [Google Scholar]

| Category | Parameter | Derivation Procedure |
|---|---|---|
| Areal | Drainage Density | DD = ΣL/A; where DD = drainage density, ΣL = sum of all stream lengths, and A = catchment area (Horton 1932) |
| Areal | Stream Frequency | Fs = Nu /A; Fs = stream frequency, Nu = total length of stream, and A = catchment area (Horton, 1945) |
| Relief | Relief Ratio | Rh = H/L; where Rh = relief ratio, H = horizontal distance along the longest dimension in parallel to drainage line, and L = length of the catchment (Schumm, 1956) |
| Parameters | C1 | C2 | C3 | C4 | C5 | C6 | C7 | Mean | Weight (%) |
|---|---|---|---|---|---|---|---|---|---|
| C1 | 0.53 | 0.72 | 0.64 | 0.42 | 0.48 | 0.36 | 0.33 | 0.50 | 50 |
| C2 | 0.07 | 0.09 | 0.16 | 0.17 | 0.14 | 0.18 | 0.17 | 0.14 | 14 |
| C3 | 0.07 | 0.05 | 0.08 | 0.17 | 0.14 | 0.18 | 0.21 | 0.13 | 13 |
| C4 | 0.11 | 0.05 | 0.04 | 0.08 | 0.10 | 0.09 | 0.08 | 0.08 | 8 |
| C5 | 0.08 | 0.05 | 0.04 | 0.06 | 0.07 | 0.09 | 0.08 | 0.07 | 7 |
| C6 | 0.09 | 0.03 | 0.03 | 0.06 | 0.05 | 0.06 | 0.08 | 0.06 | 6 |
| C7 | 0.07 | 0.02 | 0.02 | 0.04 | 0.03 | 0.03 | 0.04 | 0.04 | 4 |
| n | 1 | 2 | 3 | 4 | 5 | 6 | 7 | 8 | 9 |
|---|---|---|---|---|---|---|---|---|---|
| RI | 0.00 | 0.00 | 0.58 | 0.90 | 1.12 | 1.24 | 1.32 | 1.41 | 1.45 |
| Factor | Tehri Dam Catchment | Srinagar Catchment | Weight | ||
|---|---|---|---|---|---|
| Criteria | Index | Criteria | Index | ||
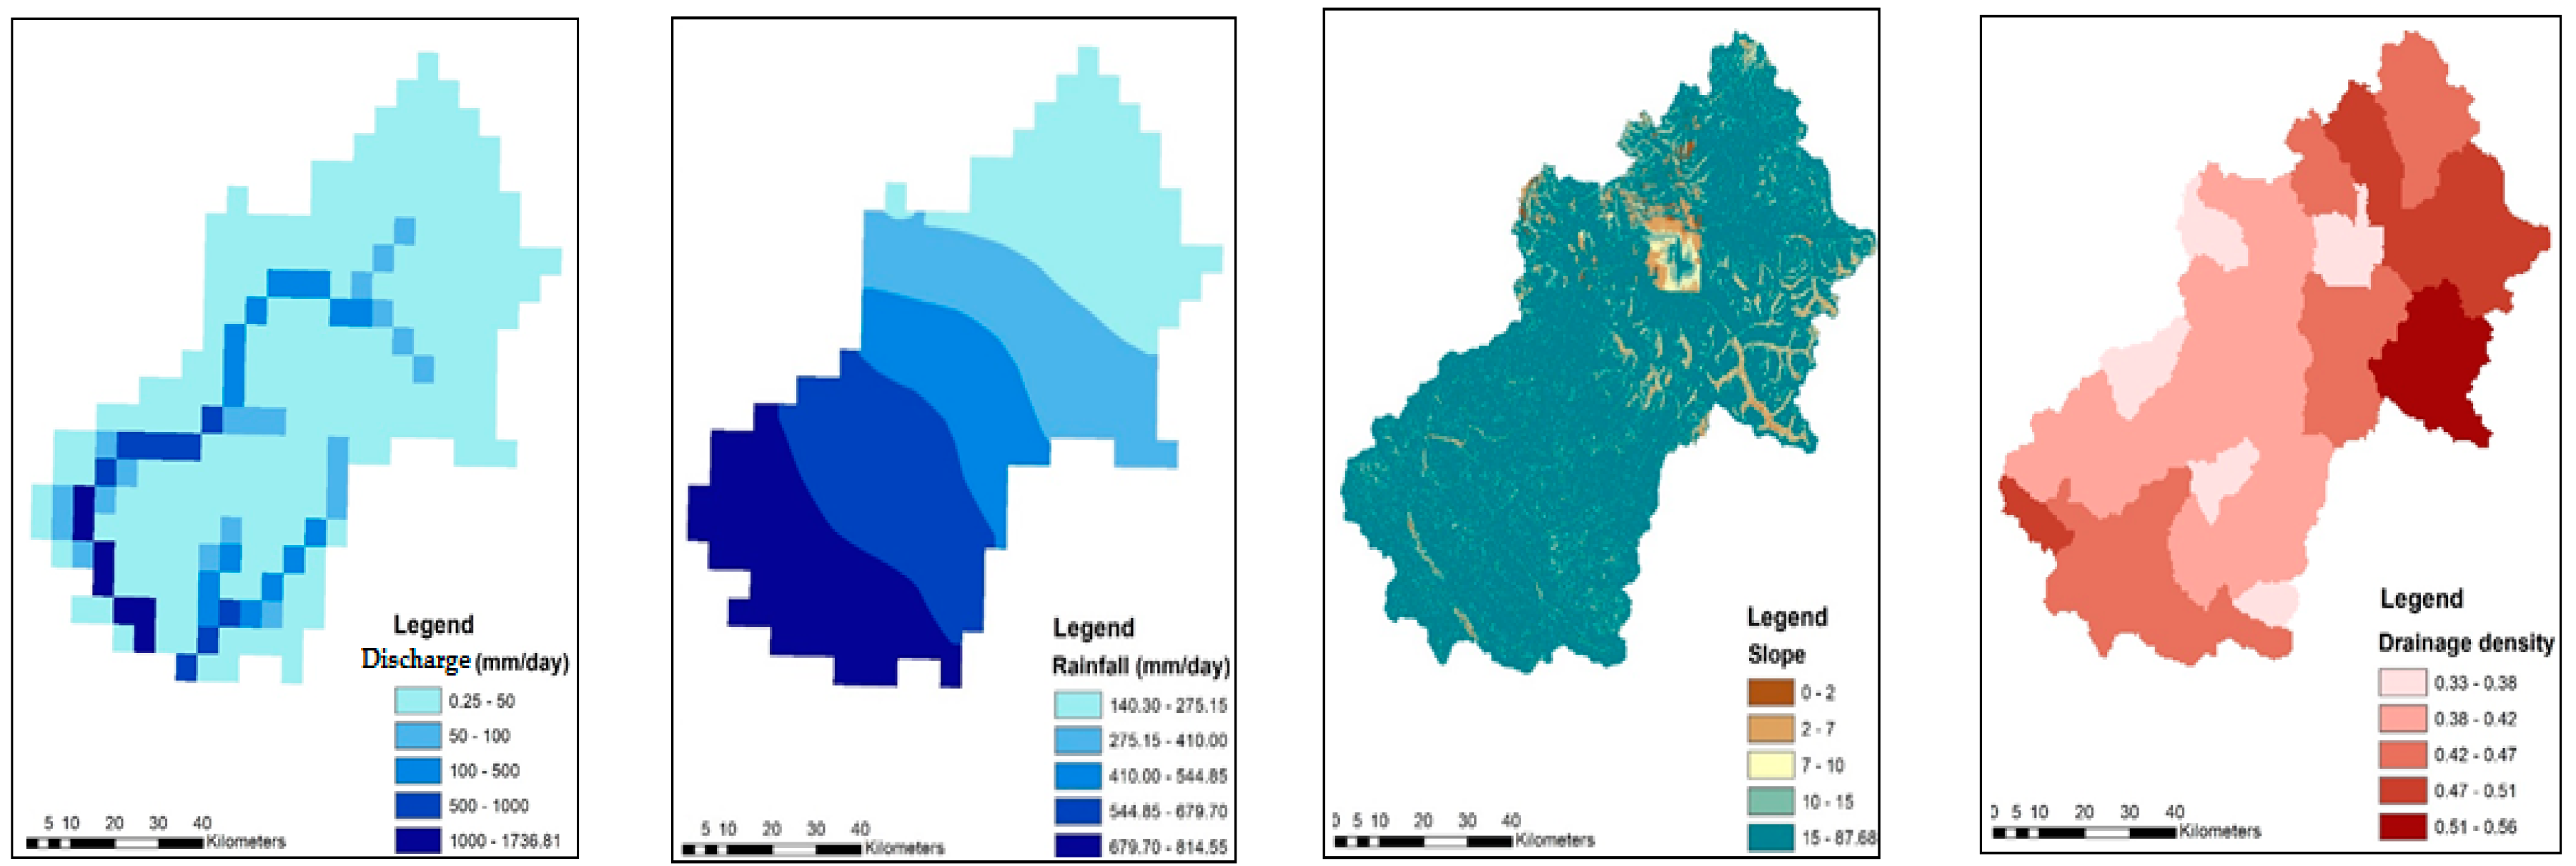
| Discharge (m3/s) | 0.01–50 | 0.05 | 0.25–50 | 0.05 | 50% |
| 50–100 | 0.09 | 50–100 | 0.10 | ||
| 100–500 | 0.16 | 100–500 | 0.13 | ||
| 500–1000 | 0.26 | 500–1000 | 0.28 | ||
| 1000–1749.02 | 0.45 | 1000–1736.81 | 0.44 | ||
| Rainfall (mm/day) | 62–189 | 0.04 | 140.3–275.15 | 0.05 | 14% |
| 189–316 | 0.09 | 275.15–410 | 0.11 | ||
| 316–443 | 0.15 | 410–544.85 | 0.16 | ||
| 443–570 | 0.31 | 544.85–679.7 | 0.29 | ||
| 570–697 | 0.40 | 679.7–814.5 | 0.40 | ||
| Slope (%) | 0–2 | 0.43 | 0–2 | 0.45 | 13% |
| 2–7 | 0.28 | 2–7 | 0.27 | ||
| 7–10 | 0.15 | 7–10 | 0.15 | ||
| 10–15 | 0.09 | 10–15 | 0.09 | ||
| 15–81.76 | 0.05 | 15–87.56 | 0.05 | ||
| Drainage Density | 0.36–0.39 | 0.05 | 0.34–0.38 | 0.05 | 8% |
| 0.39–0.41 | 0.10 | 0.38–0.43 | 0.12 | ||
| 0.41–0.43 | 0.18 | 0.43–0.47 | 0.15 | ||
| 0.43–0.45 | 0.24 | 0.47–0.52 | 0.26 | ||
| 0.45–0.48 | 0.43 | 0.52–0.56 | 0.42 | ||
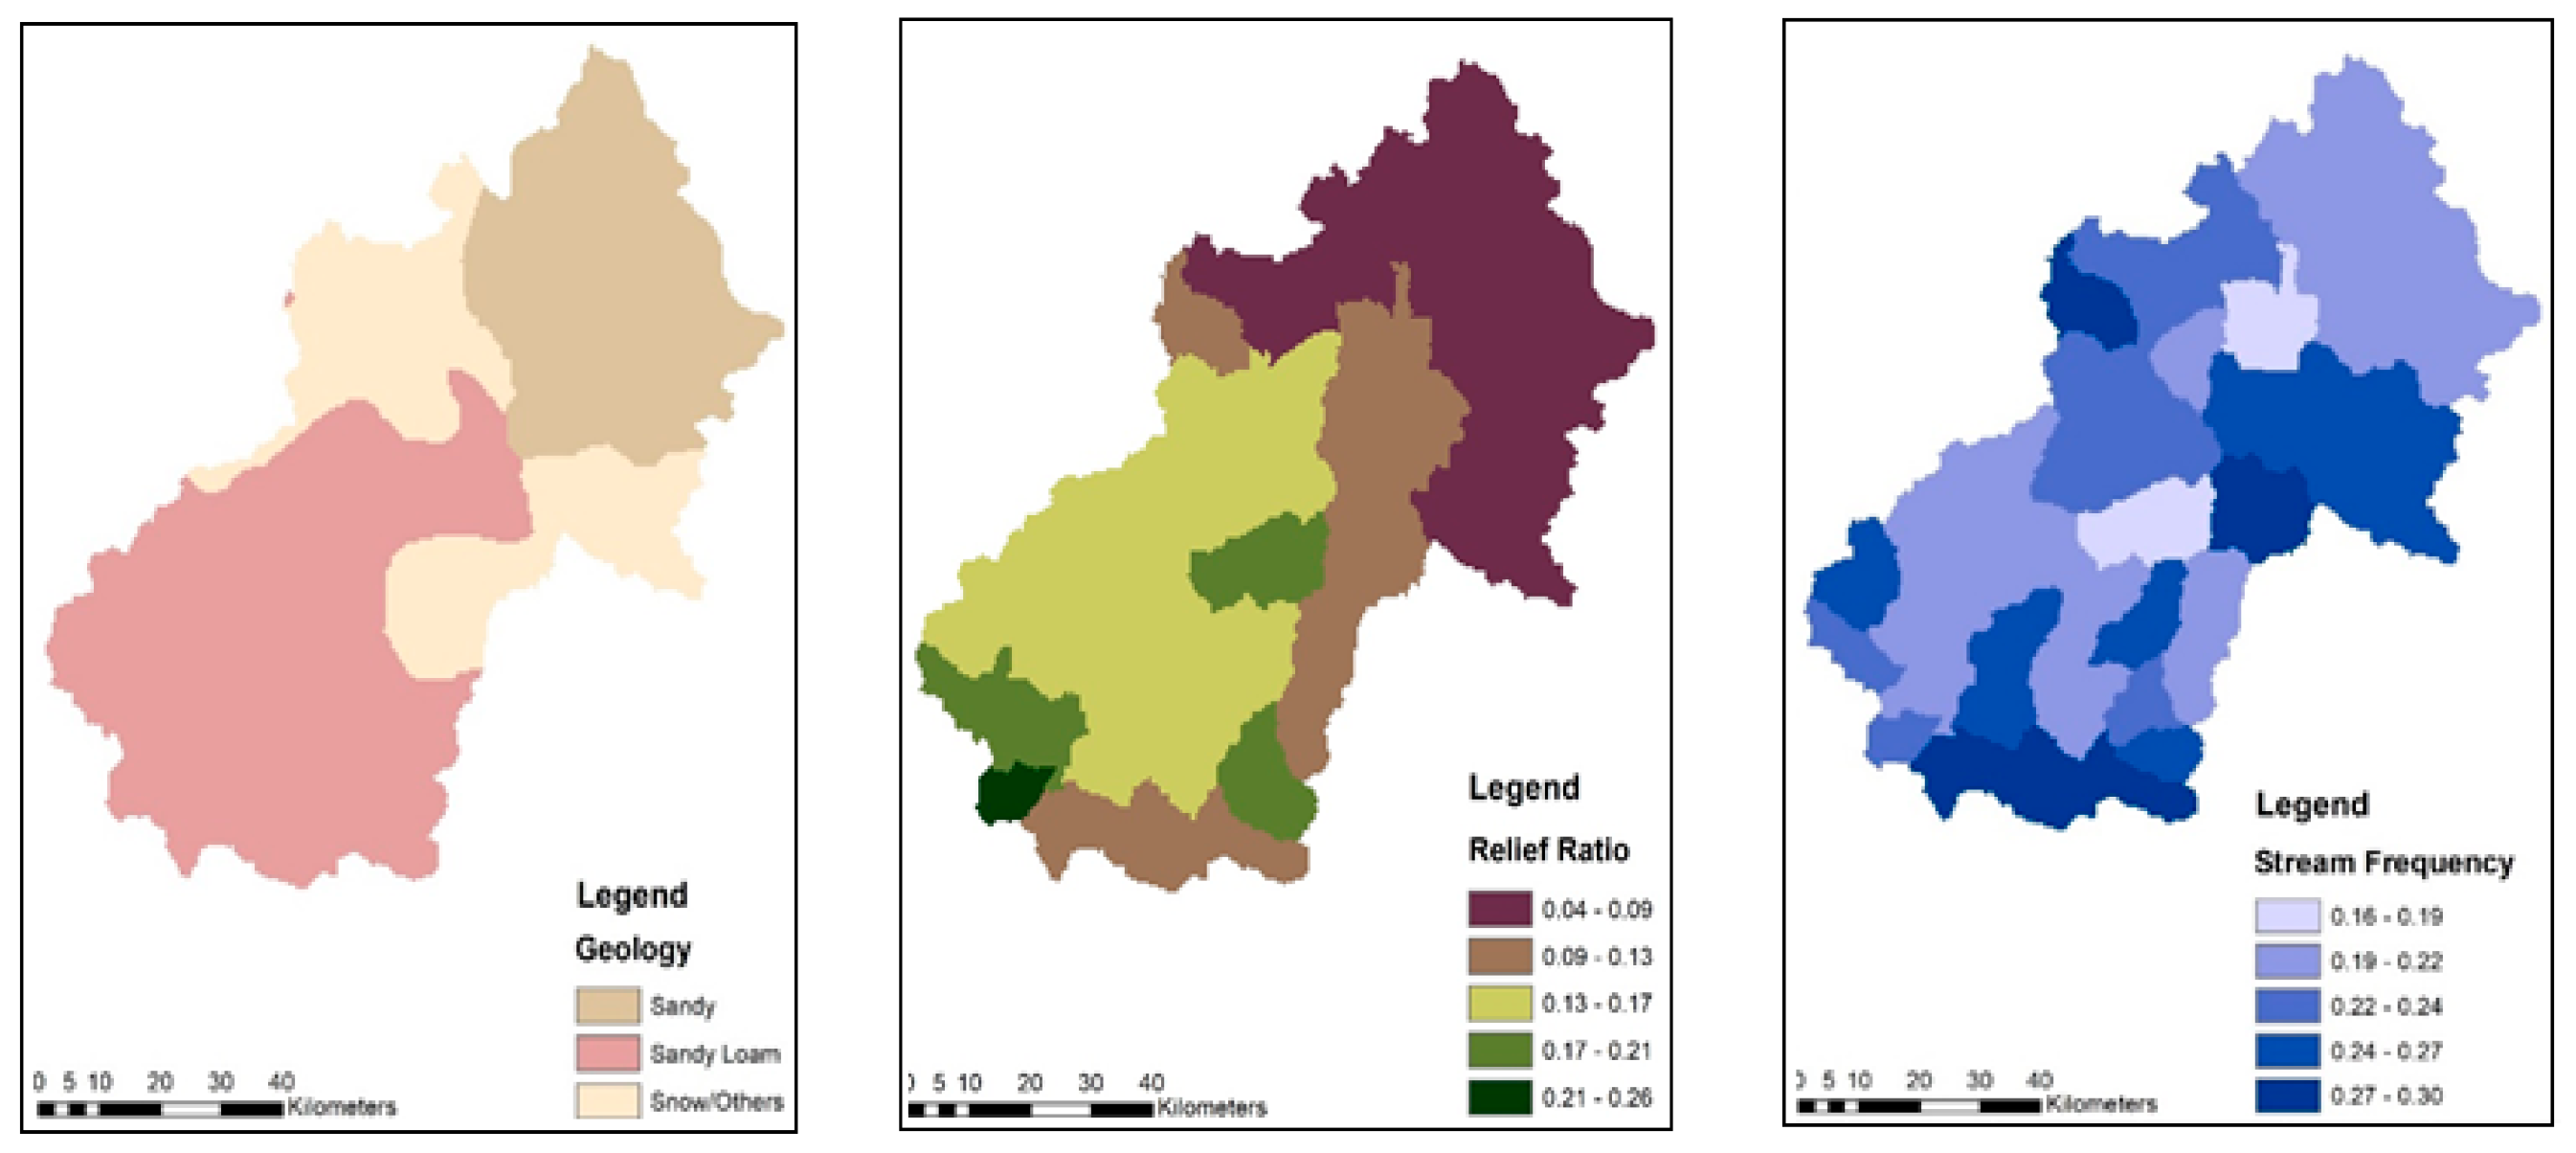
| Geology | Sandy Loam | 0.66 | Sandy | 0.66 | 7% |
| Sandy | 0.22 | Sandy Loam | 0.22 | ||
| Snow/other | 0.12 | Snow/other | 0.12 | ||
| Relief Ratio | 0.05–0.12 | 0.43 | 0.04–0.09 | 0.43 | 6% |
| 0.12–0.18 | 0.29 | 0.09–0.13 | 0.28 | ||
| 0.18–0.24 | 0.15 | 0.13–0.17 | 0.16 | ||
| 0.24–0.30 | 0.08 | 0.17–0.21 | 0.08 | ||
| 0.30–0.36 | 0.05 | 0.21–0.26 | 0.05 | ||
| Stream Frequency | 0.18–0.20 | 0.05 | 0.16–0.19 | 0.05 | 4% |
| 0.20–0.22 | 0.10 | 0.19–0.22 | 0.10 | ||
| 0.22–0.24 | 0.19 | 0.22–0.25 | 0.19 | ||
| 0.24–0.25 | 0.26 | 0.25–0.27 | 0.25 | ||
| 0.25–0.27 | 0.41 | 0.27–0.30 | 0.40 | ||
| Vulnerable Class | Tehri Dam Catchment | Srinagar Catchment | ||
|---|---|---|---|---|
| Area (km2) Total Area = 7294.78 km | Area (%) | Area (km2) Total Area = 10,554 km | Area (%) | |
| Very Low | 2000.24 | 30% | 1775.52 | 18% |
| Low | 800.1 | 12% | 3875.47 | 40% |
| Moderate | 2775.34 | 41% | 2450.30 | 25% |
| High | 425.05 | 6% | 525.06 | 5% |
| Very High | 750.09 | 11% | 1050.13 | 11% |
Publisher’s Note: MDPI stays neutral with regard to jurisdictional claims in published maps and institutional affiliations. |
© 2019 by the authors. Licensee MDPI, Basel, Switzerland. This article is an open access article distributed under the terms and conditions of the Creative Commons Attribution (CC BY) license (https://creativecommons.org/licenses/by/4.0/).
Share and Cite
Sivashankari, V.; Dubey, A.K.; Priyadarshini, K.N.; Shekhar, S. Integrated Hydrological Modelling over Upstream Catchments of Himalayan Rivers and Assessment of Hydrological Events in Tehri Dam and Srinagar Catchments. Proceedings 2019, 24, 13. https://doi.org/10.3390/IECG2019-06210
Sivashankari V, Dubey AK, Priyadarshini KN, Shekhar S. Integrated Hydrological Modelling over Upstream Catchments of Himalayan Rivers and Assessment of Hydrological Events in Tehri Dam and Srinagar Catchments. Proceedings. 2019; 24(1):13. https://doi.org/10.3390/IECG2019-06210
Chicago/Turabian StyleSivashankari, V., Amit Kumar Dubey, K. Nivedita Priyadarshini, and Sulochana Shekhar. 2019. "Integrated Hydrological Modelling over Upstream Catchments of Himalayan Rivers and Assessment of Hydrological Events in Tehri Dam and Srinagar Catchments" Proceedings 24, no. 1: 13. https://doi.org/10.3390/IECG2019-06210
APA StyleSivashankari, V., Dubey, A. K., Priyadarshini, K. N., & Shekhar, S. (2019). Integrated Hydrological Modelling over Upstream Catchments of Himalayan Rivers and Assessment of Hydrological Events in Tehri Dam and Srinagar Catchments. Proceedings, 24(1), 13. https://doi.org/10.3390/IECG2019-06210