Proceeding Paper

Blast Wave Assessment in a Compound Survival Container: Small-Scale Testing †

1
Civil and Materials Engineering Department, Royal Military Academy, 1000 Brussels, Belgium
2
School of Engineering, The University of Edinburgh, Edinburgh EH9 3JL, UK
*
Author to whom correspondence should be addressed.
Presented at the 18th International Conference on Experimental Mechanics (ICEM18), Brussels, Belgium, 1–5 July 2018.
Proceedings 2018, 2(8), 540; https://doi.org/10.3390/ICEM18-05459
Published: 23 July 2018
(This article belongs to the Proceedings of The 18th International Conference on Experimental Mechanics)

Abstract

:
Propagation of shock waves in partially- or fully-confined environments is a complex phenomenon due to the possibility of multiple reflections, diffractions and superposition of waves. In a military context, the study of such phenomena is of extreme relevance to the evaluation of protection systems, such as survival containers, for personnel and equipment. True scale testing of such structures is costly and time consuming but small-scale models in combination with the Hopkinson-Cranz scaling laws are a viable alternative. This paper combines the use of a small-scale model of a compound survival container with finite element analysis (with LS-DYNA) to develop and validate a numerical model of the blast wave propagation. The first part of the study details the experimental set-up, consisting of a small-scale model of a survival container, which is loaded by the detonation of a scaled explosive charge. The pressure-time histories are recorded in several locations of the model. The second part of the study presents the numerical results and a comparison with the experimental data.

1. Introduction

In military mission compounds, the security of both personnel and equipment is of major importance for the success of military operations. A problem of interest to the military community is the behaviour of protective shelters used in the battlefield. These structures are exposed to different threats, such as rockets, personnel borne IED (Improvised Explosive Devices) or even VBIED (Vehicle Borne Improvised Explosive Devices). The shelter used in this study is based on the 20ft ISO container and the Hesco-Bastion gabions defining a protective barrier.
Full-scale experiments usually involve working in restricted areas due to the high-pressure levels produced. Small-scale tests are, however, a convenient way to reproduce the effects of an explosion in laboratory conditions using the Hopkinson-Cranz scaling law [1], which states that self-similar blast waves are produced at identical scaled distances when two explosive charges of similar geometry and of the same explosive, albeit of different sizes, are detonated in the same atmosphere. It is usual to use the following dimensional parameter as the scaled distance,
Z = S O F F W 3
where SOFF is the stand-off distance and W is the mass of high-explosive.
Confined environments (e.g., tunnels [2] and closed spaces [3]) and semi-confined scenarios (e.g., urban areas [4]) have been studied in literature in the current context. Lecompte et al. [4] dedicated their study to the evaluation of a modular building-block system (commercially available building blocks) for the reproduction of urban type configurations. Their results have shown that the modular building system is a rapid tool to build small-scale models. In some of their tests, however, detachment of the inter-brick connections has occured and the assumption of rigid walls was no longer valid. By contrast, the experimental method proposed here was developed to prevent the detachment of its connections.
This paper presents a small-scale model of the compound survival container to analyse the blast wave propagation in this kind of confined environment.

2. Experimental Set-Up

Based on the scaling laws described above, the experimental set-up was designed to have a geometrical reduction factor of 10 across all dimensions. The experimental study was performed in two different charge locations, at 1 and 0.5 m from the entrance (as shown in Figure 1a), along an angle of incidence of 45° relative to the entrance of the shelter model. The whole structure was built from plywood plates. The assumption that the model is rigid was considered, which means that the model does not deform under the action of applied loads. Figure 1b shows the inside of the model. The ISO container is situated at the centre of the shelter.
In the battlefield, compound survival containers may be subjected to impact from the detonation of mortars on the ground. The total mass of the explosive based on the scaling laws is estimated to be 6.4 g of TNT equivalent. This is the full-scale equivalent to the detonation of a 122 mm 9M22 rocket (approximately 6.4 kg of TNT). Given a combined pressure/impulse equivalent TNT conversion factor of 1.28 [5], a spherical charge of 4.2 g of explosive (C4) was used in all experiments. Its ignition was ensured by a M75 electrical detonator, which contains approximately 1 g of TNT equivalent.
To study this type of threat, the charge was located above on the surface of the model, equivalent to a hemispherical surface burst. This results in a contact detonation and to avoid excessive damage at that location a support system was developed and positioned underneath the model. An undesirable consequence of this is that a part of the generated blast wave is propagated below the set-up. To quantify the incident pressure generated by the shock wave that reaches the shelter, a blast pencil was positioned 30 cm from the charge and to allow for an estimation of the charge. The pressure measurements indicated a mass of explosive of 3.3 g of TNT equivalent. This equivalency is based on the incident pressure and the stand-off distance, and was calculated in accordance to TM5-855-1 empirical formulae for surface burst conditions [6].
Three tests (repetitions) were performed under identical conditions to assess the stability of the proposed experimental set-up and the reproducibility of the measured pressure profiles. Twenty dynamic PCB pressure sensors (type 102B15, shown in Figure 2a,b) were used to record the pressure profiles.

3. Numerical Modelling

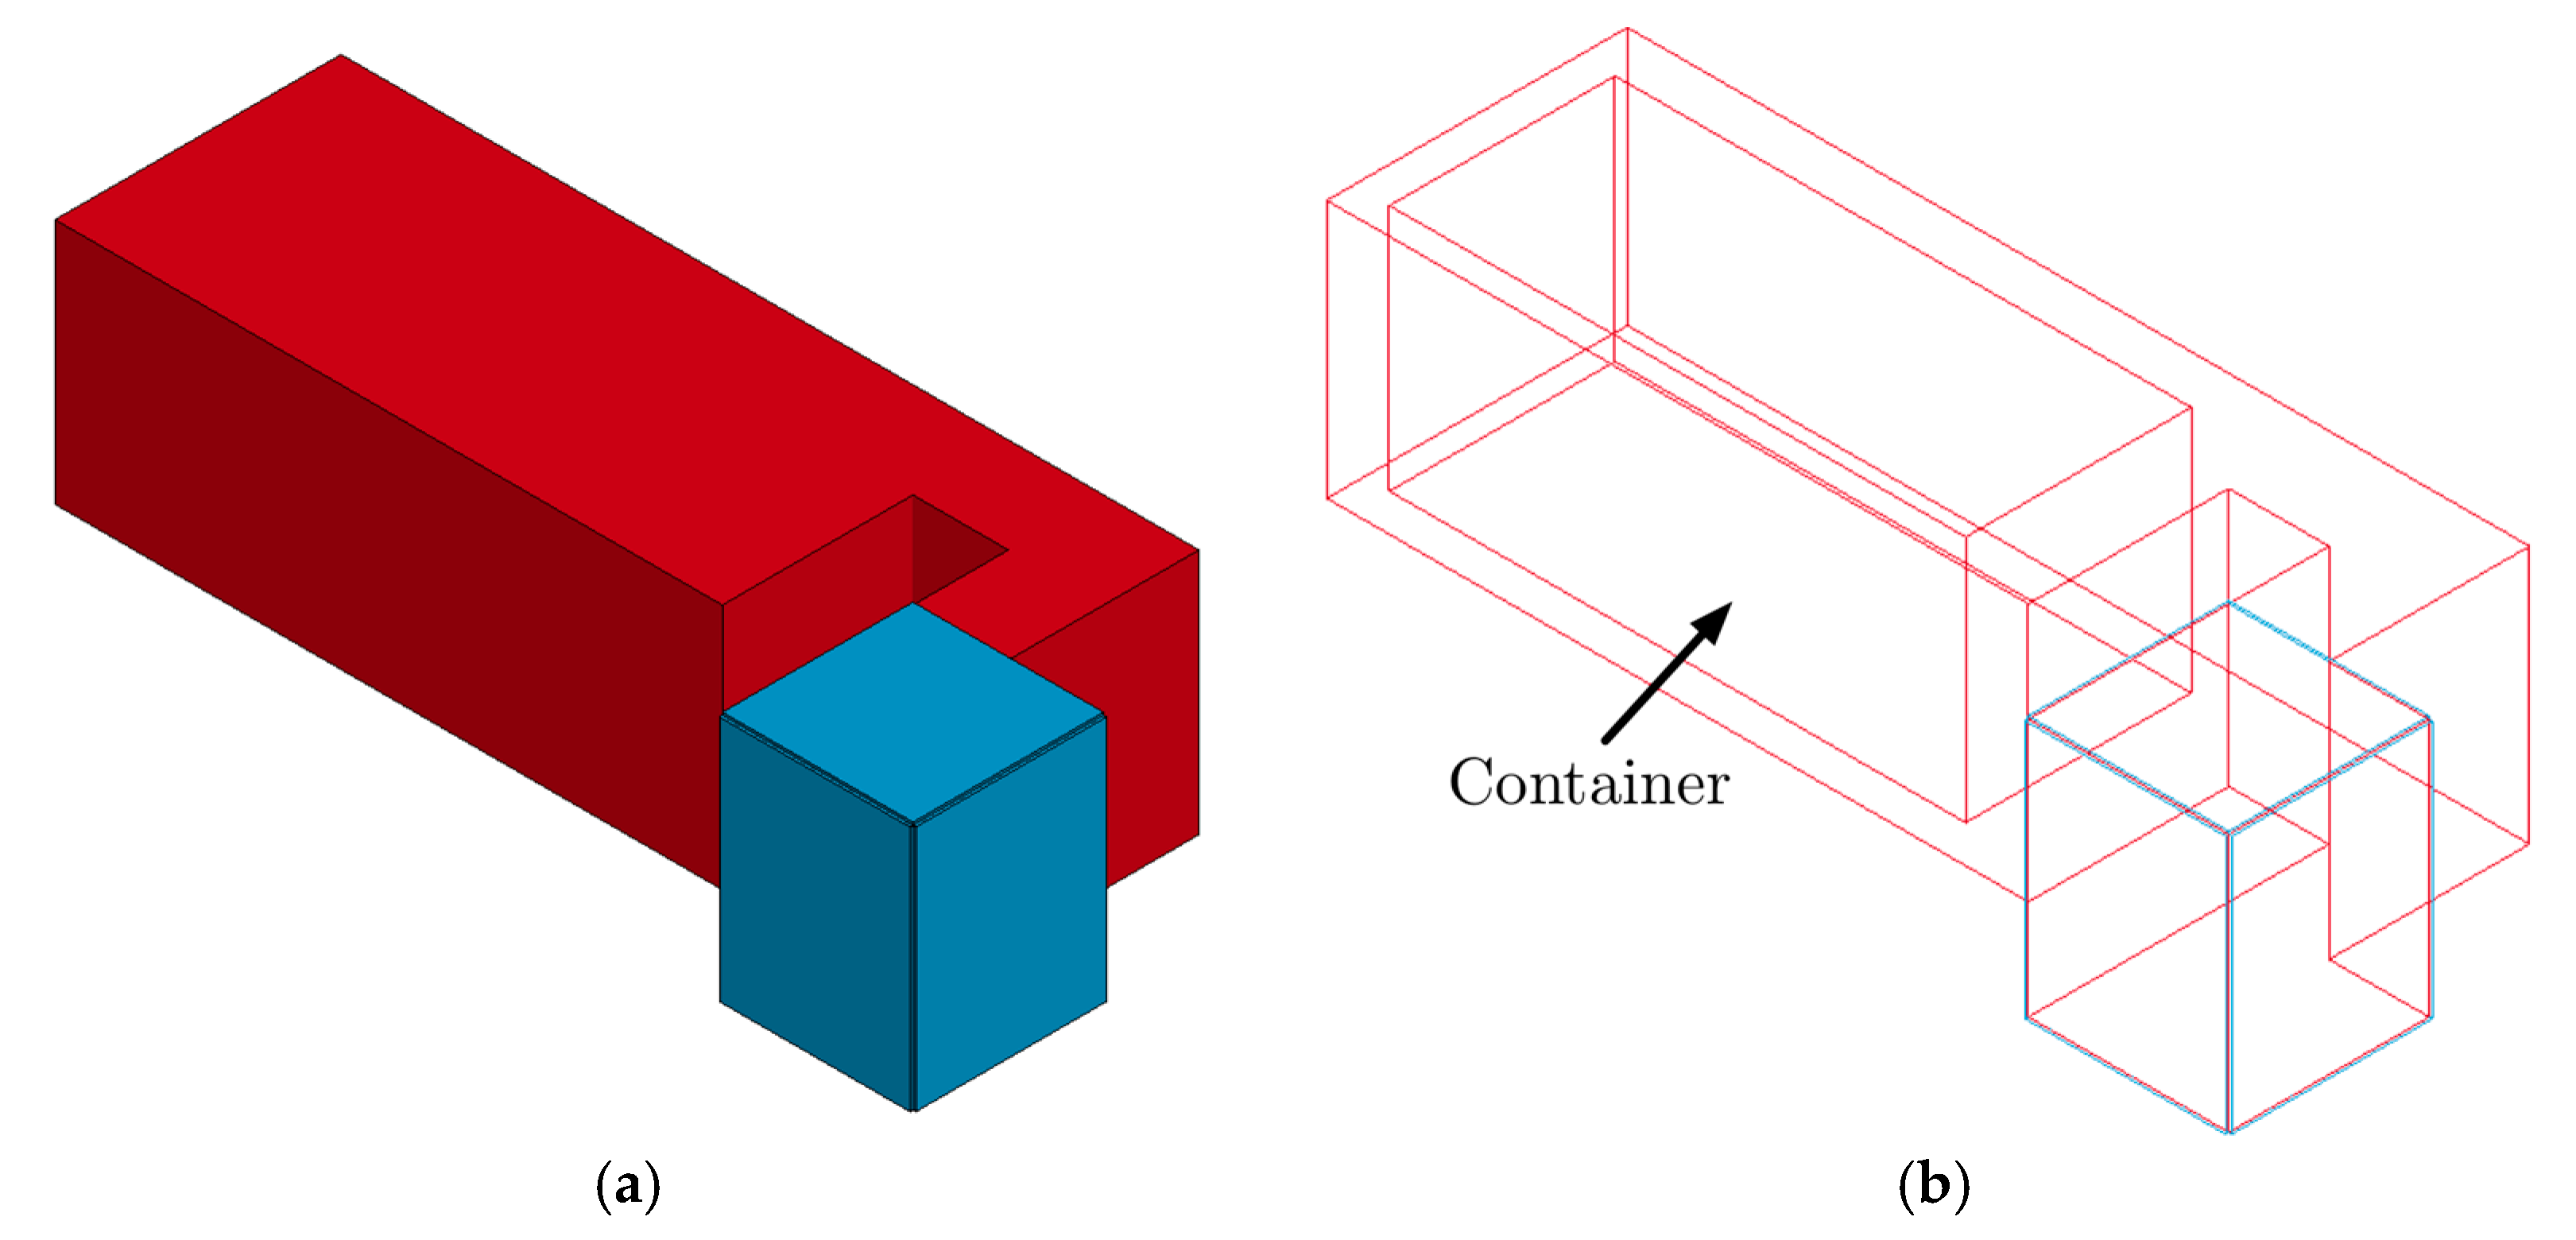
A method widely known to model the response of structures subjected to blast loads is the coupled method [7], which is also used in this work. This method only models the surrounding air domain. Instead of modelling the explosive charge and its detonation, an empirical blast pressure is applied on a single element layer, referred to as the ambient layer (in blue in Figure 3). This method is implemented in LS-DYNA through the keyword *LOAD_BLAST_ENHANCED, where the relative location and mass of the explosive charge are defined. An ALE mesh was created to model the air domain inside the shelter. Since the walls of the shelter and the container are assumed to be rigid, both were modelled by restraining the corresponding boundary nodes of the air domain. This approach results in an efficient computational model because a part of the air domain between the detonation and the structure is not explicitly considered. Tracer points were implemented at the location of the pressure sensors to validate the numerical model.
Since the coupled method allows to model the air domain alone, the numerical model can be described through a single constitutive equation and equation of state. The air was modelled using the material type *MAT_NULL, where the density of the fluid is defined, and a linear-polynomial equation of state (*EOS_LINEAR_POLYNOMIAL) was used to define the pressure properties of the air. The material properties are listed in Table 1.

4. Results and Discussion

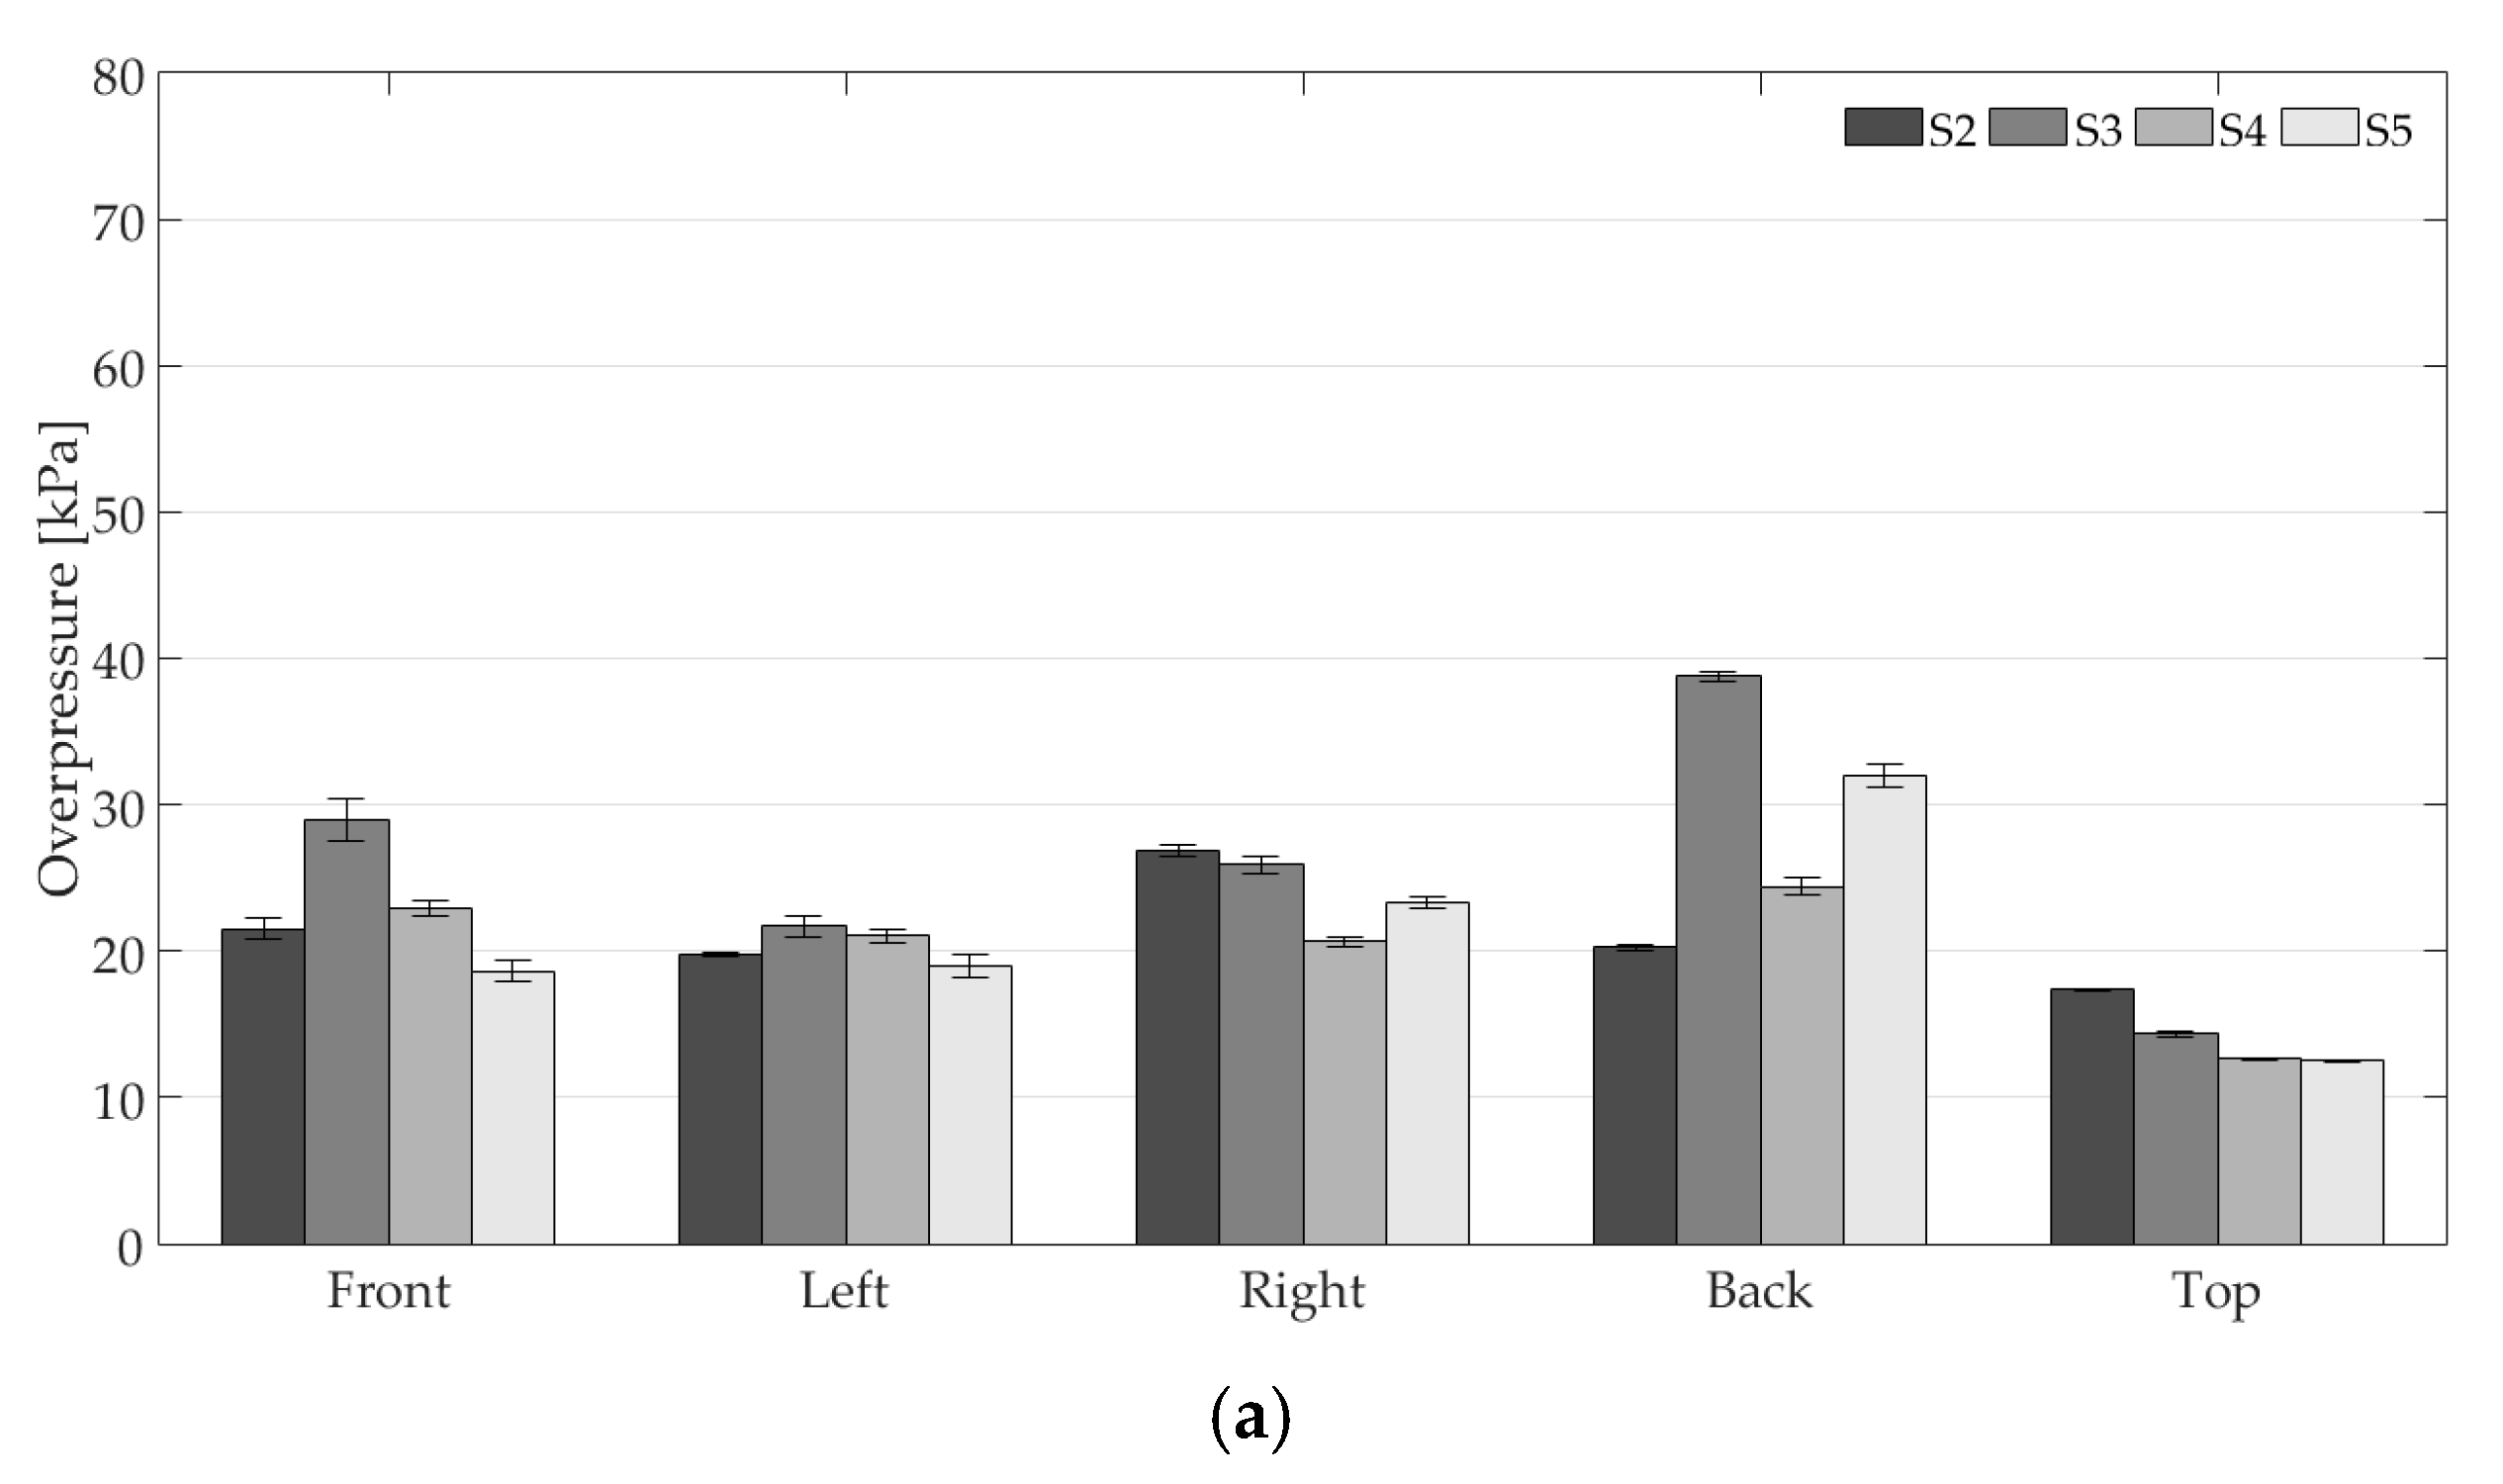
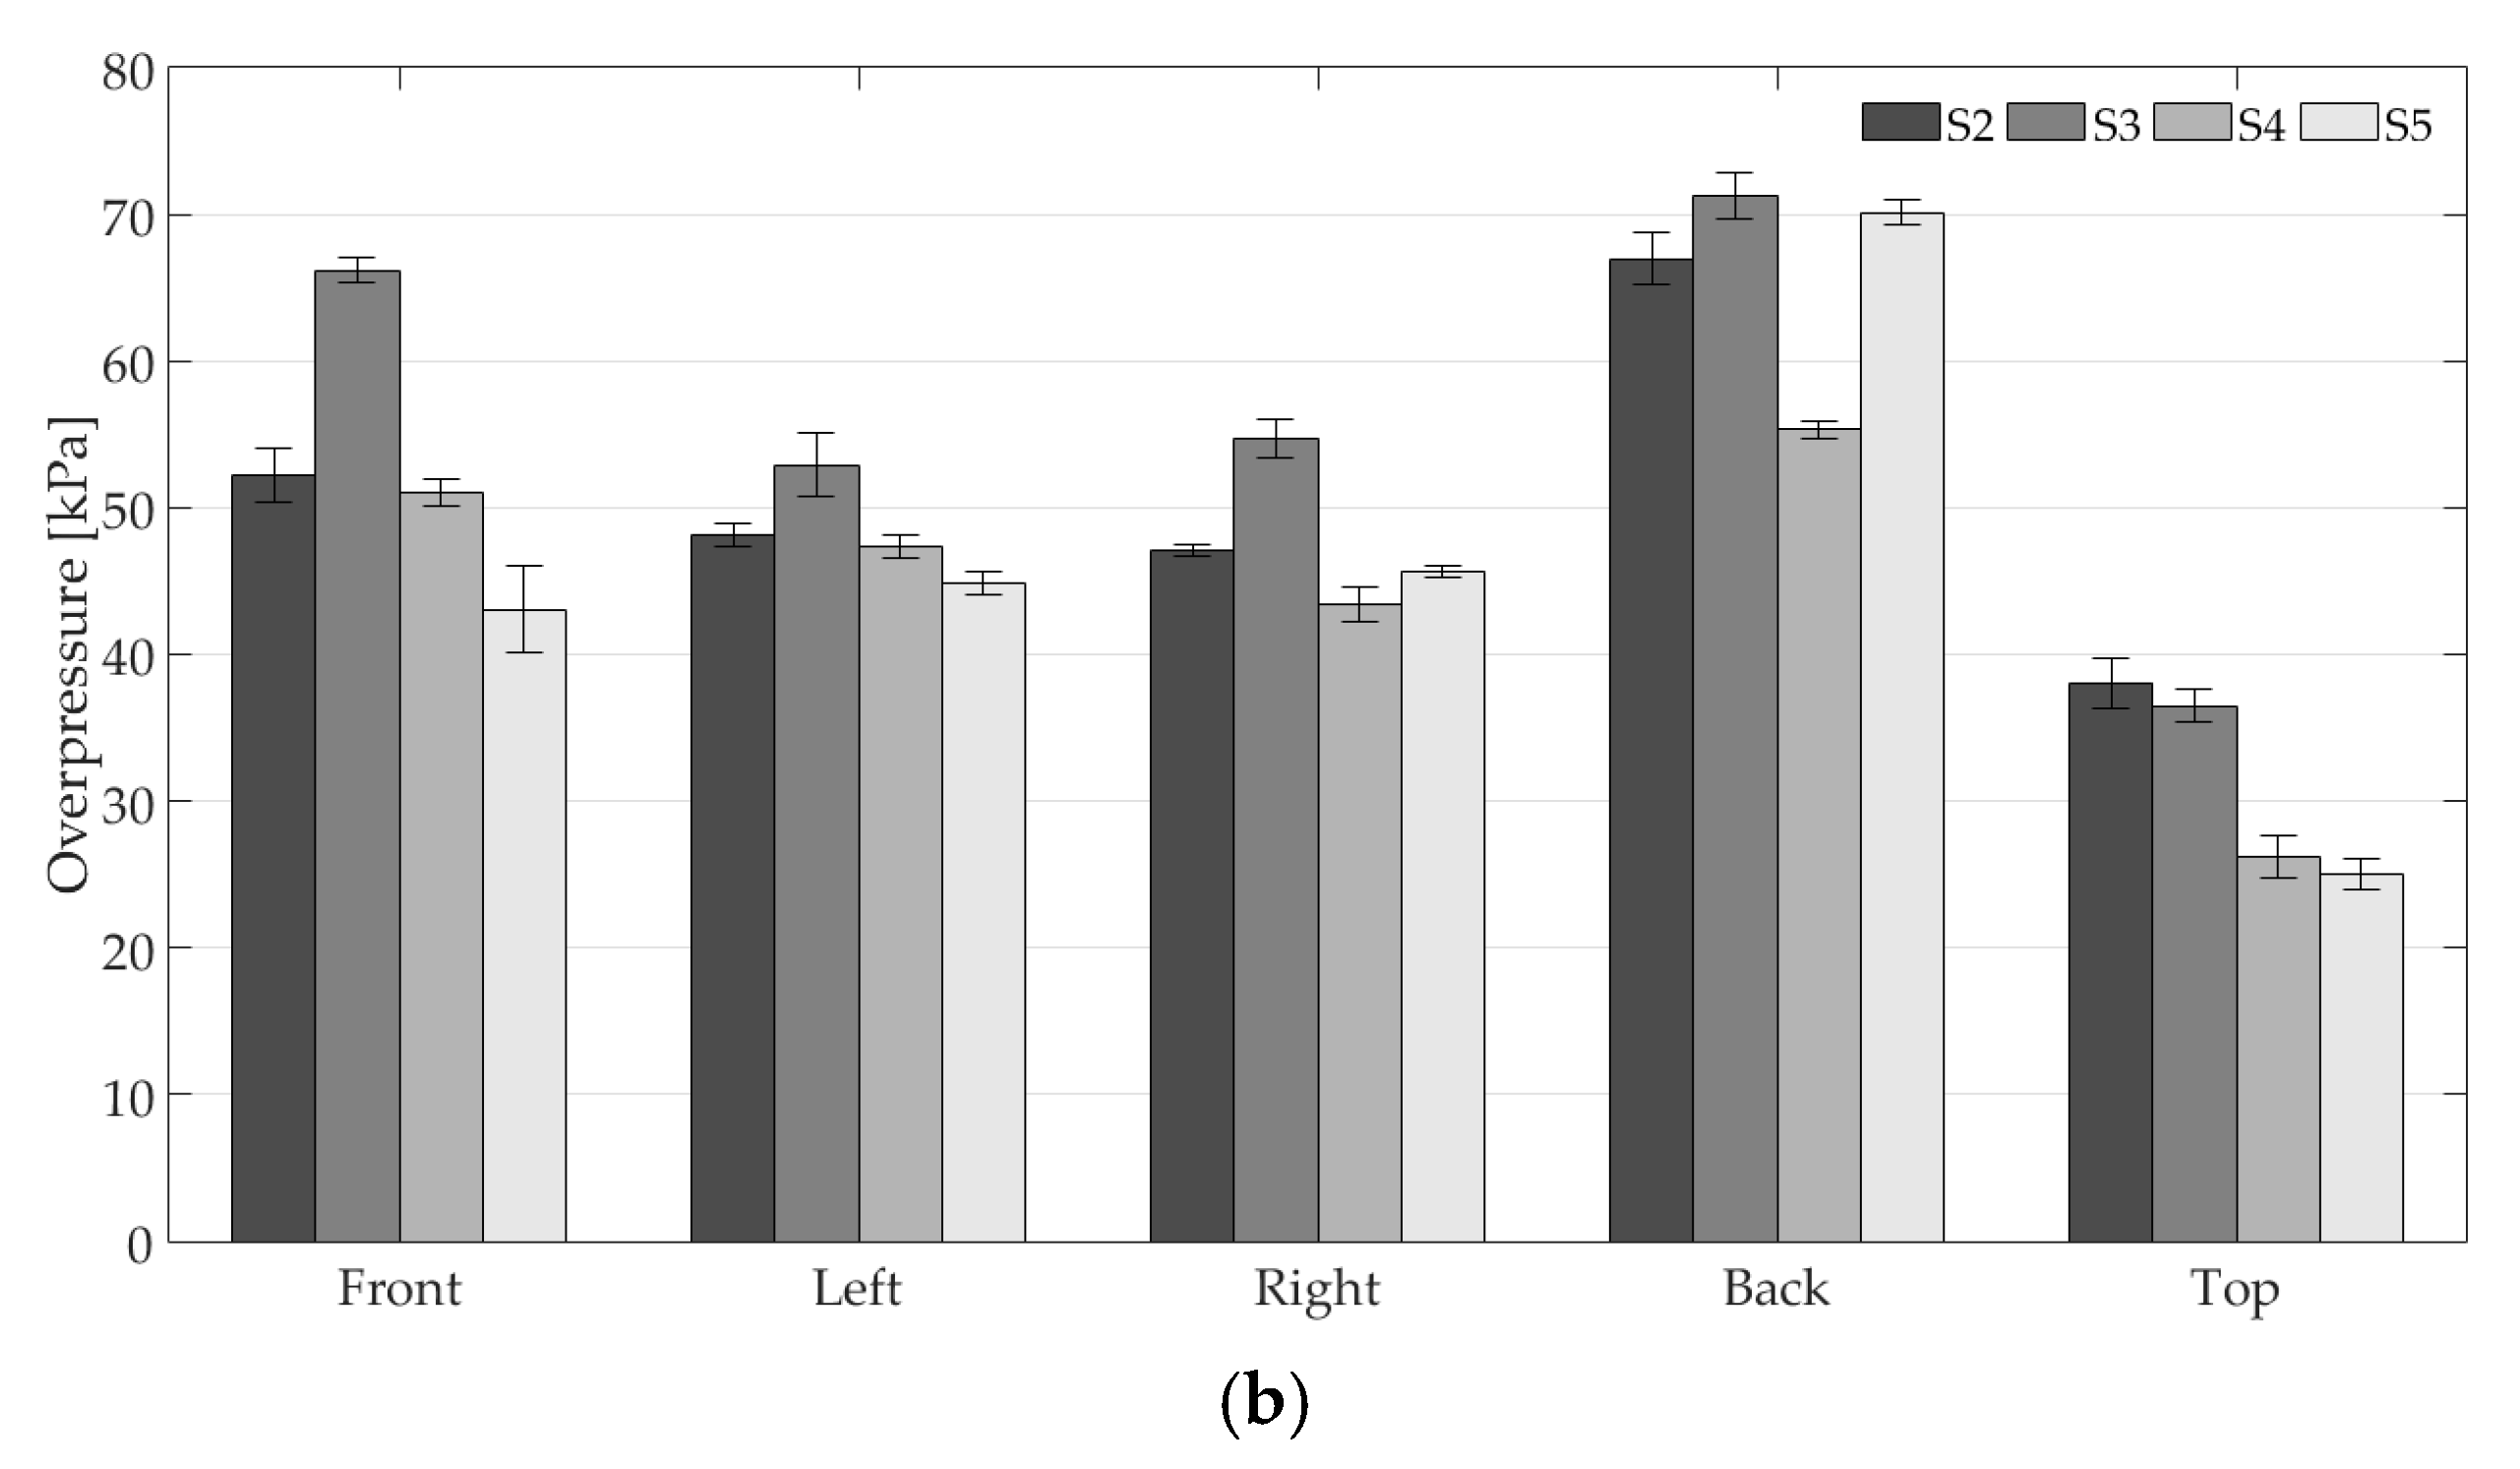
An increase in the overpressure happens when the waves split by the container meet at the rear, leading to superposition of waves, as can be seen in Figure 4. Thus, the back wall is where the highest overpressures occur while the least damage take place in the top (see Figure 5). To analyse the dispersion of the experimental data from its mean, the calculation of the standard deviation was done. It can be seen in Figure 5 that the experimental results show a small variability since the minimum and maximum values for the standard deviation are 0.06 and 2.11 kPa, respectively. As a conclusion, the values for the standard deviation prove that the experiments can be considered reliable.
The location of the pressure sensors was determined to examine the pressure evolution along vertical and horizontal directions. In general, small differences were found in the overpressure measurements comparing different sensor points on the same face (see Table 2). The differences in the calculated standard deviation lead to the conclusion that it would be reasonable the use only one sensor per face, since the maximum value is 8.34 kPa.
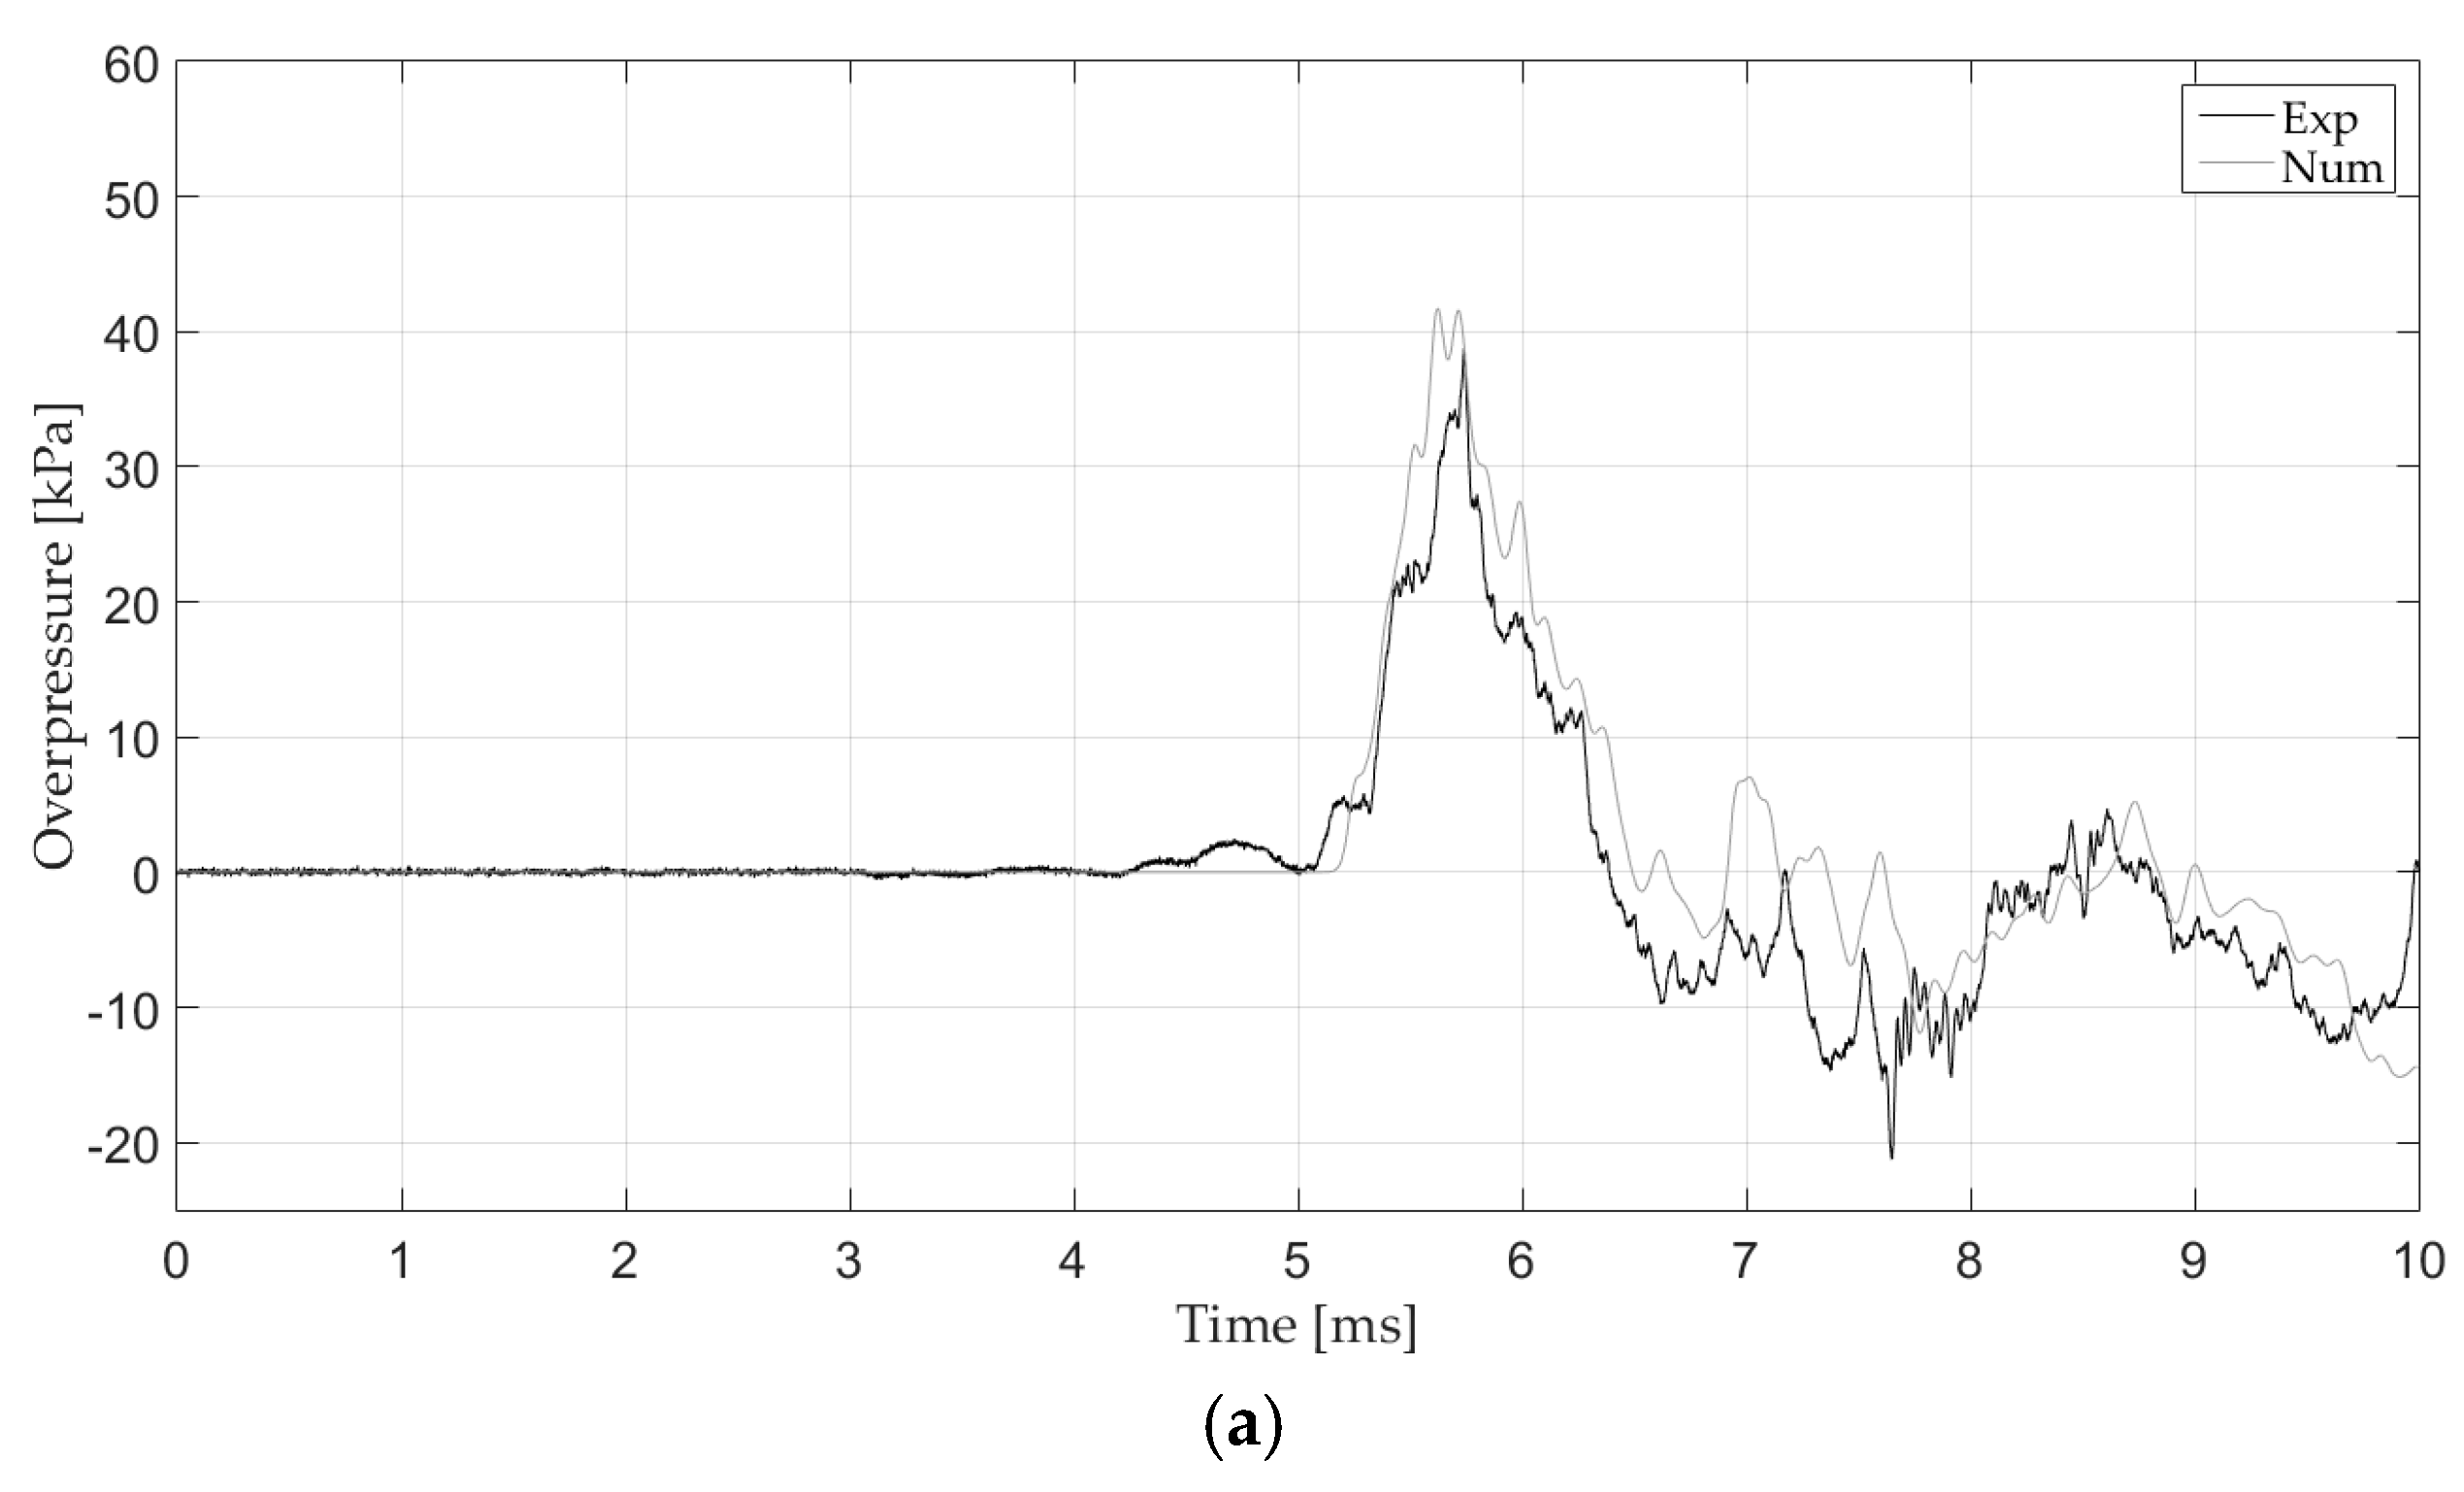
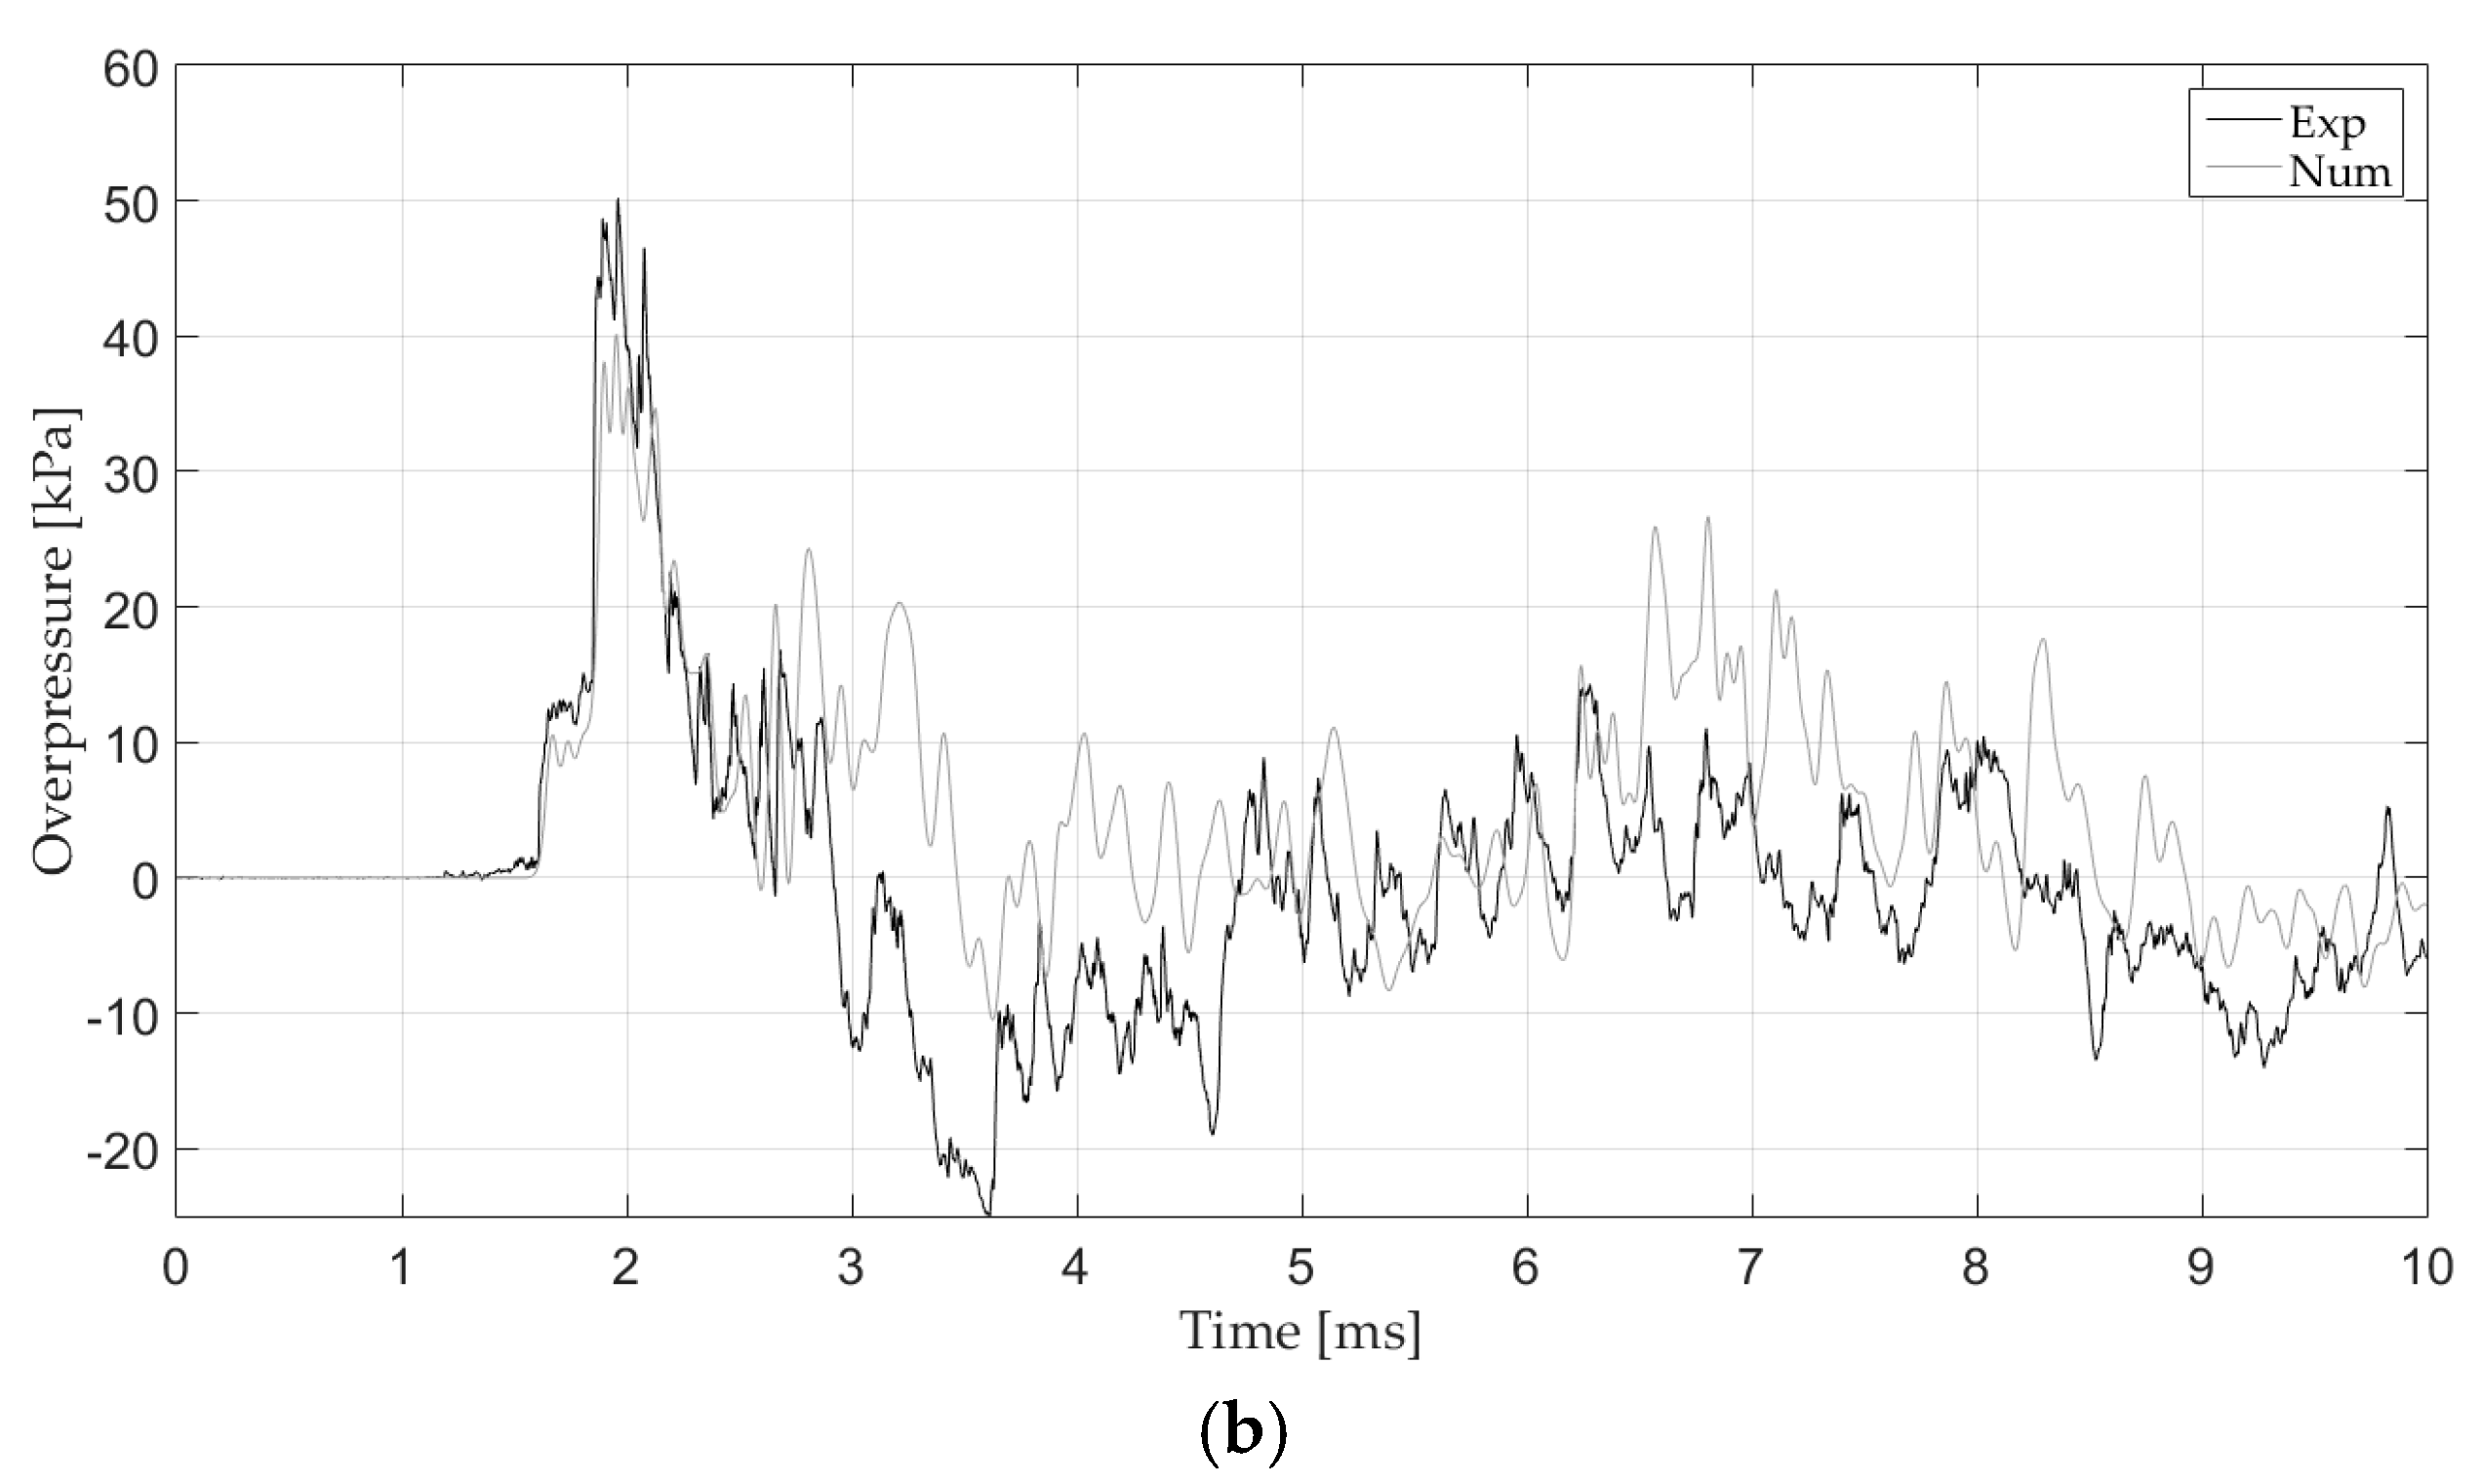
The numerical model was calibrated and a detailed comparison between experimental and numerical results was done. Figure 6 shows a good correlation between the results.

5. Conclusions

Test data using a small-scale model of a compound survival container was compared with numerical predictions generated via finite element analyses (LS-DYNA). The pressure-time histories were recorded in several locations of the model and a numerical model of the blast wave propagation was calibrated. The comparison between experimental and numerical results shows a good correlation between the results.
It was also concluded that an increase in the overpressure happens when the waves split by the container meet at the rear, leading to superposition of waves. It was found that the back face of the ISO container is where the highest overpressures occur while the least damage take place in the top face. To analyse the dispersion of the experimental data, a calculation of the standard deviation was done and has shown a small variability, which prove that the experiments can be considered reliable. In general, small differences were found in the overpressure measurements comparing different sensor points on the same face leading to the conclusion that it would be reasonable use only one sensor per face.

Acknowledgments

The authors acknowledge the technical advice and contributions of Major Frederik Coghe, Ing. Bruno Reymen, Warrant Officer Peter Michiels and Tony Tuts.

References

  1. Smith, P.D.; Hetherington, J.G. Blast and Ballistic Loading of Structures; Butterworth-Heinemann: Oxford, UK, 1994. [Google Scholar]
  2. Rigas, F.; Sklavounos, S. Experimentally validated 3-D simulation of shock waves generated by dense explosives in confined complex geometries. J. Hazard. Mater. 2005, A121, 23–30. [Google Scholar] [CrossRef] [PubMed]
  3. Sauvan, P.E.; Sochet, I.; Trélat, S. Analysis of reflected blast wave pressure profiles in a confined room. Shock Waves 2012, 22, 253–264. [Google Scholar] [CrossRef]
  4. Lecompte, D.; De Schepper, R.; Belkassem, B.; Kakogiannis, D.; Reymen, B.; Vantomme, J. A modular building-block system for lab-scale explosive testing of urban type configurations. In Proceedings of the 23rd Military Aspects of Blast and Shock, Oxford, UK, 7–12 September 2014. [Google Scholar]
  5. Baker, W.E.; Cox, P.A.; Westine, P.S.; Kulesz, J.J.; Strehlow, R.A. Explosion Hazards and Evaluation; Elsevier Science: Amsterdam, The Netherlands, 1983. [Google Scholar]
  6. U. S. Department of the Army. Fundamentals of Protective Design for Conventional Weapons; Technical manual (TM5-855-1); U.S. Department of the Army: Washington, DC, USA, 1986. [Google Scholar]
  7. Slavik, T.P. A coupling of empirical explosive blast loads to ALE air domains in Ls-Dyna. In Proceedings of the 7th European LS-DYNA Conference, Salzburg, Austria, 14–15 May 2009. [Google Scholar]
  8. Ousji, H.; Belkassem, B.; Louar, M.A.; Kakogiannis, D.; Reymen, B.; Pyl, L.; Vantomme, J. Parametric study of an explosive-driven shock tube as blast loading tool. Exp. Tech. 2015, 40, 1307–1325. [Google Scholar] [CrossRef]
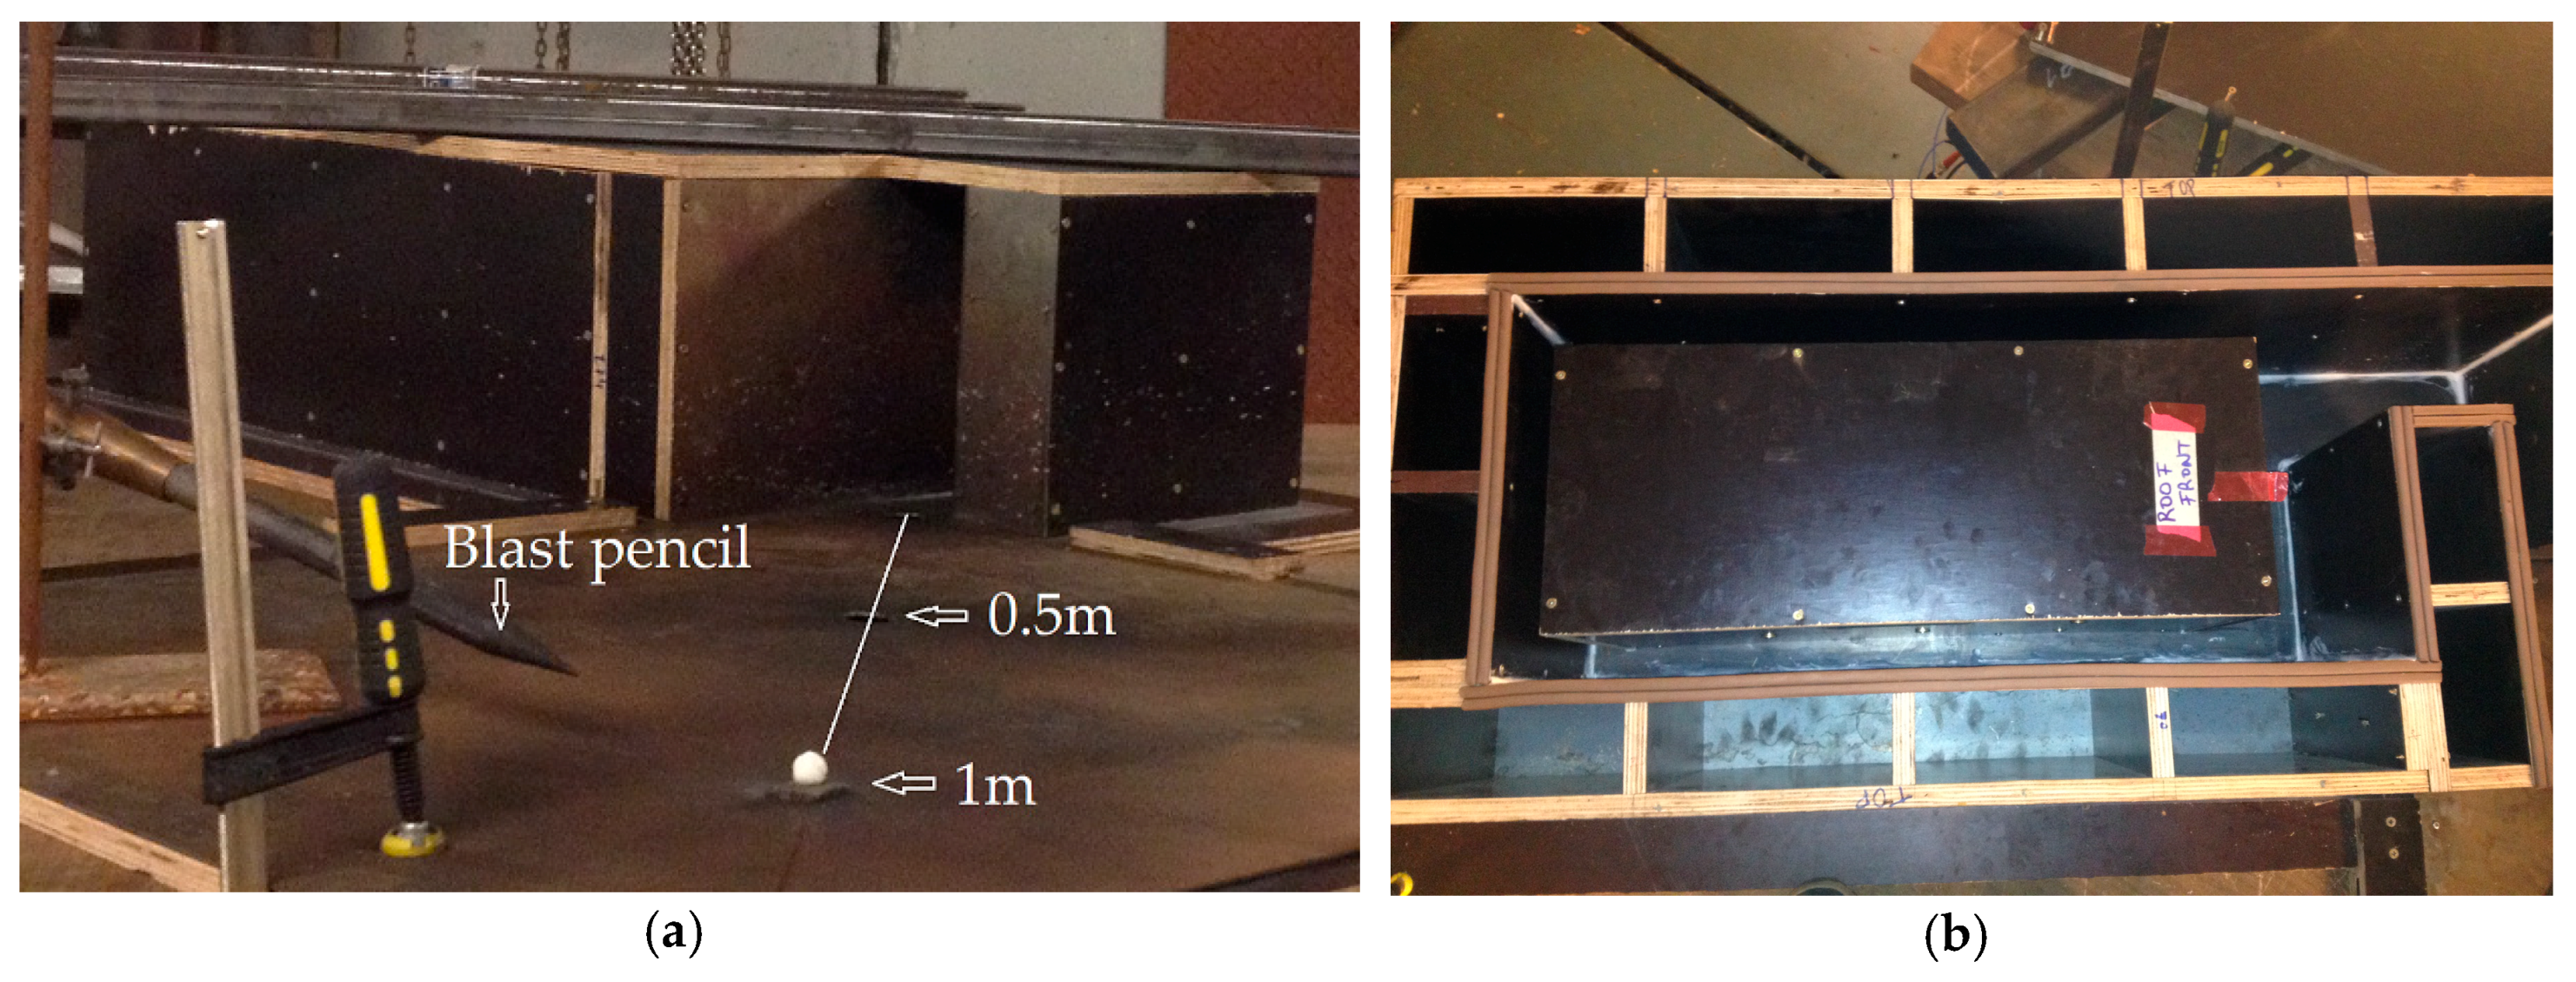
Figure 1. Experimental set-up: (a) Exterior global view; (b) Inside view of the configuration.
Proceedings 02 00540 g001
Figure 2. Location of pressure sensors: (a) right face views; and (b) left face views.
Proceedings 02 00540 g002
Figure 3. Numerical model: (a) air domain (in red) and ambient layer (in blue); (b) wireframe view showing the location of the ISO container.
Proceedings 02 00540 g003
Figure 4. Pressure iso-surfaces, (in MPa) of the blast wave propagation: (a) t = 2.3 ms (entrance); (b) t = 3.5 ms (split waves); (c) t = 5.6 ms (wave superposition).
Proceedings 02 00540 g004
Figure 5. Maximum overpressure measurements at different faces of the ISO container: (a) SOFF—1 m; (b) SOFF—0.5 m.
Proceedings 02 00540 g005aProceedings 02 00540 g005b
Figure 6. Experimental and numerical overpressure-time history: (a) at sensor 3 in the back face of the container (SOFF—1 m); (b) at sensor 4 in the front face of the container (SOFF—0.5 m).
Proceedings 02 00540 g006aProceedings 02 00540 g006b
Table 1. Material and equation of state properties [8].
MaterialParameterValue
Density 1.225 kg/m3
AirC0 = C1 = C2 = C3 = C6
C4 = C5
Specific internal energy
0
0.4
2.5 × 10⁻⁴ kJ/kg
Table 2. Descriptive statistics of the measured overpressures.
SOFF (m)Faces of ContainerMeanStandard Deviation
Front23.013.75
1Left
Right
Back
Top
20.37
24.16
28.85
14.21
1.05
2.41
7.10
1.97
0.5Front
Left
Right
Back
Top
52.12
48.35
47.71
65.91
31.45
8.34
2.91
4.25
6.31
5.87
Publisher’s Note: MDPI stays neutral with regard to jurisdictional claims in published maps and institutional affiliations.