1. Introduction
Composite materials are well established now for building aircraft structures, as a possible replacement of metal, mainly for their lower weight, high strength and resistance to corrosion. Besides the development of materials and structures, specific nondestructive inspection (NDI) techniques are studied actively, in order to detect and identify damages which are specific to these materials. Full composite structures however do not always comply with some specific requirements and hybrid structures, incorporating both composites and metals [
1], are still necessary. In such case, adapted NDI must also be studied and assessed.
In this work, we used as reference sample a sandwich structure typically 5 mm thick and composed of a core made epoxy reinforced by carbon and glass fibers, with skins of Titanium adhering to the former through epoxy adhesive. The plane sample incorporates Teflon inserts as artificial defects, which generally simulate delamination in Ultrasound Testing (UT), as well as air gaps (lack of epoxy), of different diameters and depths. UT did not provide satisfactory results. Therefore, we have studied alternatives such as active thermography and shearography. For active thermography, methods of excitations such as induction, vibration, modulated laser, modulated lamps and flash lamps were used. In the case of shearography, methods of excitations such as lamp heating, vibration and pressure variation (vacuum vessel) were used. In this paper, we will first provide a description of the sample. Then we will review the different inspection approaches and provide the results for each of them.
2. Description of the Sample
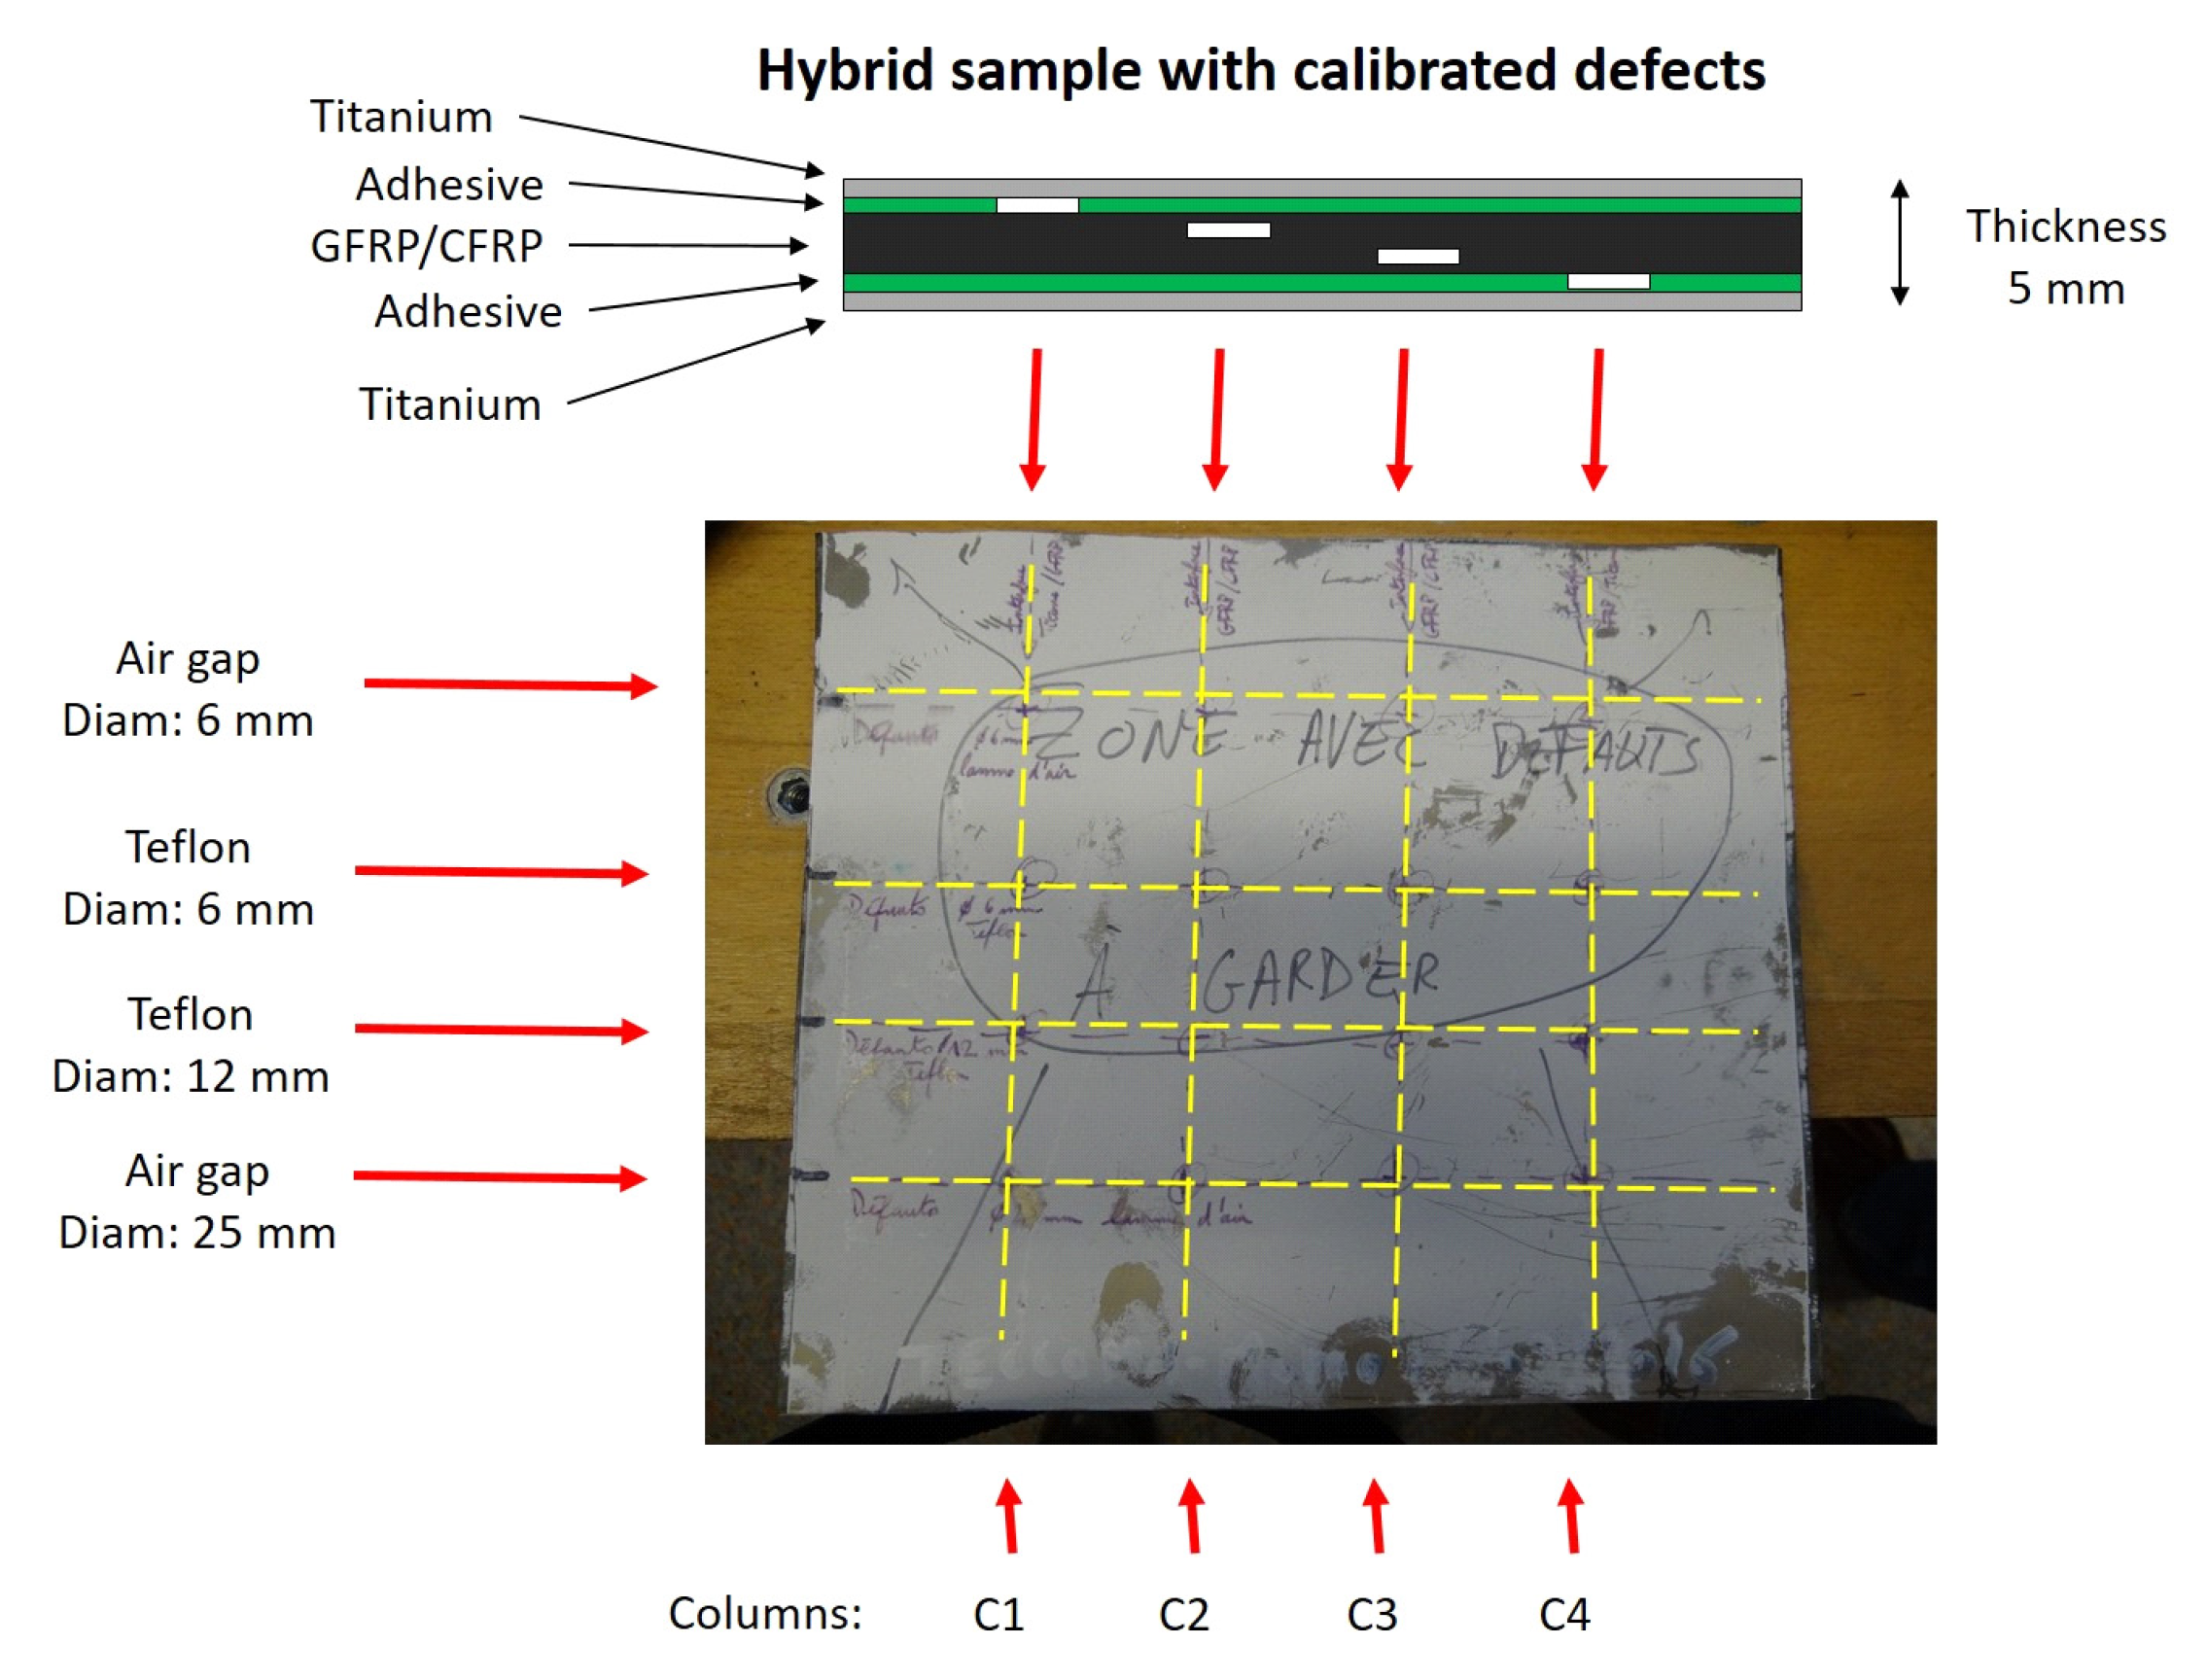
The sample is a hybrid sandwich metal-composite flat panel (
Figure 1). It is composed of an epoxy core reinforced by successive carbon and glass fiber plies. The skins are made of titanium, glued to the core by means of epoxy adhesive films. The global thickness of the panel is 5 mm. Series of defects are arranged at the intersection between lines and columns, such as displayed in
Figure 1. Column 1 (C1) represent defects the closest to the upper surface, whereas C4 are those the closest to the lower one. They are located at the adhesive layer. Columns C2 and C3 correspond to defects located in the composite core. Each line corresponds to a give type and diameter of defect: air gaps of 6 or 25 mm for the external lines, or teflon inserts of 6 or 12 mm for central lines.
3. Inspection Techniques Used
Active infrared thermography is now an established technique for NDI, especially in the field of composites. If an inspected part undergoes a thermal change, a thermal infrared camera observes at its surface the very small temperature variations due to the presence of sub-surface defects [
2]. Various thermal imaging technologies are currently developed, marketed and used for detecting defects in composites [
3]. Generally, these temperature variations are generated by an excitation source, either external or internal (the material itself under some stress).
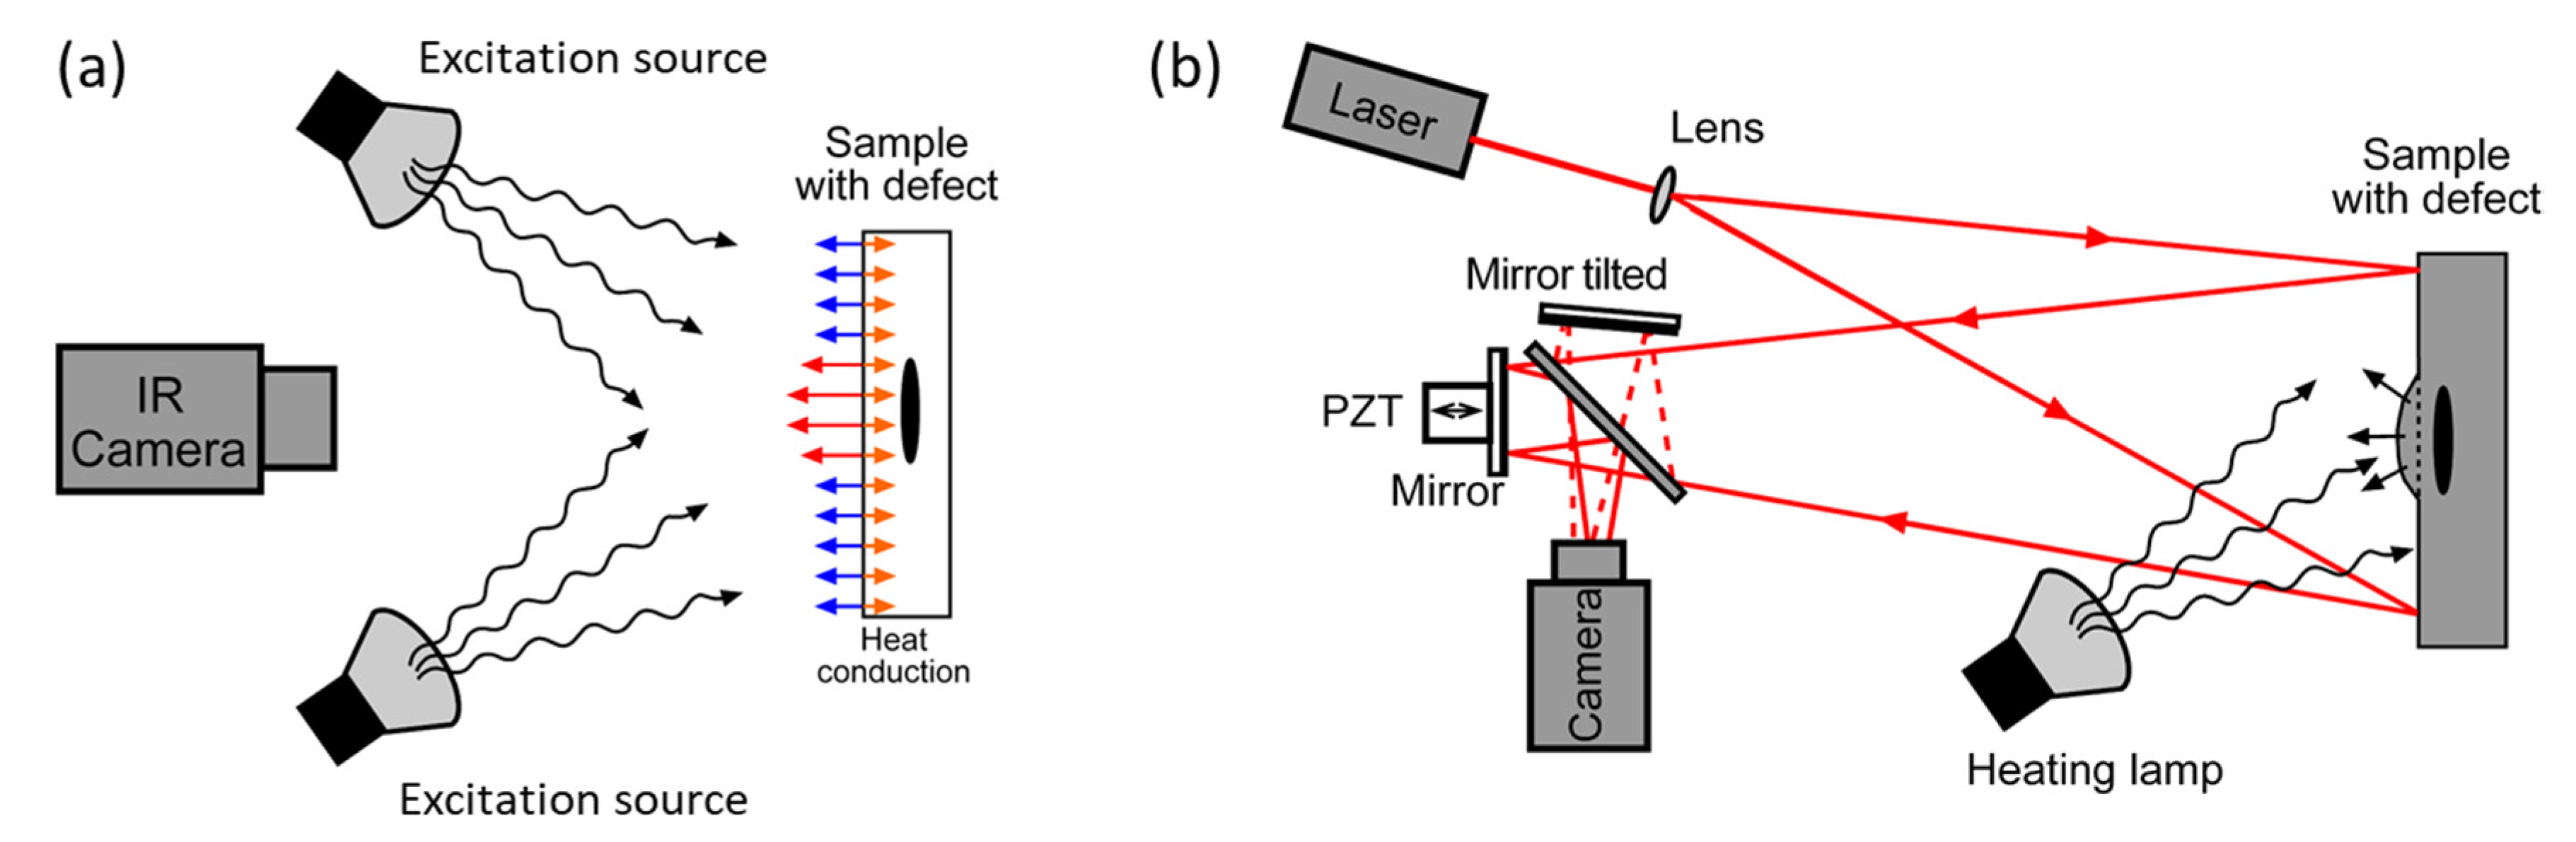
Figure 2a shows the principle of the method. Various methods of excitation exist and are used for defect detection: mainly optical (lamps), mechanical (vibration) or by electromagnetic induction [
4]. Different configurations and duration of excitation are used for each case, and are associated with processing of the data: pulsed or burst mode, modulated mode (lock-in) or step mode. Moreover, post-processing can be applied by different approaches: either deterministic (e.g., Fourier analysis of time series) or statistical (e.g., by Principal Component analysis) [
4].
Shearography is a full field technique allowing measuring strain maps [
5]. In NDI, it allows detecting the local strains as local fringe density variations related to the mechanical response of a defect under the effect of an excitation. Like thermography, various excitation methods exist, some are similar to thermography (heating with lamps, vibrations), some are more specific, like pressure variations.
It is well known that the capacity of thermography and shearography for detecting a defect depends on many factors. Mainly, the properties (thermal or mechanical) of the defect materials must be such that, under a suitable excitation, a differentiated signature must be observable and the object surface (either thermal or mechanical, in function of the inspection technique used). Also the signature depends on the location (especially the depth) and the extent of the defect. Therefore, assessing the performance of any NDI is not an easy task. One could consider simulating the NDI experiment and the defect response to an excitation. However, in the complex case of composites, moreover hybrid ones, this task would be difficult. Therefore, we considered a straightforward experimental approach, performed on a large panel of equipment, both at the level of excitation and inspection. Different combinations of inspection and excitation have been tested. They are described in the next sections.
4. NDI by Thermography
4.1. Induction Thermography
Inductive thermography (IT) induces eddy currents in a specimen which are visualized using an infrared camera. Inhomogeneities in the eddy current distribution indicate material defects. As measurement result, the time lag between inductive excitation and thermal response is evaluated, providing an extremely robust signal, which is insensitive to irregularities or impurities of the component surface. IT is usually used for metallic samples crack detection, but other materials can be investigated too [
6,
7]. Parameters of importance are electromagnetic skin depth (ESD) and thermal penetration depth (TPD) which depend on the material, as well as to the frequency of the inductor. At 100 kHz frequency, titanium’s ESD is around 2 mm and TPD 1.5 mm. For CFRP, ESD is 50 mm and TPD is 1.2 mm [
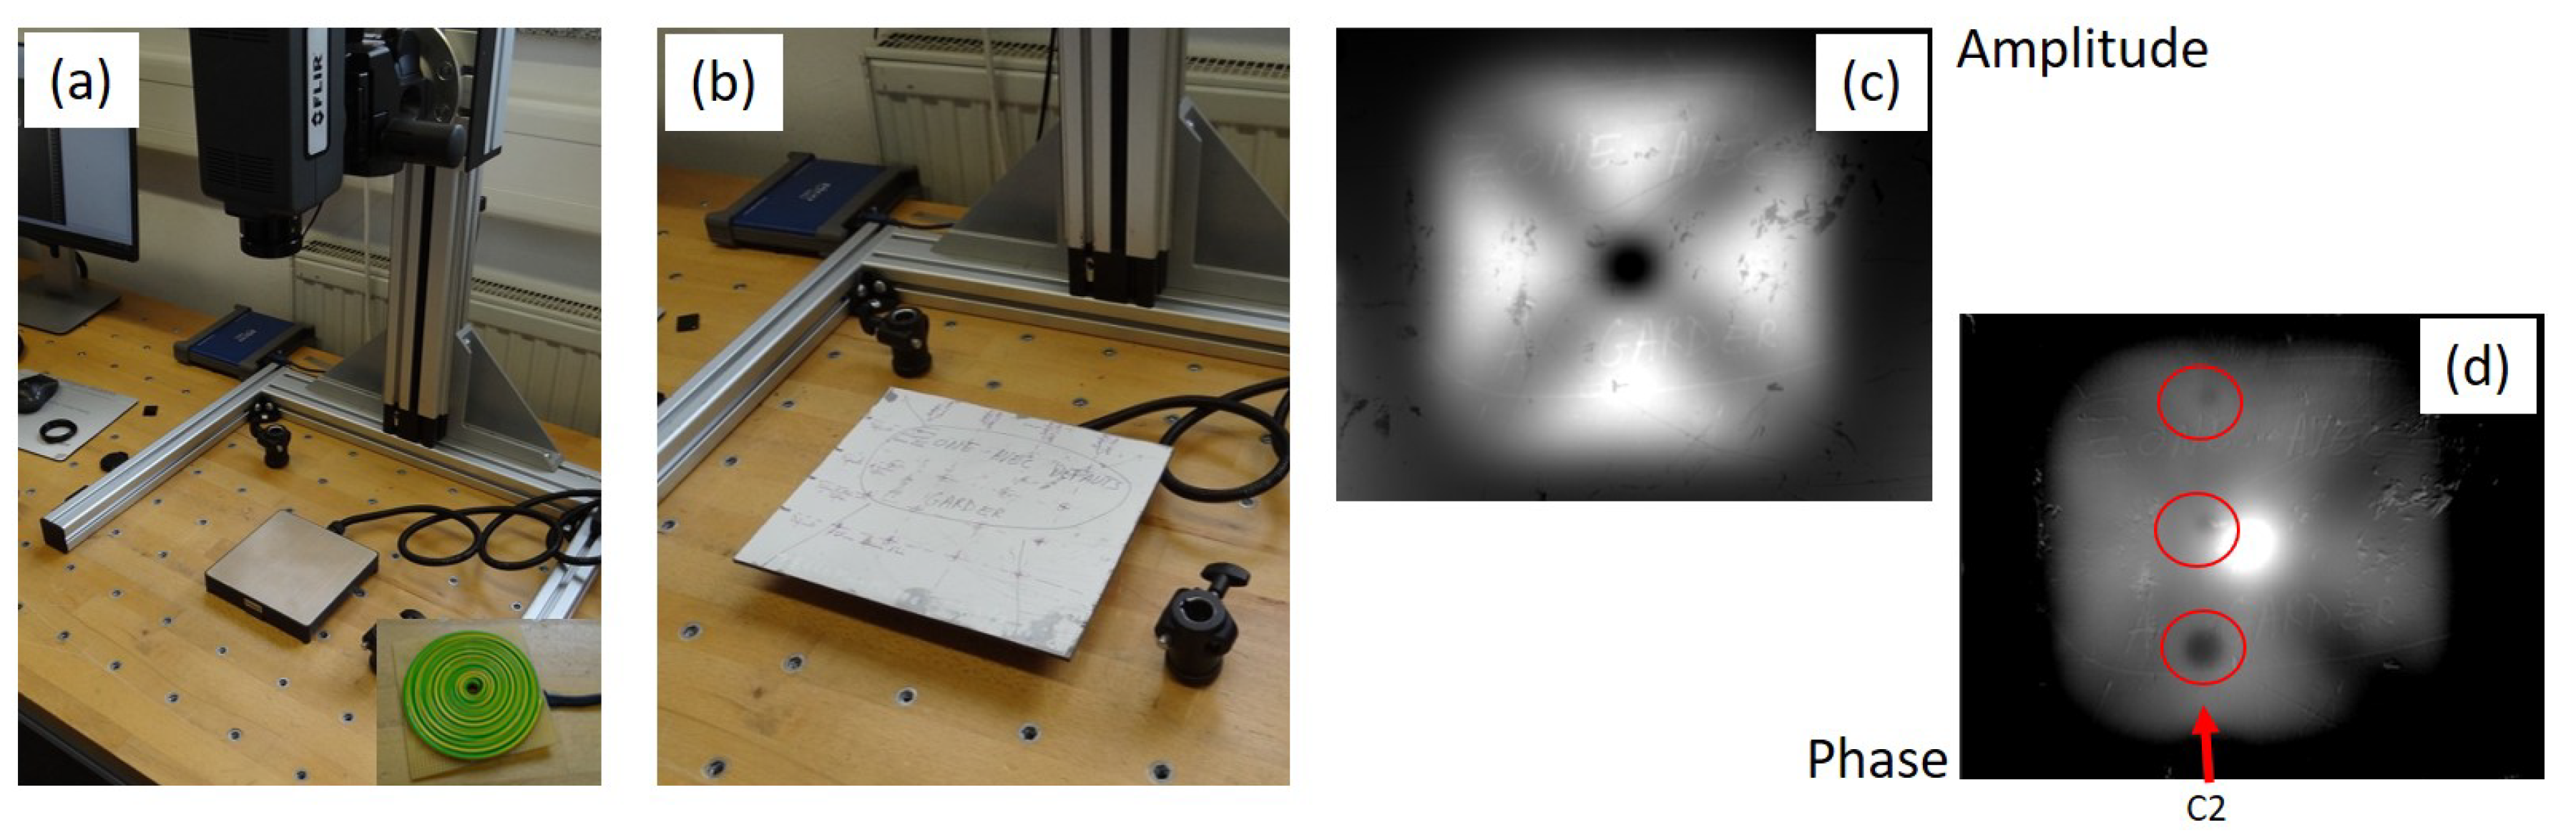
7]. Here we have a mix of CFRP/GFRP core for which these properties are not known. However, if we extrapolate the values of CFRP, we see that we should be able to observe the defects located close to the front side, for an inductor placed at the back side of our sample and which produces the heat flow passing through the sample. The induction system is a circular inductor placed behind the sample (
Figure 3a,b). The camera is a FLIR A6751sc with frame rate of 125 Hz. Different frequencies of the inductor have been tested. The only one which gave observable results is 25 kHz. The Pulse-Phase method has been applied [
6].
Figure 3c,d show respectively the amplitude and phase for a Fourier frequency 0.1 Hz. Defects of column C2 can be observed in the phase part. They correspond to defect inside the core. Unhappily, the technique does not provide a clear map of defects, contrarily to other types of excitation. We clearly see here that the phase image is affected by a pattern related to the form of the coil, as is also visible in the amplitude image.
4.2. Optical Excited Lock-in Thermography
Optical excited Lock-in thermography (OLT) makes use of modulated halogen lamps. The penetration depth
of thermal waves depends on the thermal diffusivity
and the modulation frequency
of the lamp as
. Because of their lower diffusivity than metals, composites like CFRP or GFRP require lower modulation frequencies to be penetrated by a thermal wave in order to see subsurface defects. The lower the frequency, the deeper the defect observed. In the case of our sample, this situation is favorable since such low frequency thermal wave will easily pass through the metallic skin. The OLT technique consists in choosing an adequate modulation frequency of the halogen lamp and recording a set of 4 thermograms at each quarter of the modulation period. A simple algorithm is used to retrieve the amplitude and phase of the thermal wave [
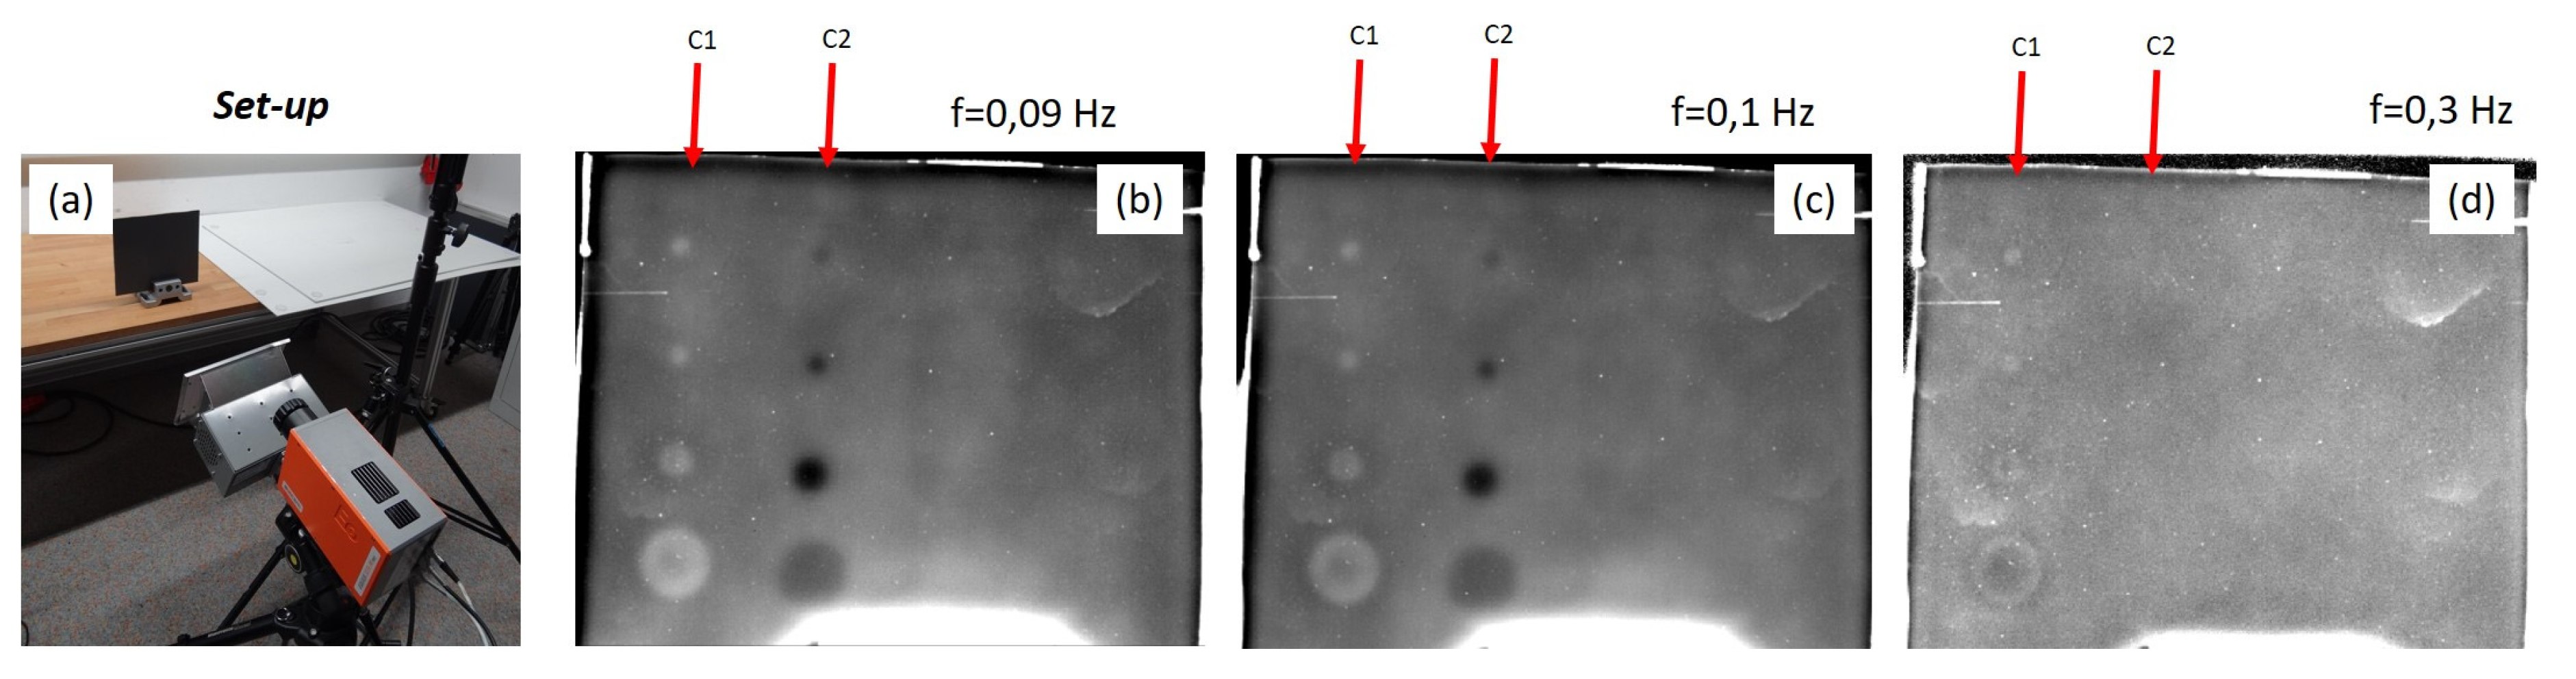
8]. The defects are generally well observed in the phase images, as phase variations with respect to the surrounding material.
Figure 4a shows the set-up: the camera is an IRCAM Equus 327 k. Phase images obtained at various lamp modulation frequencies (
Figure 4b–d). For the highest frequency (
Figure 4d), only the larger defect, close to the surface (column C1)) in visible. Lower frequencies allow probing deeper, as is show in
Figure 4b,c.
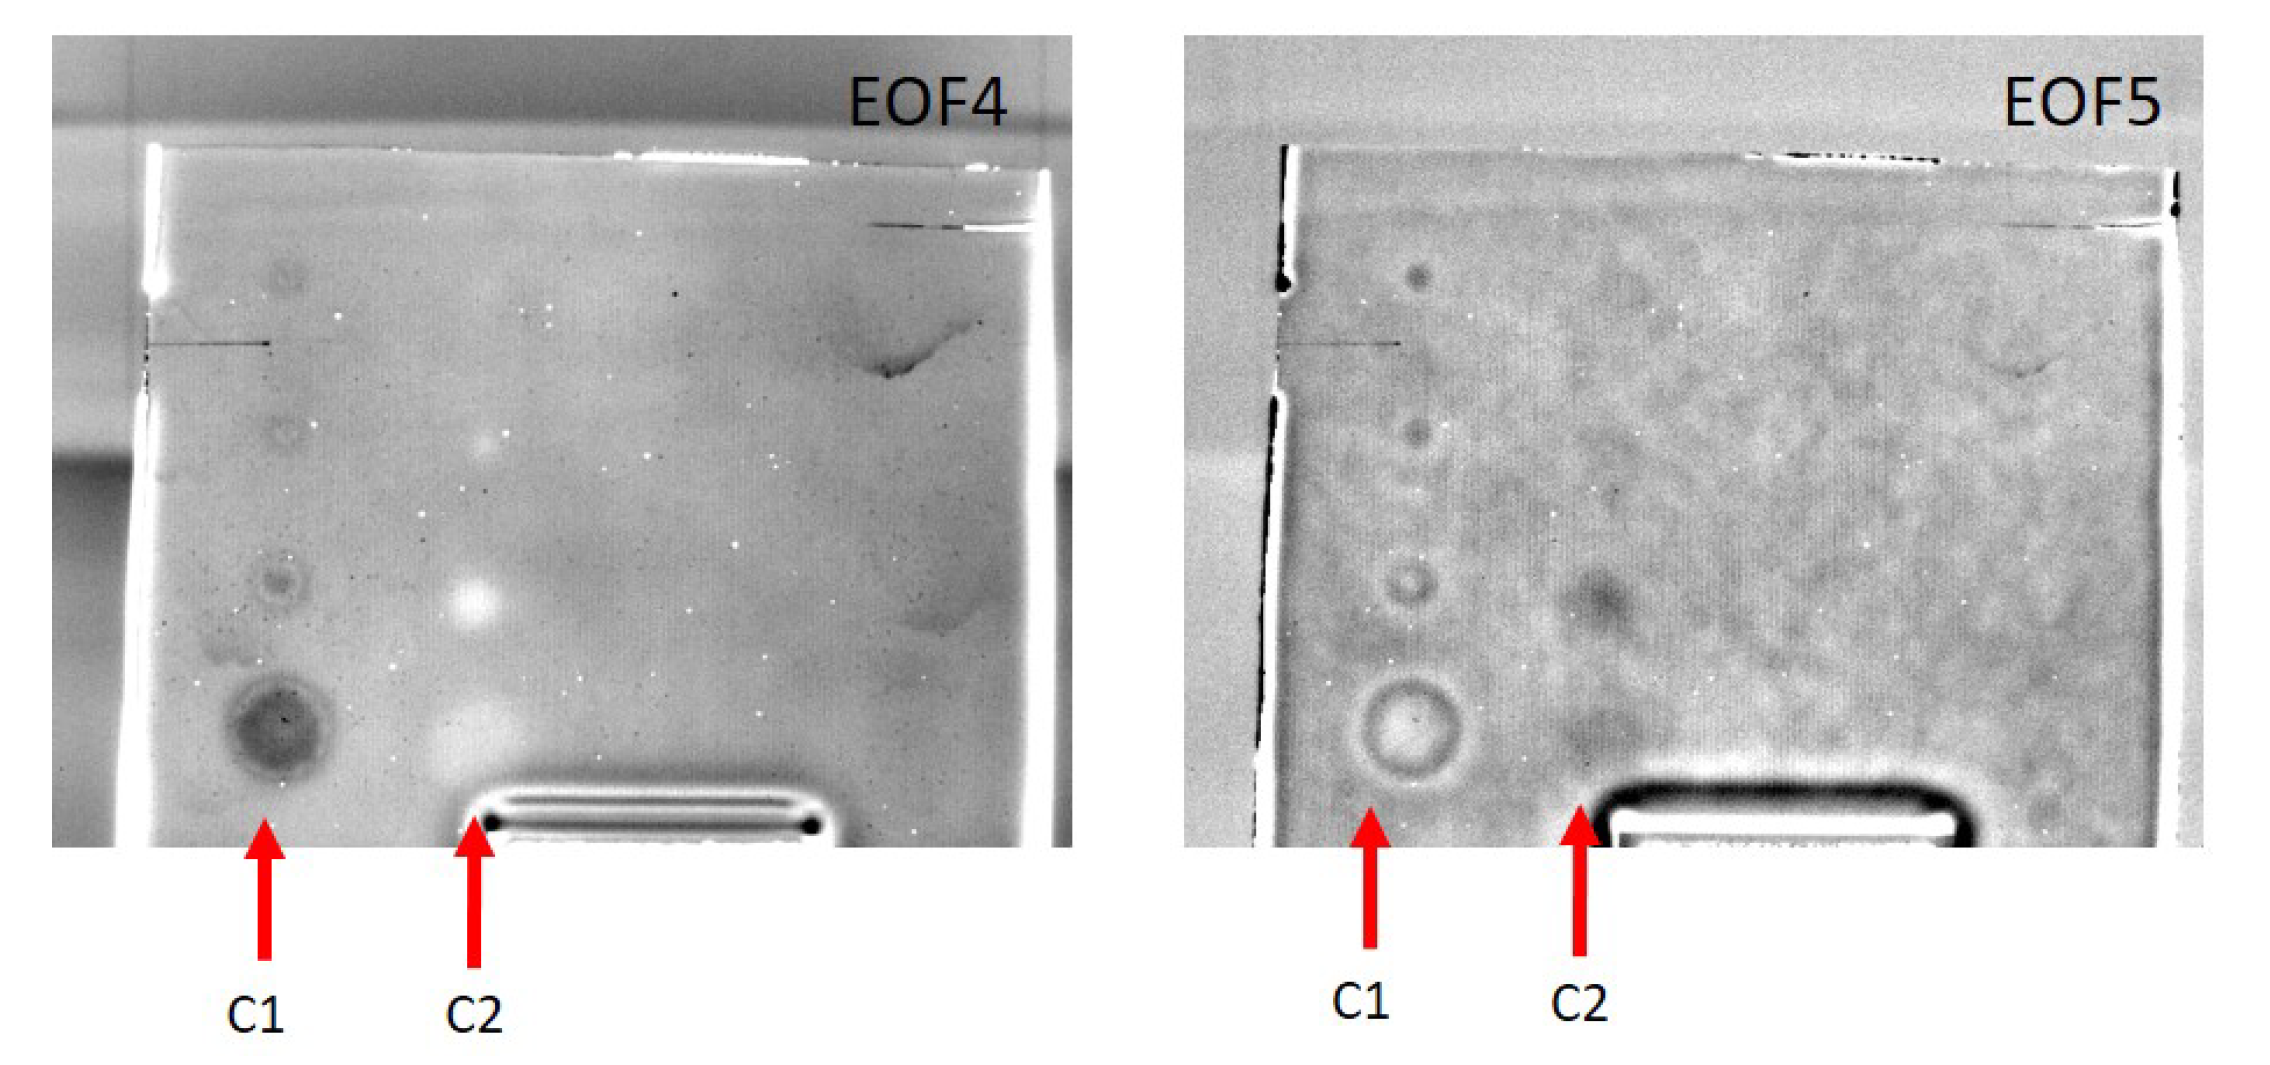
4.3. Optical Excited Pulse Thermography with Principal Components Analysis
One of the most conventional active thermography method is to use flash lamps. A set of thermograms is recorded and post-processed by different ways. Fourier analysis allows retrieving amplitude and phase images at various frequencies, from a single measurement batch. Results are then generally comparable to those of OLT. Another way to process them is by using a statistical method, the principal components analysis [
9]. It provides a reduced set of images which are the eigenvectors of a matrix formed all the spatio-temporal data obtained by the thermogram sequence. These eigenvectors, so-called empirical orthogonal functions (EOFs), are ordered by decreasing spatio-temporal variability. Usually the defects appear well represented in some of the first EOFs. The setup used is similar the one shown in
Figure 4, except for the lamp which is a 6kJ flash lamp from Hensel.
Figure 5 shows EOFs 4 and 5 where defects are visible on all column C1 and some of C2.
5. NDI by Shearography
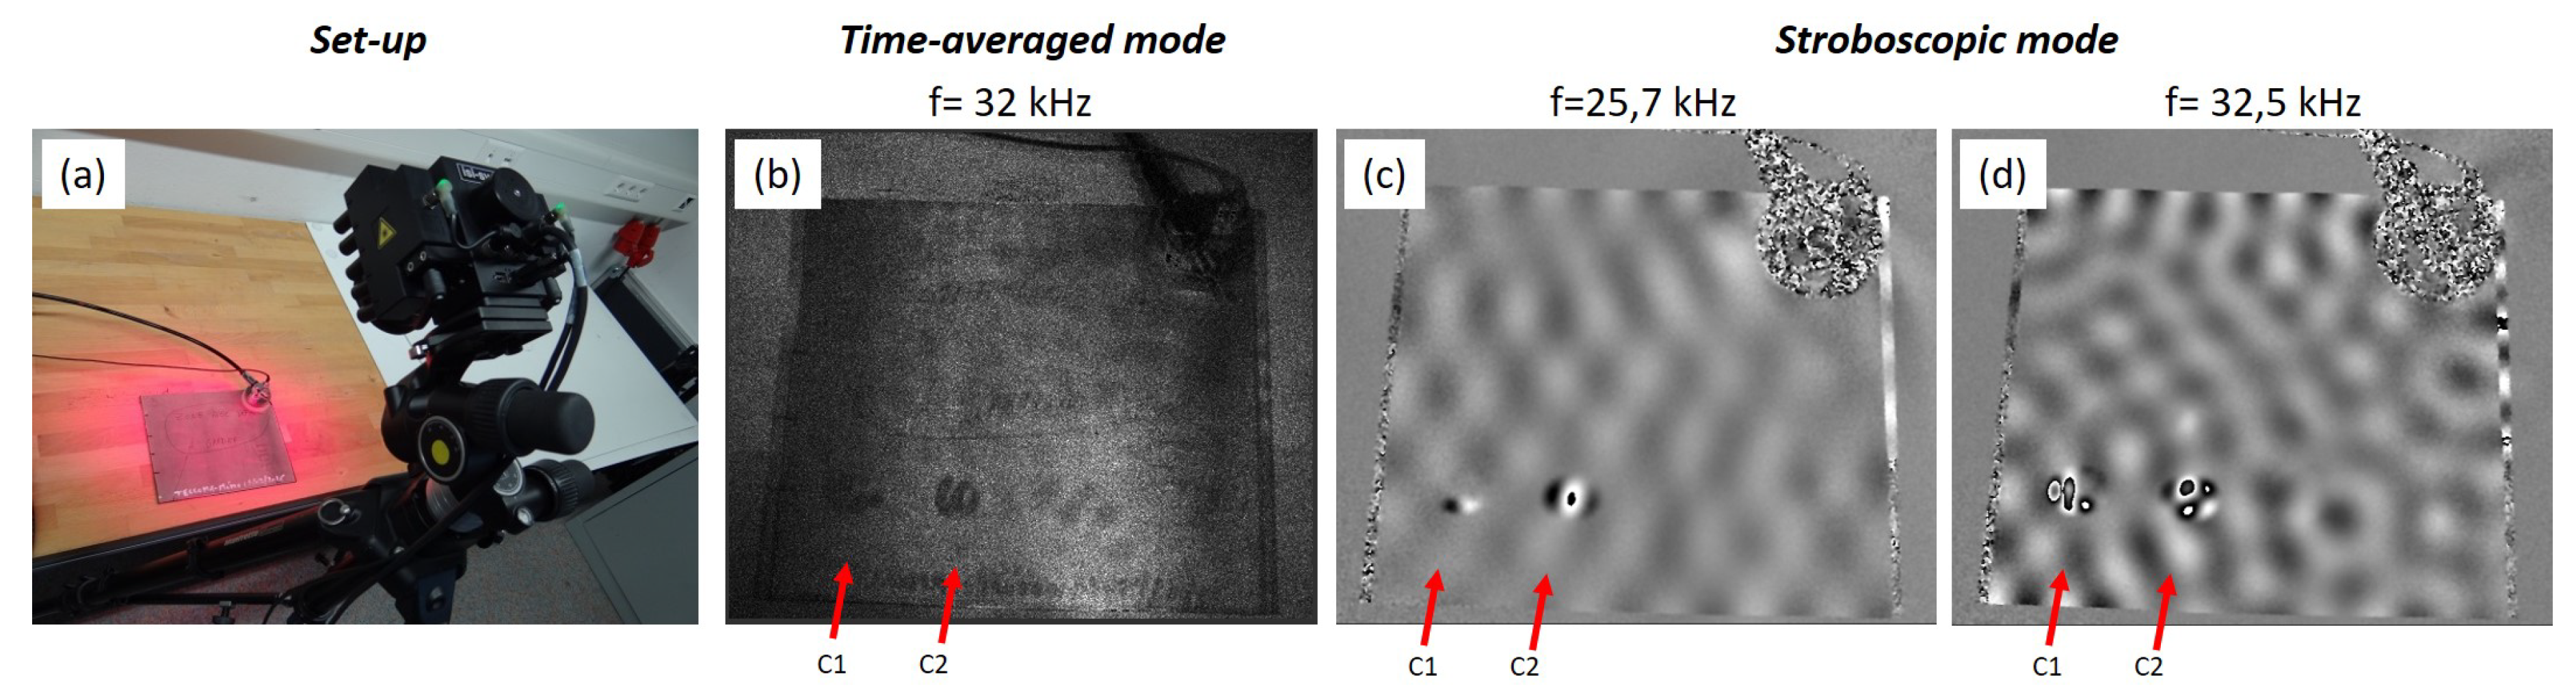
Shearography requires the recording of the interference between an image and itself laterally displaced by means of an optical shearing device placed in front of the camera. This interference pattern is called a shearogram. Usually the phase-shifting (PS) is applied for computing the optical phase difference: a set of shearograms are recorded under the same object state, but with an additional phase step applied to only one of the two images. Such phase step can be induced by movin one element of the shearing device. A simple algorithm is used to retrieve the optical phase difference between both interfering beams. The general procedure of shearography inspection is to record a shearogram (and generally its phase by PS) when the object is in a first state (e.g., at rest). Then the excitation is applied to the object and new shearograms are recorded (possibly with PS). The difference between both shearograms, or the phases calculated by PS, provides a fringe pattern (interferogram) which corresponds to the spatial derivative of the displacement field of the object surface under the effect of the excitation. Looking for different loading conditions allows finding observing more or less easily defects. Shearography is generally well suited for showing local fringes due to deformation of the skin under which a lack of adhesion (disbond) is present. This can be seen by heating, change of pressure or vibration. The shearographic device used here is from the ISI-SYS company, model SE2 (
Figure 6a).
In the case of vibration, different methods are generally used. In all cases, vibration if provided by a shaker attached on the object (
Figure 6a) and vibrating at a single sinusoidal frequency. The signal of defects appears very well defined frequencies due to the resonance effect. The first mode is the time-averaged mode in which the shearograms are integrated by the camera over a very long time compared to object oscillation period. The surface appears not deformed except for the defects. (
Figure 6b shows the fringe pattern for excitation of 32 kHz. Such an image is not always easy to be used for finding defects signatures since it is affected by the uneven reflecting properties of the object. The stroboscopic mode can be used. Here the PS can be applied, but it requires to modulate stroboscopically the illumination laser in synchronization with the vibration. Results at two frequencies are shown in
Figure 6c,d. The signature of air gaps of 25 mm diameter close to the surface are well visible, but stationary waves observed on the whole sample disturb the images.
6. Discussion—Conclusion
Thermography and shearography full-field NDI techniques have been used with different excitation sources for finding defects in hybrid sandwich structures made of titanium skins and CFRP/GFRP mix core. So far, thermography with lamp heating provides good results, where the defects at depths typically of 2 mm have been observed, with diameters as small as 6 mm. Especially, optical excited lock-in thermography provided the best results. Shearography can also provide good results. So far, with our sample, vibration gave impressive results but only on larger defects (air gaps, diameter 25 mm) and no deeper than 2 mm. In particular defect on column C2 is much better seen than with thermography. This shows that complementarity of these NDI techniques should be envisaged for future works, with separate techniques or under integrated schemes [
10,
11].
