1. Introduction
Tensile stresses generated by local stress concentration at microscopic flaw scale inside quasi-brittle materials are responsible for the initiation and development of their rupture process. The crack propagation process releases energy as elastic waves, known as acoustic emission, AE [
2]. Given the characteristics of the initiation of this damage process, experimental analyses of specimens subjected to tensile stresses monitored with AE is an adequate option to achieve a real understanding of this process.
The distribution of damage inside a specimen under loading can be obtained by three-dimensional localization of AE sources. Several works have reported on the three-dimensional localization of AE sources [
2,
3,
4,
5,
6,
7], but they consider
vp as a known value that remains unchanged while damage is induced in the specimen. This assumption is not realistic and may affect the accuracy of the localization process and the accuracy of the AE sources pattern obtained. Aker et al. [
8] incorporated
vp calculation during the localization process but using a separate group of sensors specifically for this purpose. Li and Dong [
9] proposed a solution for the three-dimensional localization of AE sources with
vp calculation, but their algorithm requires previously known information about the onset of signal to each sensor. Since both the P-wave arrival time and the
vp value are dominant factors involved in the accuracy of the three-dimensional localization of AE sources, an algorithm incorporating improvements for both aspects, called CLAPWaVe (Crack Location by Acoustic emission with P-Wave Velocity determination) [
1], is applied in this manuscript. CLAPWaVe is an iterative three-dimensional localization algorithm that includes a more efficient searching algorithm, an improved methodology for P-wave arrival time determination, independent of a predefined amplitude threshold, and calculates the coordinates of each AE source as well as the associated
vp value [
1].
This manuscript reports on the application of CLAPWaVe to the characterization of the cracking process, the cracking pattern and evolution of integrity within a brittle material under diametral compression test. The characterization process is performed using complementary analyses of the pattern of localized AE sources and the distribution of both vp and absolute energy release EA inside the specimen volume during the loading process.
3. Results and Discussion
The localization algorithm of CLAPWaVe minimizes the error of searching for the coordinates of each AE source including vp as another unknown variable in the iterative process. Thus, the vp value associated to each AE source characterizes the mean properties of the specimen volume, defined along the trajectories between the AE source and each of the AE sensors that receive the signal emitted by this AE source. Therefore, the trend of the average vp values associated to each AE source allows the analysis of the distribution and evolution of damage, strength and stiffness inside the volume of the specimen during the loading process.
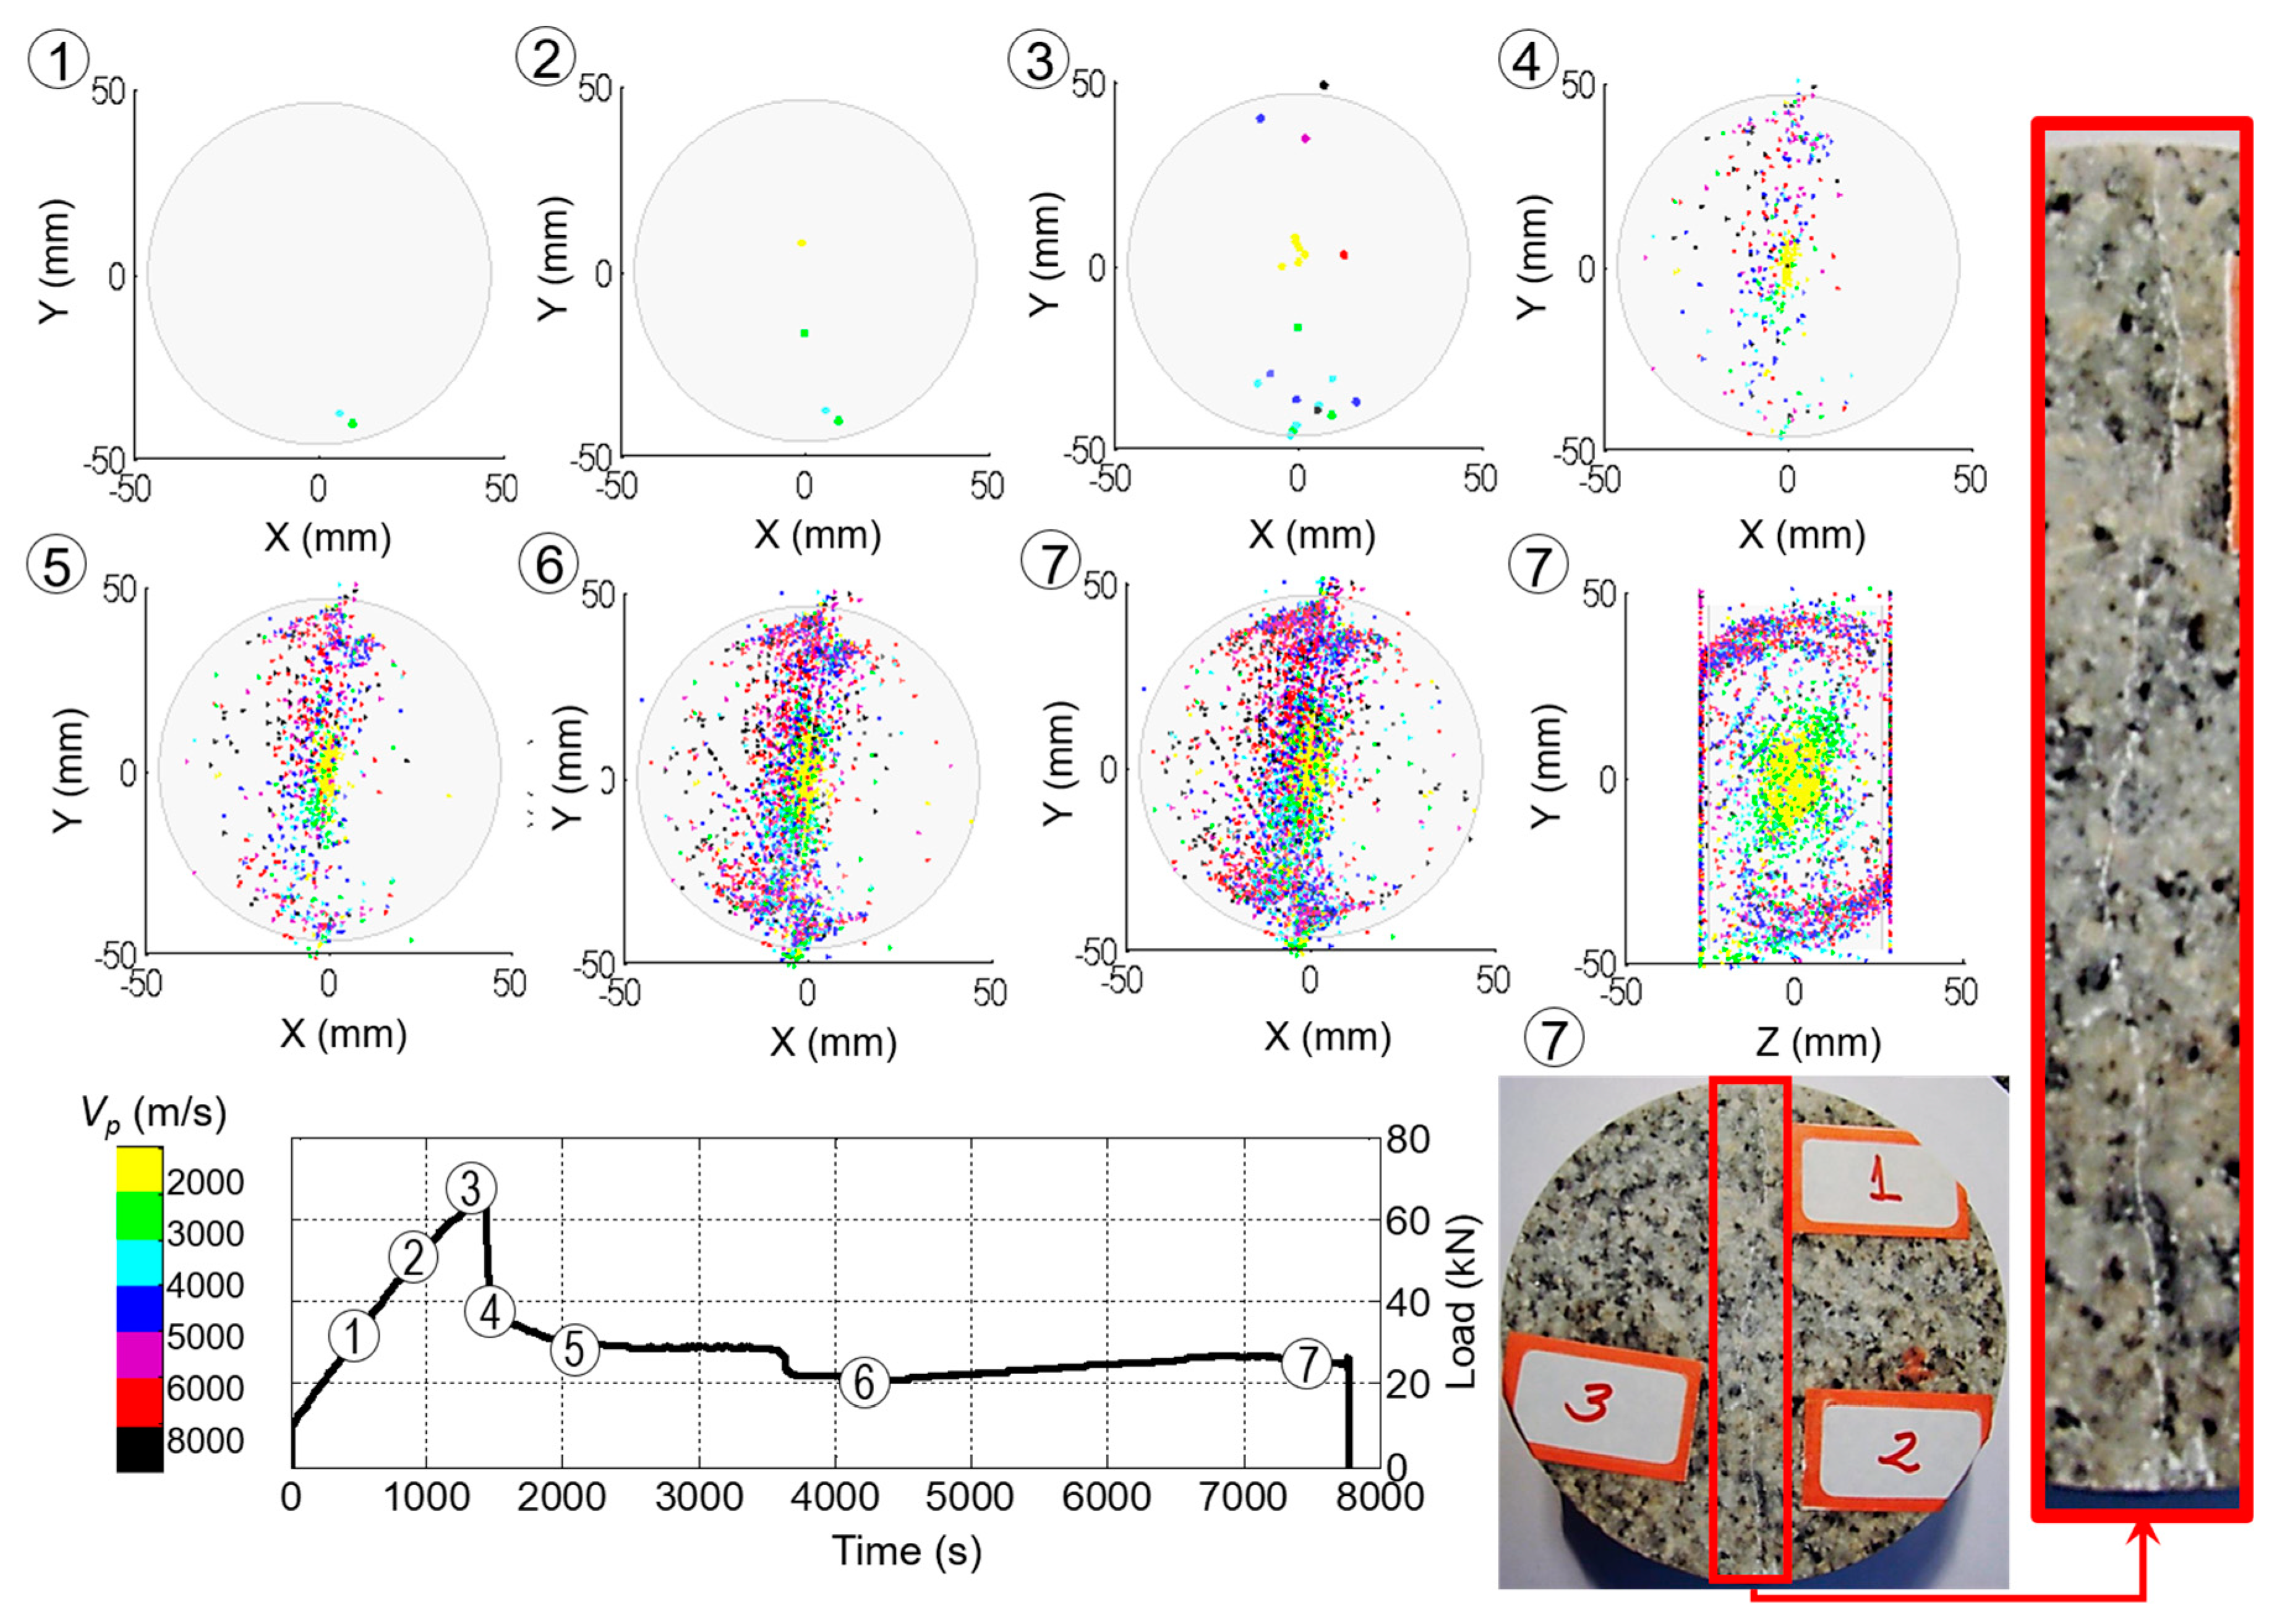
Figure 2 shows the spatial distribution of
vp values associated to each AE source during one test.
Figure 2 displays seven control points, 1 to 7, representing loading stages at which variation of
vp inside of the specimen is presented (see load-time relationship at the bottom right of the figure). Control Points 1 to 3 are located at 50%, 75% and 100% of the peak load, respectively. Control Points 4 to 7 show different post peak stages of loading, including the end of the test. The different ranges of
vp values inside of the specimen are represented by a color scale, which is shown at the bottom left of the figure. The size of the dots shown in Images 1 to 3 of
Figure 2 was increased to enable a better visualization of the pattern at the first loading stages, where only a few AE sources were localized. At the end of the test (Image 7), the large amount of AE sources localized might hinder a complete visualization of the pattern of
vp values in an XY plane. For the sake of clarity, a lateral view at the same stage (YZ plane) is shown at the middle right of the figure. In addition, a photograph of the final cracked specimen at the end of the test (Control Point 7) has been included at the bottom right of the figure.
Image 1 of
Figure 2 shows only two AE sources localized at the region of contact between the specimen and the loading platens. Their location and the low levels of absolute energy released at this stage (see also
Figure 3f) suggest that they are not related to the initiation of microcracking but to the process of adjustment between loading platens and specimen during initial loading stages.
From control point 2 onwards, AE sources with
vp values lower than that of the intact condition (4659 m/s) accumulated at the center of the specimen. Their
vp values and the higher levels of E
A released (see
Figure 2h) suggest they are associated with initiation and propagation of microcracking.
Images 2 to 7 of
Figure 2 show that during the test a central damage core is generated. Such zone is composed by AE sources with
vp values much lower than that of the intact condition and lower than any other zone of the specimen. Images 7 (planes XY and YZ) show the clear damaged core zone, while the region of contact between the specimen and the loading platens show
vp values similar and even higher than that of the intact condition. Also, the region close to the faces of the specimen shows
vp values that oscillate around that of the intact condition. The pattern shown in Images 7 of
Figure 2 is in good agreement with the general cracking pattern of the real rock specimen (bottom right of
Figure 2).
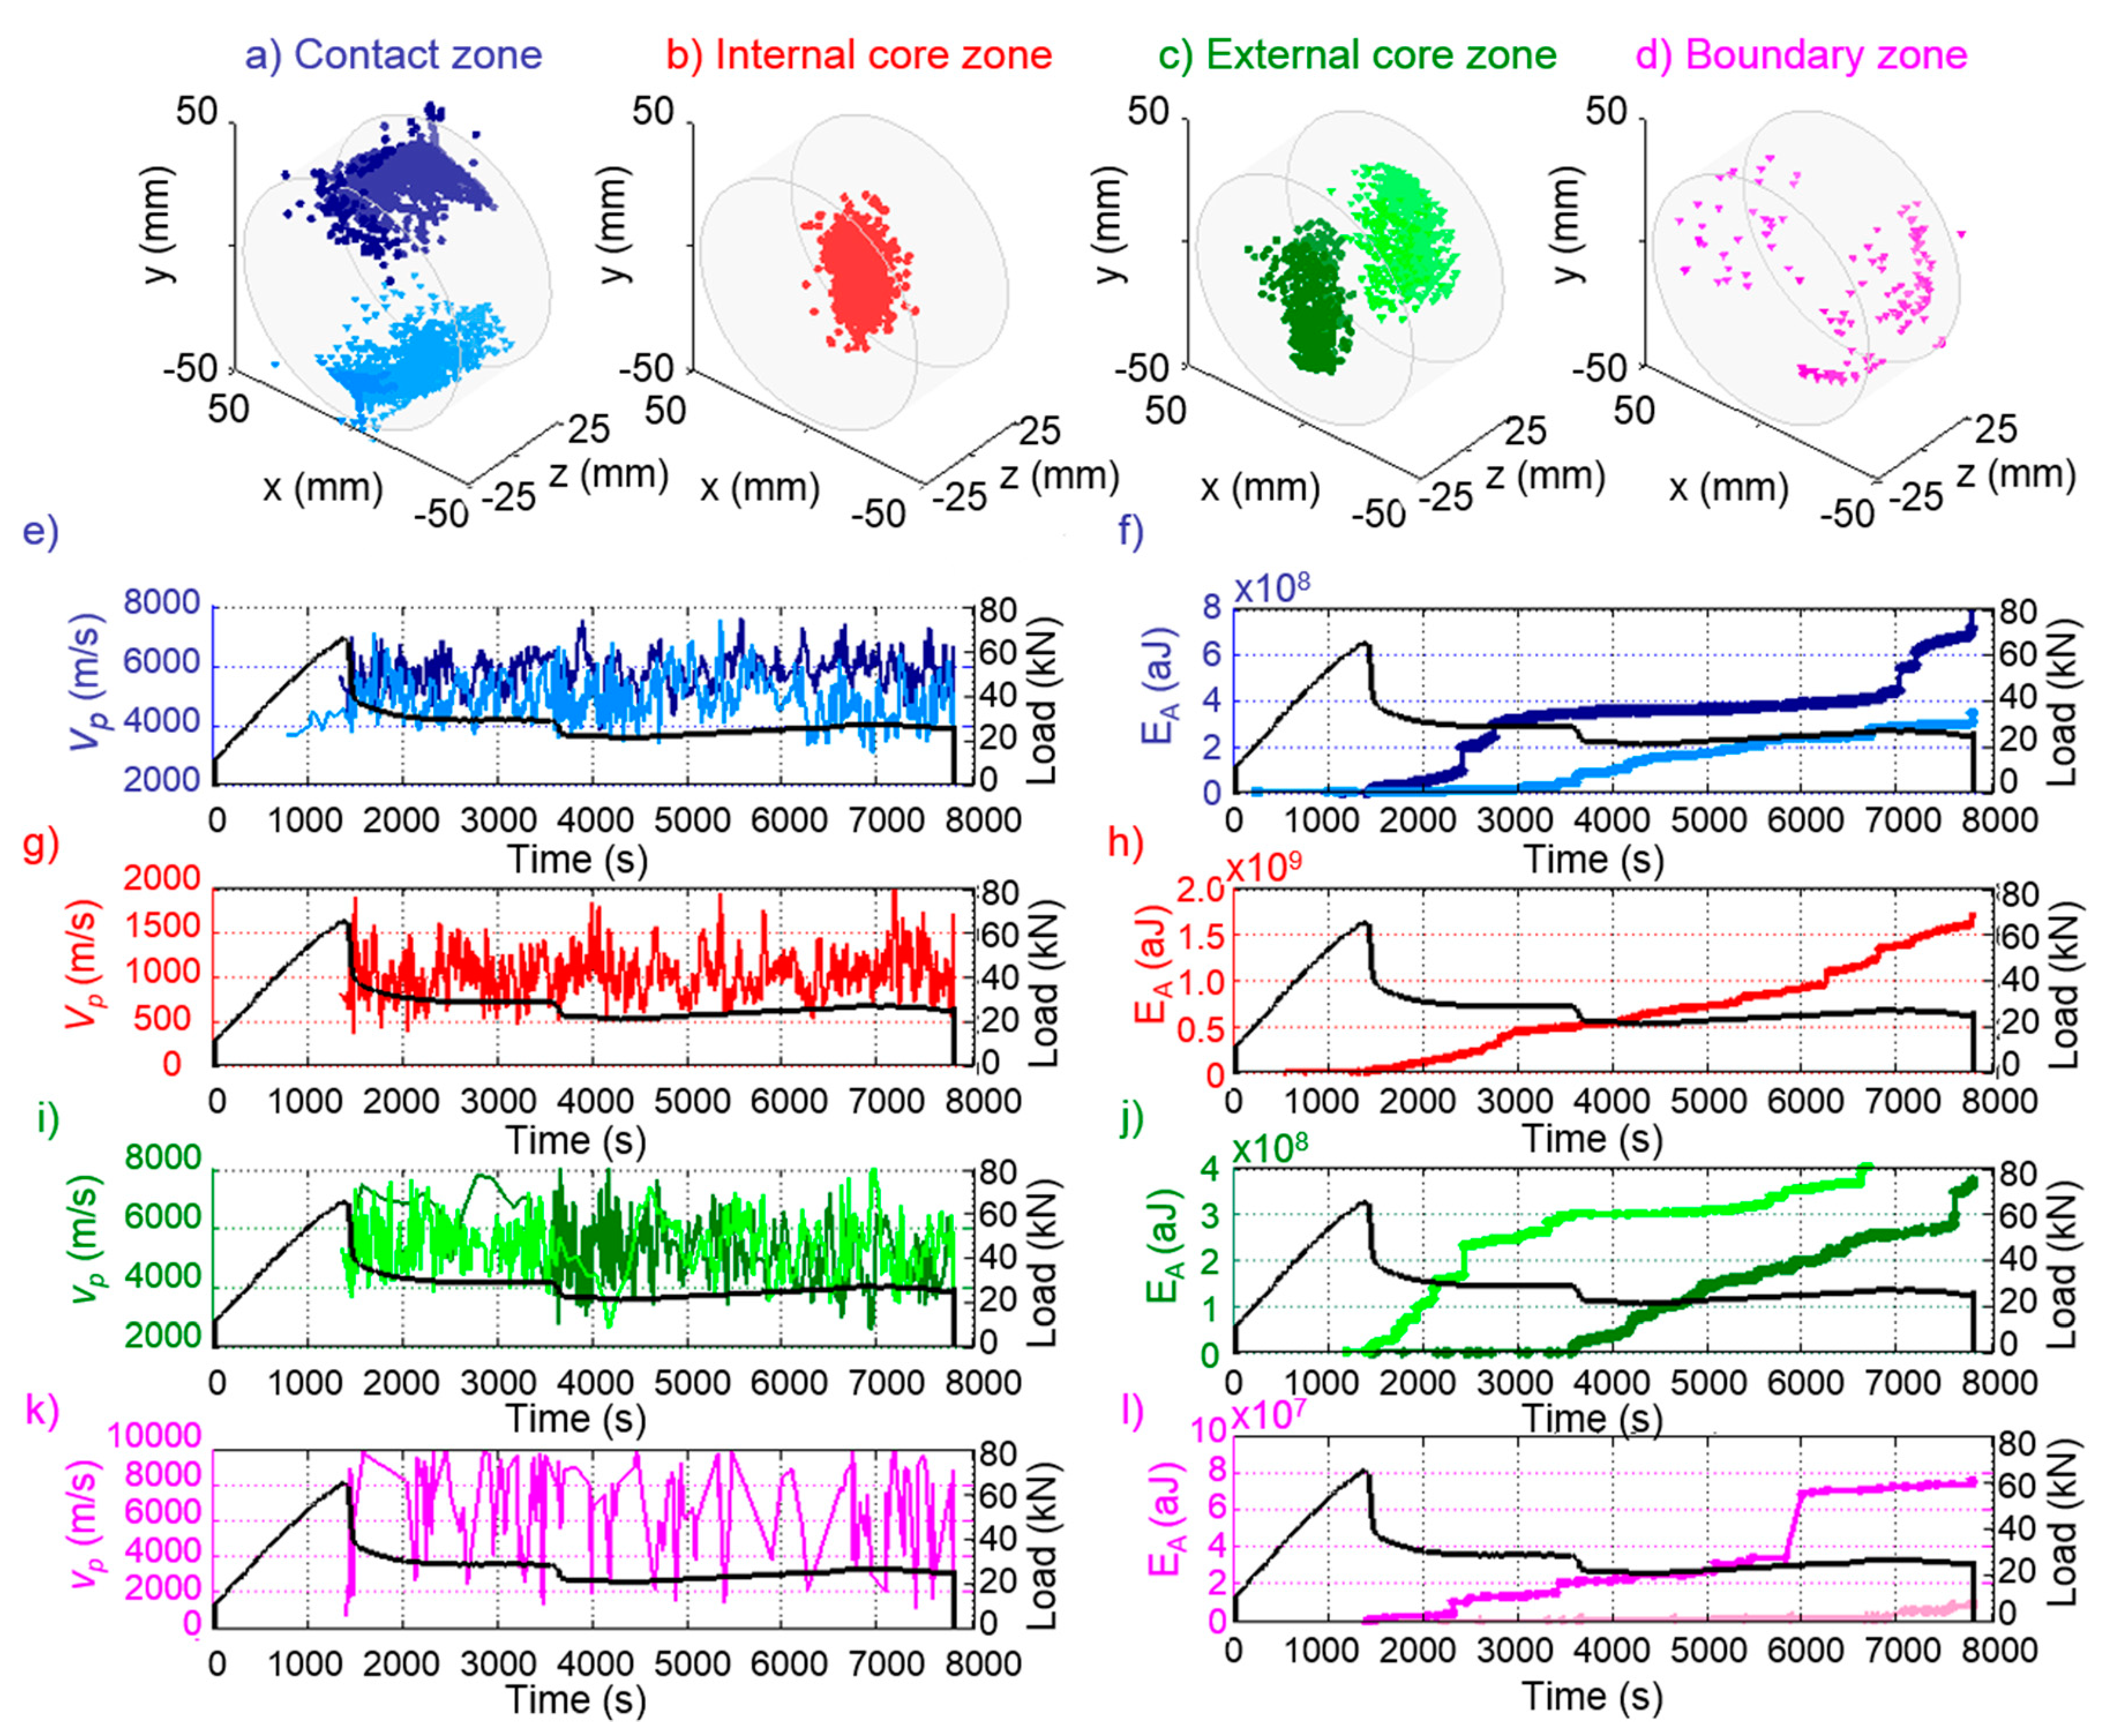
By performing complementary analyses of the
vp values, the pattern of AE sources and the accumulated E
A of each AE source, four zones of damage accumulation with different characteristic were identified: contact region (blue sources,
Figure 3a), internal core (red sources,
Figure 3b), external core (green sources,
Figure 3c), boundary zone (pink sources,
Figure 3d). The contact zone contains the AE sources located close to the region of contact between the specimen and the loading platens; the internal core contains the AE sources located in a close vicinity of the center of the specimen; and the external core contains those located in the central region of the specimen, but close to its faces. Those three zones are located along the loading axis, defining the typical failure surface observed in diametral compression tests (see photograph at the bottom right of
Figure 2).
The
vp values are calculated for each AE source localized by means of a process that involves the minimization of the adjustment error. In addition, each
vp value is associated with a region in the specimen volume limited by the AE source and by the sensors taken to localize it. The integrity of such region changes with the loading process. Therefore,
vp values change along the process, even for data coming from the same zone. For that reason, analyses of
vp values representative of the different zones at different loading stages shown in
Figure 3e,g,i,k are performed considering the trend of a moving average and not every single value.
Figure 3e shows that AE sources are first localized at the contact zone (at the bottom part of the specimen for this test, but in other tests it initiates at the top). The values of
vp associated with the first AE sources are close to that of intact material, but as the load increases,
vp also increases, showing the effect of confinement induced by the loading platens in the specimen. Theoretical expressions [
11,
12] as well as numerical simulations [
13], both performed considering specimens of homogeneous material subjected to diametral compression, showed that stresses on the X-axis are compressive close to the region of contact between the specimen and the loading platens. Also, in diametral compression tests, when a compressive load is applied along the Y-axis of the specimen, the higher stiffness and Poisson’s ratio of the loading platens in comparison with those of the rock specimen induce compressive stresses along the Z-axis in the region of contact. Therefore, a three-dimensional confinement effect develops in that region, which increases with loading. The confinement increases the stiffness of the specimen in this zone, producing
vp values similar to or even higher than those of the intact specimen condition. As the load increases, so does the damage in this contact zone (See
Figure 3e,f), therefore, the
vp value stabilizes instead of increasing through the end of the test.
Figure 3g,h suggest the generation of a damaged central core, with the lowest
vp values of the specimen (much lower than that of the intact condition) and the highest levels of E
A release. As expected for this type of test, the central core zone shows the main concentration of damage (approximately 55% of the AE sources localized throughout the test) and the highest stiffness decrease.
In the external core zone (
Figure 3i), the associated
vp values oscillate around the
vp of the specimen in the intact condition, even though microcracking progresses in this zone (high levels of E
A in
Figure 3j). This behavior is explained by considering that the waves generated in the external core zone have to travel through highly damaged zones and other almost undamaged zones to reach the sensors.
The natural microscopic heterogeneity of the specimens explains the slightly asymmetrical distribution of damage on the faces of the specimen (E
A in
Figure 3f) and at its top and bottom (E
A in
Figure 3j).
The boundary zone (
Figure 3d) is a region with secondary microscopic cracking, generated as a result of the main damaging process developed through the failure surface. After the failure surface has been created following the loading axis of the specimen, the bending of its two halves may induce tension at the external borders, outside the center of the specimen.
Figure 3d shows scarce AE sources localized in this boundary zone (less than 2% of the total of AE sources localized during the entire test). Secondary microcracking is consistent with the existence of AE sources in this zone only at later stages of the test (after damage has progressed through the other three zones); and with the low level of EA associated to them (100 times lower than those of the internal core and 10 times lower than those of the external core or contact region). The low number of AE sources in this zone and the strong influence of the other three zones on the trajectory of waves from the source to the sensors does not allow the visualization of a clear pattern of
vp values.


