Abstract
Accurate determination of the mechanical properties of asphalt concrete is very important in Road Engineering. The traditional method to calculate these properties is to run experiments using a hydraulic/pneumatic actuator and strain gauges to apply stress and measure the strain. However, in the last decade optical measurement techniques have become popular for strain calculation on the surface of the specimen and detecting the cracks on the surface. In this study, digital image correlation is used to estimate the strain map on the surface of an asphalt specimen, predict the location of crack initiation, and investigate the healing phenomenon in asphalt concrete.
1. Introduction
Asphalt concrete is a heterogeneous material that consists of aggregates, bitumen and air voids. These components constitute a complex microstructure with viscoelastic characteristics. One of the main characteristics of asphalt is its healing ability. At low temperatures, the dominant mechanism of damage of asphalt concrete is microcrack formation, growth and ultimately formation and propagation of macrocracks. However, once a crack is formed in the pavement, it starts healing and if it has enough time to complete the process it can even close completely [1]. This property of asphalt is directly linked to the temperature and rest periods and can strongly influence the fatigue life of the specimens [2]. The significance of healing is proven through laboratory testing during which very significant recoveries of pseudo stiffness have been demonstrated following rest periods [3] or fatigue experiments when the fatigue life is increased by adding resting times to the procedure [4,5]. Acquiring more insight into the fracture behavior and healing of asphalt mixtures is essential to predict and improve the fatigue resistance of asphalt pavements. In the last decade, two-dimensional digital image correlation (2D-DIC) has become more popular for applications on asphalt [6,7]. One of the applications of this method is to investigate the crack formation and propagation in asphalt pavements [8]. DIC has also been used to investigate the healing mechanism in other materials, like concrete [9].
In this research, a procedure is developed to investigate the strain map on the surface of a cylindrical asphalt concrete and find its relation to the crack formation and fatigue fracture of the specimen during indirect tensile fatigue tests. Furthermore, by monitoring the maximum strain on the surface of the specimens the effect of microdamage healing due to rest periods on fatigue life is investigated.
This paper is divided into four sections. The first section includes the introduction and state of the art of the research. Section 2 explains the production and preparation of the test specimens and experimental setup. In Section 3, the measurement results and detailed analysis of the images to investigate the crack propagation and healing are presented. Finally, conclusions of the research are given in the last section.
2. Materials and Methods
2.1. Specimen Prepration
Laboratory specimens were compacted according to EN 12697-31:2007 using an IPC Servopac Gyratory Compactor. For this study, identical asphalt concrete mixture (AC14) samples with diameter of 100 mm and thickness of 40 mm were made.
The surface treatment adopted for asphalt mixtures consists of a black speckle pattern painted on the surface of the specimens, resulting in a homogeneous random texture while keeping the cut surface of the specimen visible for further analysis of the crack’s growing path according to the aggregate-binder structure of the specimen.
After the paint is dried, a positioning rig is used to glue two stripes on two sides of the specimens. These stripes hold two Linear variable differential transformers (LVDT) to measure the horizontal deformation during the experiments.
2.2. Experimental Setup
The experiments were designed based on the test described in EN 12697-24 Annex E (Indirect tensile fatigue test on cylindrical shape specimens), and were conducted with a DTS-30 servo-hydraulic Dynamic Testing System (Universal Testing Machine—UTM). The specimen was conditioned for four hours in a Votsich climate chamber. After the specimen gets to the desired temperature (20 °C), a haversine load with an amplitude of 350 kPa was applied repeatedly under a certain loading time and rest time in each cycle (Figure 1).

Figure 1.
Sketch of the loading signal with 100 ms loading time and 400 ms resting time.
As it can be seen in Figure 2, the front LVDT covers part of the surface of the specimen in camera view. Therefore, two cameras were set up in front of the specimen with an angle, to have a full view of the surface.
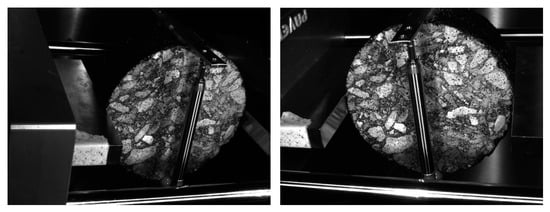
Figure 2.
Camera views.
The cameras are GigE uEye UI223xRE-M IDS, with resolution of 1024*768 and frame rate of 30 fps in full resolution. As shown in Figure 3, each camera was aligned with two LED spots to generate the proper lighting condition for the images (stereoscopic approach). A break out cable was soldered to read the load signal from Pavetest’s compact Control and Data Acquisition System (CDAS). This signal was amplified using an AM 502 Differential Amplifier and sent to the national instrument NI USB-6343 Multifunction DAQ, as a trigger signal. Using that, cameras and LED spots were triggered twice in every load cycle, once when the applied load was at its maximum and once during the rest period. Moreover, the cameras capture images with a 20 ms delay after receiving a pulse; therefore to have a perfect synchronization between the cameras and LED spots, the cameras were triggered 20 ms before the LED spots. The cameras were focused manually and the exposure time was set accordingly, to have the best brightness in the images. The cameras were calibrated using an AI-08-BMB_9*9 Dantec Dynamics calibration plate and Istra 4D software. During each experiment 2001 images were acquired with each camera. The first image was captured before the experiment starts as a reference image and the rest were captured using a logarithmic relation between number of image and number of cycles so more photos are captured at the end of the experiment when the cracks propagate faster.
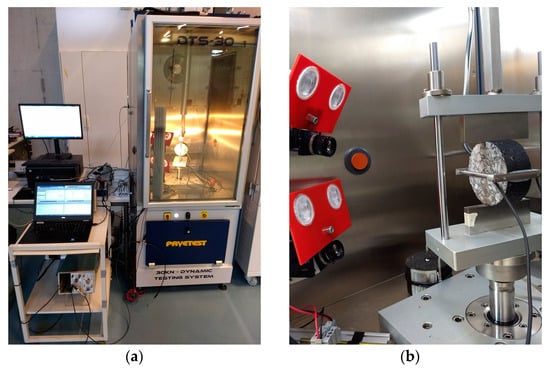
Figure 3.
Experimental set up; (a) UTM (b) Specimen, cameras and LED spots placed inside the UTM.
The experiments of this research can be divided in three sections: First, a fatigue test was conducted to investigate the relationship between the strain map on the surface and the cracks in asphalt concrete. Then, to investigate the healing of asphalt, two sets of experiments were conducted on two identical specimens. The experiments are similar, except the resting time between each loading cycle is 100 ms in the first and 400 ms in the second experiment. The last experiments were also conducted on two identical specimens, both having 100 ms resting time between loading cycles, and one of them having 1 h of resting time after every 5000 cycles until 65,000 cycles and then without any extra resting periods until reaching the termination condition. During the resting time between 5000 cycles the load is taken off the specimen but the weight of the loading strip remains on top of the specimen. Moreover, the temperature of the chamber remains constant (20 °C) during the resting time. The termination parameters of the experiments were to reach to the desired number of cycles, twice of the initial strain level or failure of the specimen.
3. Results and Discussions
The acquired images during the experiments are processed with Istra 4D software to obtain the strain map on the surface. The facet size and grid spacing are set 23 and 8 Pixels respectively.
3.1. Full-Field Strain and Crack Detection
Figure 4 illustrates the calculated strain on the surface of the specimen in three different step of the experiment (726, 18,998 and 30,118 cycles). It is evident that after some time, locations with maximum local strain appear on the surface. The location of these maximum local strains remain the same until a crack appear on that position and propagates (Figure 5). These cracks mainly occur at the interface of the aggregate-mortar matrix and the contour line of maximum strains matches very well with the fracture path. Moreover, as expected, due to the difference between the module of elasticity of the aggregate and binder, the strain values on the binders are larger than the strains on the aggregates.

Figure 4.
y-direction strain map of the specimen during indirect tensile fatigue test at (a) 726, (b) 18,998 and (c) 30,118 cycles.
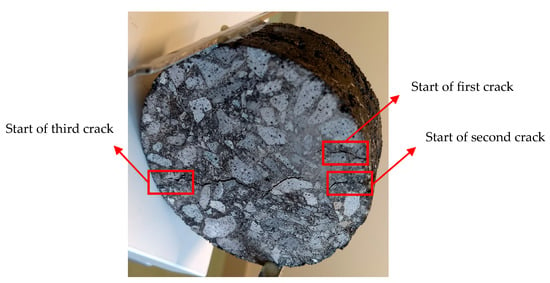
Figure 5.
The specimen after total fracture and location of initiation of each crack.
3.2. Resting Time between Each Cycle
In this step two sets of experiments with different resting times between each cycle were conducted. The resting time of first and second experiment were 100 ms and 400 ms respectively. During the experiments maximum local tensile strain on the surface of the objects were estimated by DIC and resilient modulus was calculated by the UTM. Figure 6 shows that the maximum local strain increases faster when the resting time between each cycle is lower. Furthermore, resilient modulus of the specimen decreased faster for the experiment with lower resting time which is in-line with the results of other studies in literature [4]. This behavior can be explained by the healing of the asphalt specimens during the resting time. So when the resting time is longer, the specimens have more time for healing. In order to better observe the healing phenomenon and the effect of the resting time, the experiment of the next section was conducted.
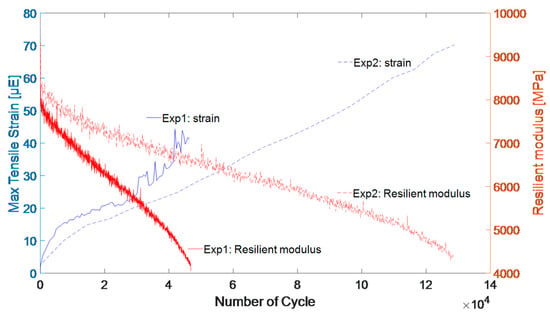
Figure 6.
Maximum local strain on the surface and resilient modulus of the specimens for two experiments; Exp1 (blue): 100 ms resting time, Exp2 (red): 400 ms resting time.
3.3. Rests during the Experiment
In this section, the effect of longer rest periods during the fatigue test was investigated by conducting two experiments. In the first experiment, a loading time of 100 ms was applied with a resting time of 100 ms between each cycle. The second experiment was similar to the first, with the exception of applying a longer resting time of one hour after every 5000 cycles until reaching 65,000 cycles and then without any rest until the specimen reaches to the critical conditions. As it can be seen in Figure 7, after every resting time, there is a resilient modulus recovery and local strain decrease in the specimen. This increased the fatigue life of the specimen from about 47,000 to 79,000 cycles. This can be directly related to healing of the specimen during resting time.
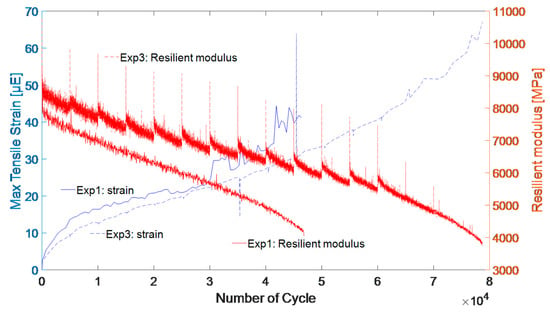
Figure 7.
Maximum local strain on the surface and resilient modulus of the specimens for two experiments; Exp1 (blue): resting time between each cycle = 100 ms, Exp3 (red): resting time between each cycle = 100 ms & resting time between every 5000 cycles (untill 65,000 cycles) = 1 h.
4. Conclusions
The aim of this study is firstly to detect the cracks on the surface of the specimens during indirect tensile fatigue test and secondly to investigate the effect of the resting time on the healing of asphalt. These objectives were accomplished by using DIC method to calculate the strain on the surface of the specimens and relate the maximum local strains to crack initiations. Moreover, to investigate the healing, experiments with and without rest periods were conducted and it was observed that due to the healing phenomenon, the resilient modulus of the specimen can recover and the maximum strain around the crack locations decreases. Therefore, healing increases the fatigue life of the specimen.
Author Contributions
N.H. and B.R. designed the experiments; A.M. and J.B. made the mixtures and prepared them for the experiments; N.H. and A.M. performed the experiments; J.D. provided his knowledge in digital image correlation; N.H. wrote the paper. S.V., C.V. and W.V.d.b. were supervisors of the project.
Acknowledgments
The authors would like to thank the research council of the Faculty of Applied Engineering for granting this project funded by the Everdepoel legacy.
Conflicts of Interest
The authors declare that there is no conflict of interest regarding the publication of this paper. Moreover, the founding sponsors had no role in the design of the study; in the collection, analyses, or interpretation of data; in the writing of the manuscript, and in the decision to publish the results.
References
- García, Á. Self-healing of open cracks in asphalt mastic. Fuel 2012, 93, 264–272. [Google Scholar] [CrossRef]
- Xiao, D. State-of-the-art and prospect for self-healing asphalt concrete. AIP Conf. Proc. 2017, 1864, 020074. [Google Scholar]
- Si, Z.; Little, D.N.; Lytton, R.L. Characterization of Microdamage and Healing of Asphalt Concrete Concrete Mixtures. J. Mater. Civ. Eng. 2002, 14, 461–470. [Google Scholar] [CrossRef]
- Shen, S.; Chiu, H.-M.; Huang, H. Characterization of Fatigue and Healing in Asphalt Binders. J. Mater. Civ. Eng. 2010, 22, 846–852. [Google Scholar] [CrossRef]
- Kim, Y.-R.; Little, D.N.; Lytton, R.L. Fatigue and Healing Characterization of Asphalt Mixtures. J. Mater. Civ. Eng. 2003, 15, 75–83. [Google Scholar] [CrossRef]
- Romeo, E. Two-dimensional digital image correlation for asphalt mixture characterisation: Interest and limitations. Road Mater. Pavement Des. 2013, 14, 747–763. [Google Scholar] [CrossRef]
- Xing, C.; Tan, Y.; Liu, X.; Anupam, K.; Scarpas, T. Research on local deformation property of asphalt mixture using digital image correlation. Constr. Build. Mater. 2017, 140, 416–423. [Google Scholar] [CrossRef]
- Birgisson, B.; Montepara, A.; Romeo, E.; Roncella, R.; Napier, J.A.L.; Tebaldi, G. Determination and prediction of crack patterns in hot mix asphalt (HMA) mixtures. Eng. Fract. Mech. 2008, 75, 664–673. [Google Scholar] [CrossRef]
- Tsangouri, E.; Aggelis, D.G.; van Tittelboom, K.; de Belie, N.; van Hemelrijck, D. Detecting the activation of a self-healing mechanism in concrete by acoustic emission and digital image correlation. Sci. World J. 2013, 2013, 424560. [Google Scholar] [CrossRef]
Publisher’s Note: MDPI stays neutral with regard to jurisdictional claims in published maps and institutional affiliations. |
© 2018 by the authors. Licensee MDPI, Basel, Switzerland. This article is an open access article distributed under the terms and conditions of the Creative Commons Attribution (CC BY) license (https://creativecommons.org/licenses/by/4.0/).