Proceeding Paper

Influence of Micro-Structure on the Fatigue Crack Propagation in Bridge Steel †

1
Institute of Physics of Materials, Academy of Science of the Czech Republic, Zizkova 22 Brno 616 62, Czech Republic
2
Faculty of Civil Engineering, Brno University of Technology, Veveri 331/95 Brno 602 00, Czech Republic
*
Author to whom correspondence should be addressed.
Presented at the 18th International Conference on Experimental Mechanics (ICEM18), Brussels, Belgium, 1–5 July 2018.
Proceedings 2018, 2(8), 470; https://doi.org/10.3390/ICEM18-05373
Published: 19 June 2018
(This article belongs to the Proceedings of The 18th International Conference on Experimental Mechanics)

Abstract

:
The use of high strength steels (HSS) allows designing lighter, slenderer and simpler structures with high structural performance. In general, the use of HSS leads to weight reduction of the whole structure, which compensates the higher cost of such a material comparing to the conventional construction steels. Knowledge of the fatigue resistance of material plays the key role during design and maintenance of the bridge structures. This contribution brings a comparison of the fatigue crack growth resistance of S355 J0 steel. Differences in microstructure and the texture of material structure could generally play a role in the fatigue crack growth. This study shows that in the case of studied steel texture of material structure has an influence on material fatigue behavior in Paris’ law regime.

Published: 19 June 2018

1. Introduction

Fatigue crack propagation, an important part of the fatigue life of a bridge component, is controlled by the local properties at the crack tip. Therefore, in the case of bridge steels with a heterogeneous microstructure, it is difficult to characterize their fatigue properties since the crack propagates through different microstructural regions with different mechanical properties. By finding the effect of each phase on fatigue crack propagation, fatigue properties of bridge steels can be well understood and consequently optimized.
The aim of this contribution is to compare experimentally obtained fatigue growth rates of long cracks in two different microstructures of S355 J0 steel grade and to determine the influence of chemical composition and structure texture on the behaviour of long fatigue cracks in this steel grade. The fatigue crack propagation is characterized by means of crack growth curves experimentally determined on compact tension (CT) specimens by using ASTM E647 [1] standard. The experimentally obtained results are discussed with results already published in [2,3]. This contribution aims to extend the experimental study done by Seitl et al. published in [4].

2. Theoretical Background
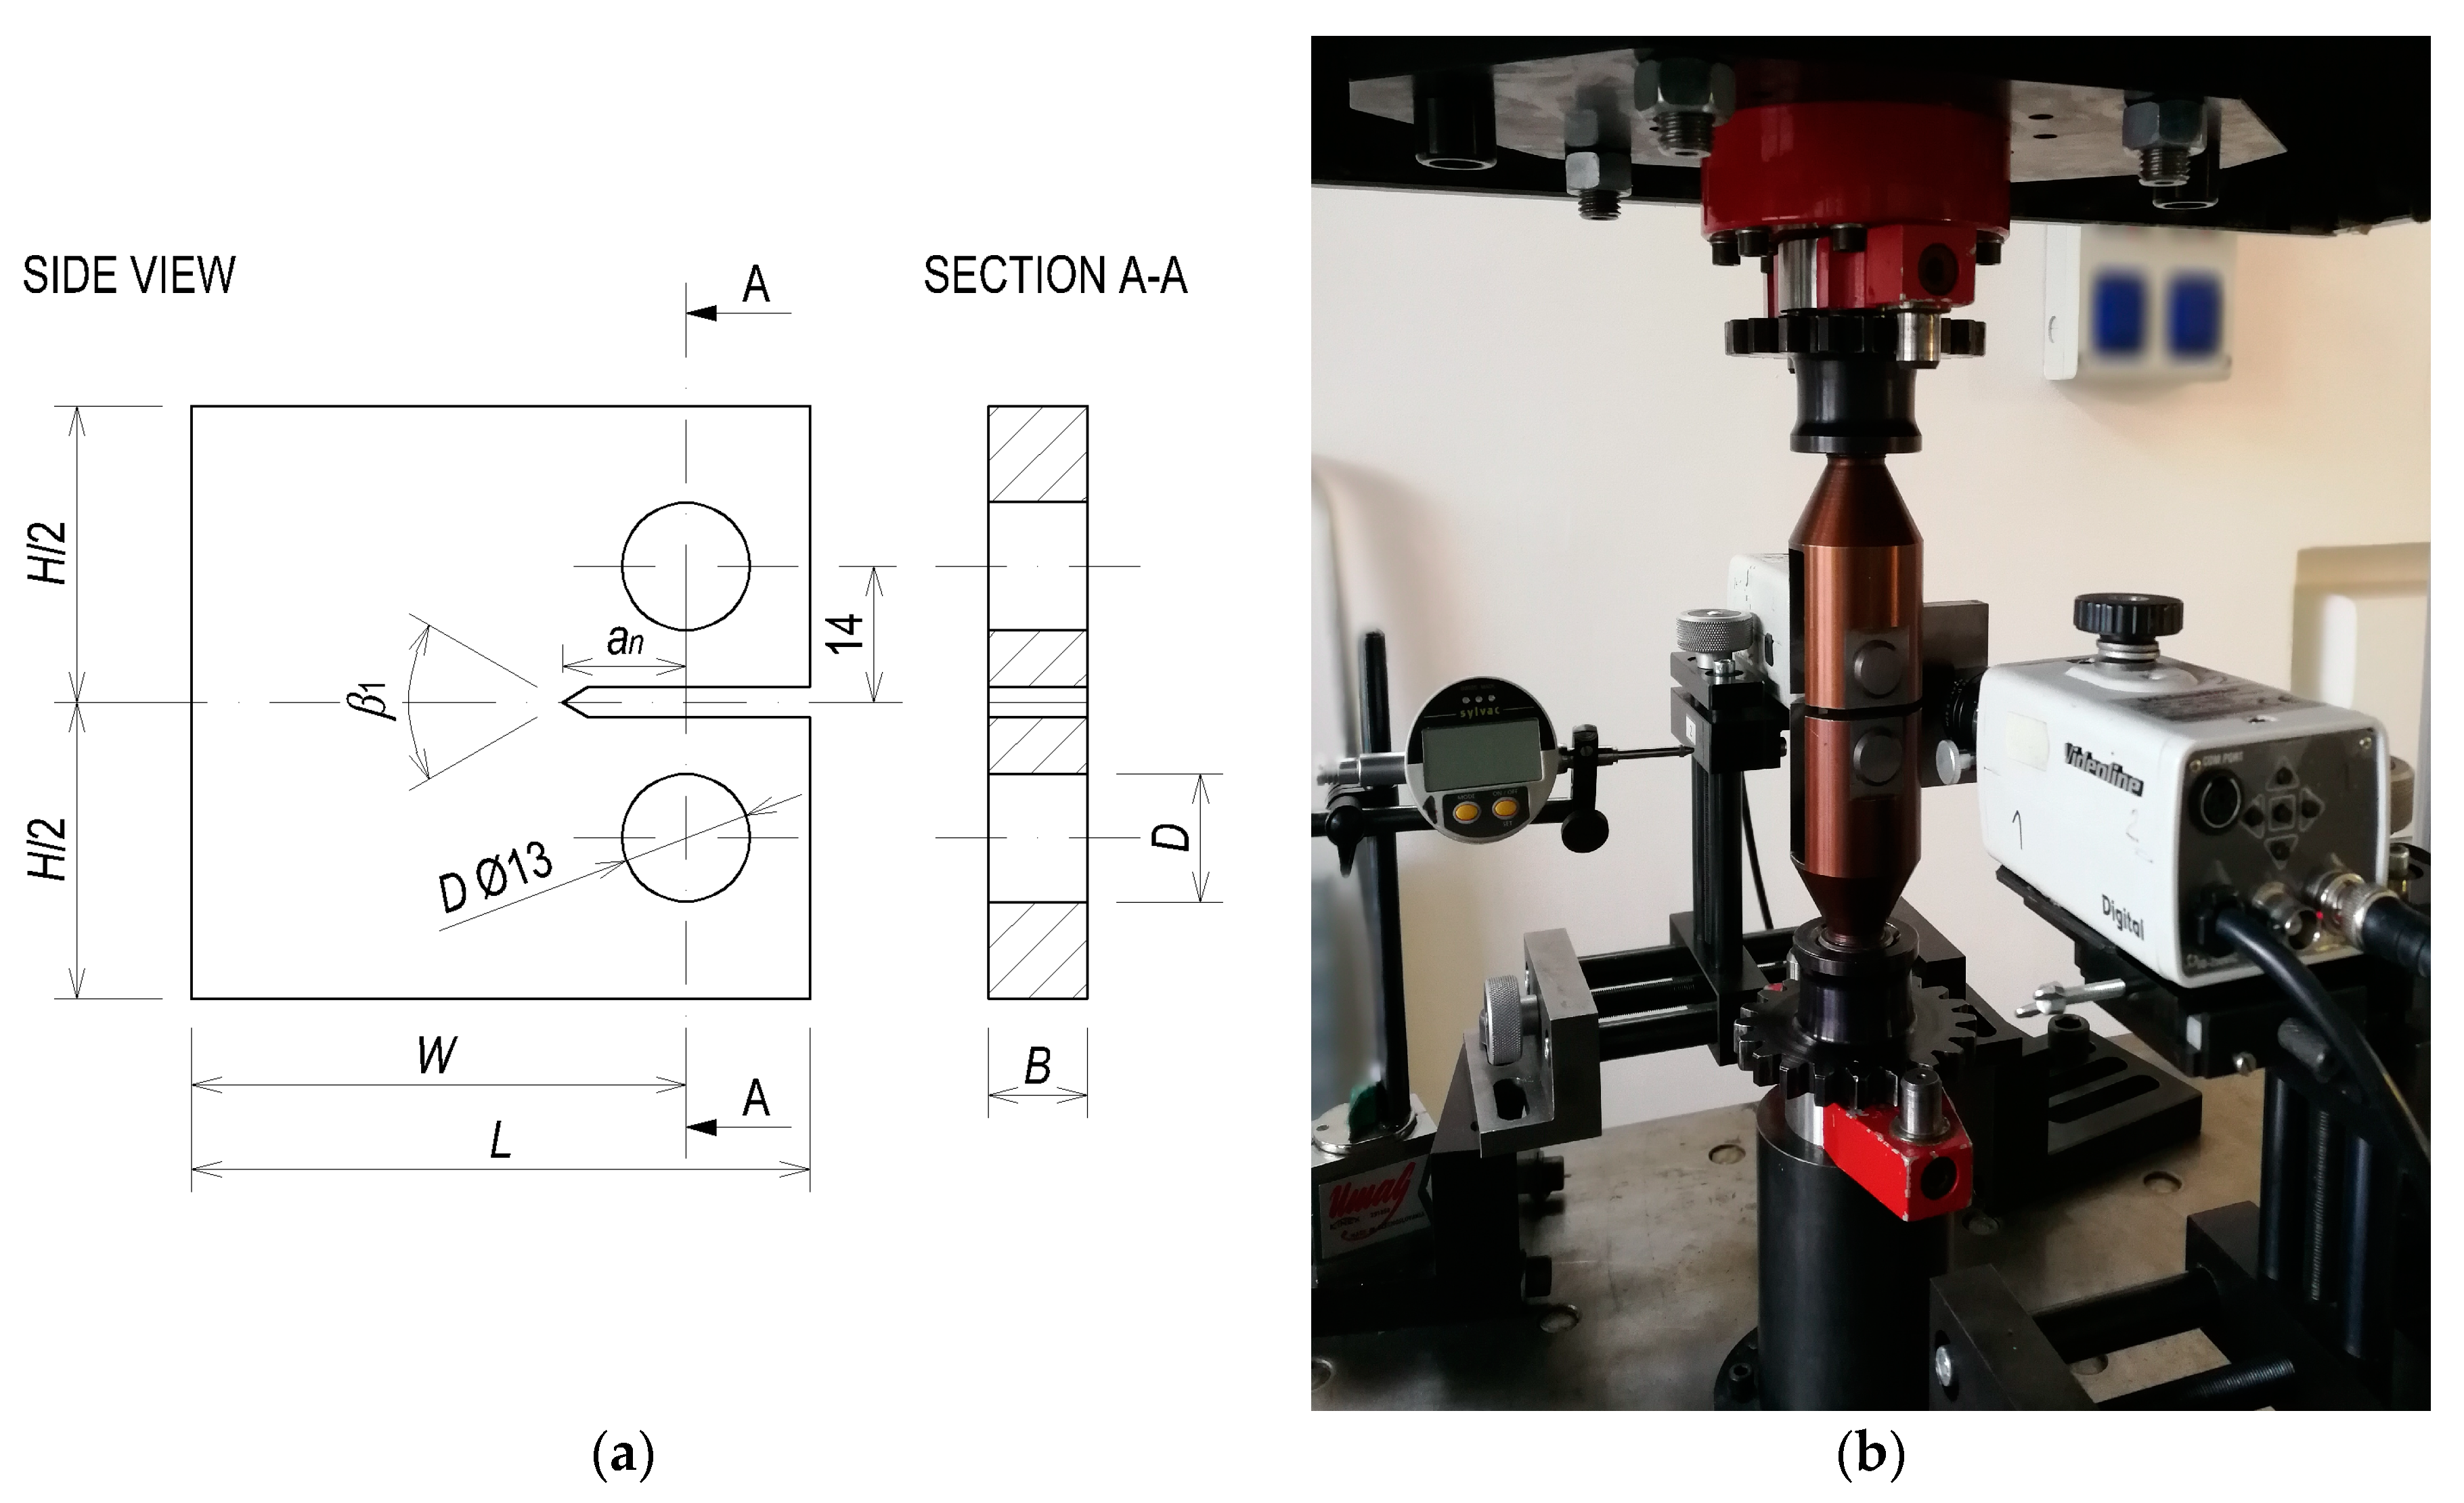
The fracture mechanics-based approach is used for the lifetime prediction of structures with existing cracks. The material characteristic, i.e., the crack growth curve, is experimentally determined on notched specimens, most often on CT specimens. There exist two basic testing approaches for crack growth rate determination which are based either on K-decreasing or on K-increasing procedure (K is the stress intensity factor) [1]. The fatigue crack growth rate for applied loading is defined by the crack length increment for given number of loading cycles. Paris’ law [5], expressed by the Equation (1)
d a d N = C ( Δ K ) m
is often used for the description of the fatigue crack growth. C and m are material constants, da/dN is the fatigue crack growth rate (da—crack length increment, dN—corresponding number of cycles) and ΔK is the stress intensity factor range. The number of load cycles to failure (Nf) can be calculated by integrating the crack propagation between an initial crack length (ai) and critical crack length (ac), Equation (2).
N f = a i a c d a C ( Δ K ) m   ,
The stress intensity factor ranges for cracks in CT specimens can be computed using Equation (3) according to ASTM E647 Standard [1].
Δ K = Δ F B W ( 2 + α ) ( 1 α ) 3 2 ( 0.886 + 4.64 α 13.32 α 2 + 14.72 α 3 5.6 α 4 ) ,
where α = a/W, a is the crack length, W is the width of the specimen, B is the thickness of the specimen and ΔF is the applied load range. The crack length increment is calculated as an average value of two crack length measurements performed on both sides of the CT specimen during the experiment. In this study the K-decreasing method according to the ASTM E647 [1] was used to obtain the values near the threshold values. From this point, the constant load value was used for the estimation of the crack growth rate of the tested specimens in the Paris’ region.

CT Specimen

The tested CT specimens (see Figure 1-left) had dimensions: L = 62.5 mm, W = 50 mm, B = 10 mm, D =13 mm, an = 12.5 mm, H/2 = 30 mm and the angle β1 = 60°.
The fatigue crack growth experiments were carried out at a computer-controlled testing machine (Amsler—20 kN, see Figure 1 right). Tests were conducted under load control. The stress ratio R = Fmin/Fmax = 0.1, where Fmin and Fmax refer to the minimum and maximum load of a sinusoidal wave in each cycle. The load frequency used for the tests varied from 96 (for the shortest cracks) to 42 Hz (for the longest cracks). The controlled values for temperature and relative humidity were 23 ± 2 °C and 50%, respectively.

3. Material

The chemical composition of the investigated steel grade is specified in EN 10025-2:2004 standard [6] and is presented in Table 1. Chemical composition of the experimental material was verified by producer and it is in agreement with the standard presented in this paper.
The microstructure of the tested material was created with polyhedral grains of ferrite and pearlite, while the pearlitic colonies are elongated in the rolling direction, Figure 2. The average grain size estimated with linear intersection method was 13.6 ± 1.9 μm for the S355 J0 steel. Small particles present in the grains and on the grain boundaries were observed in investigated specimen.

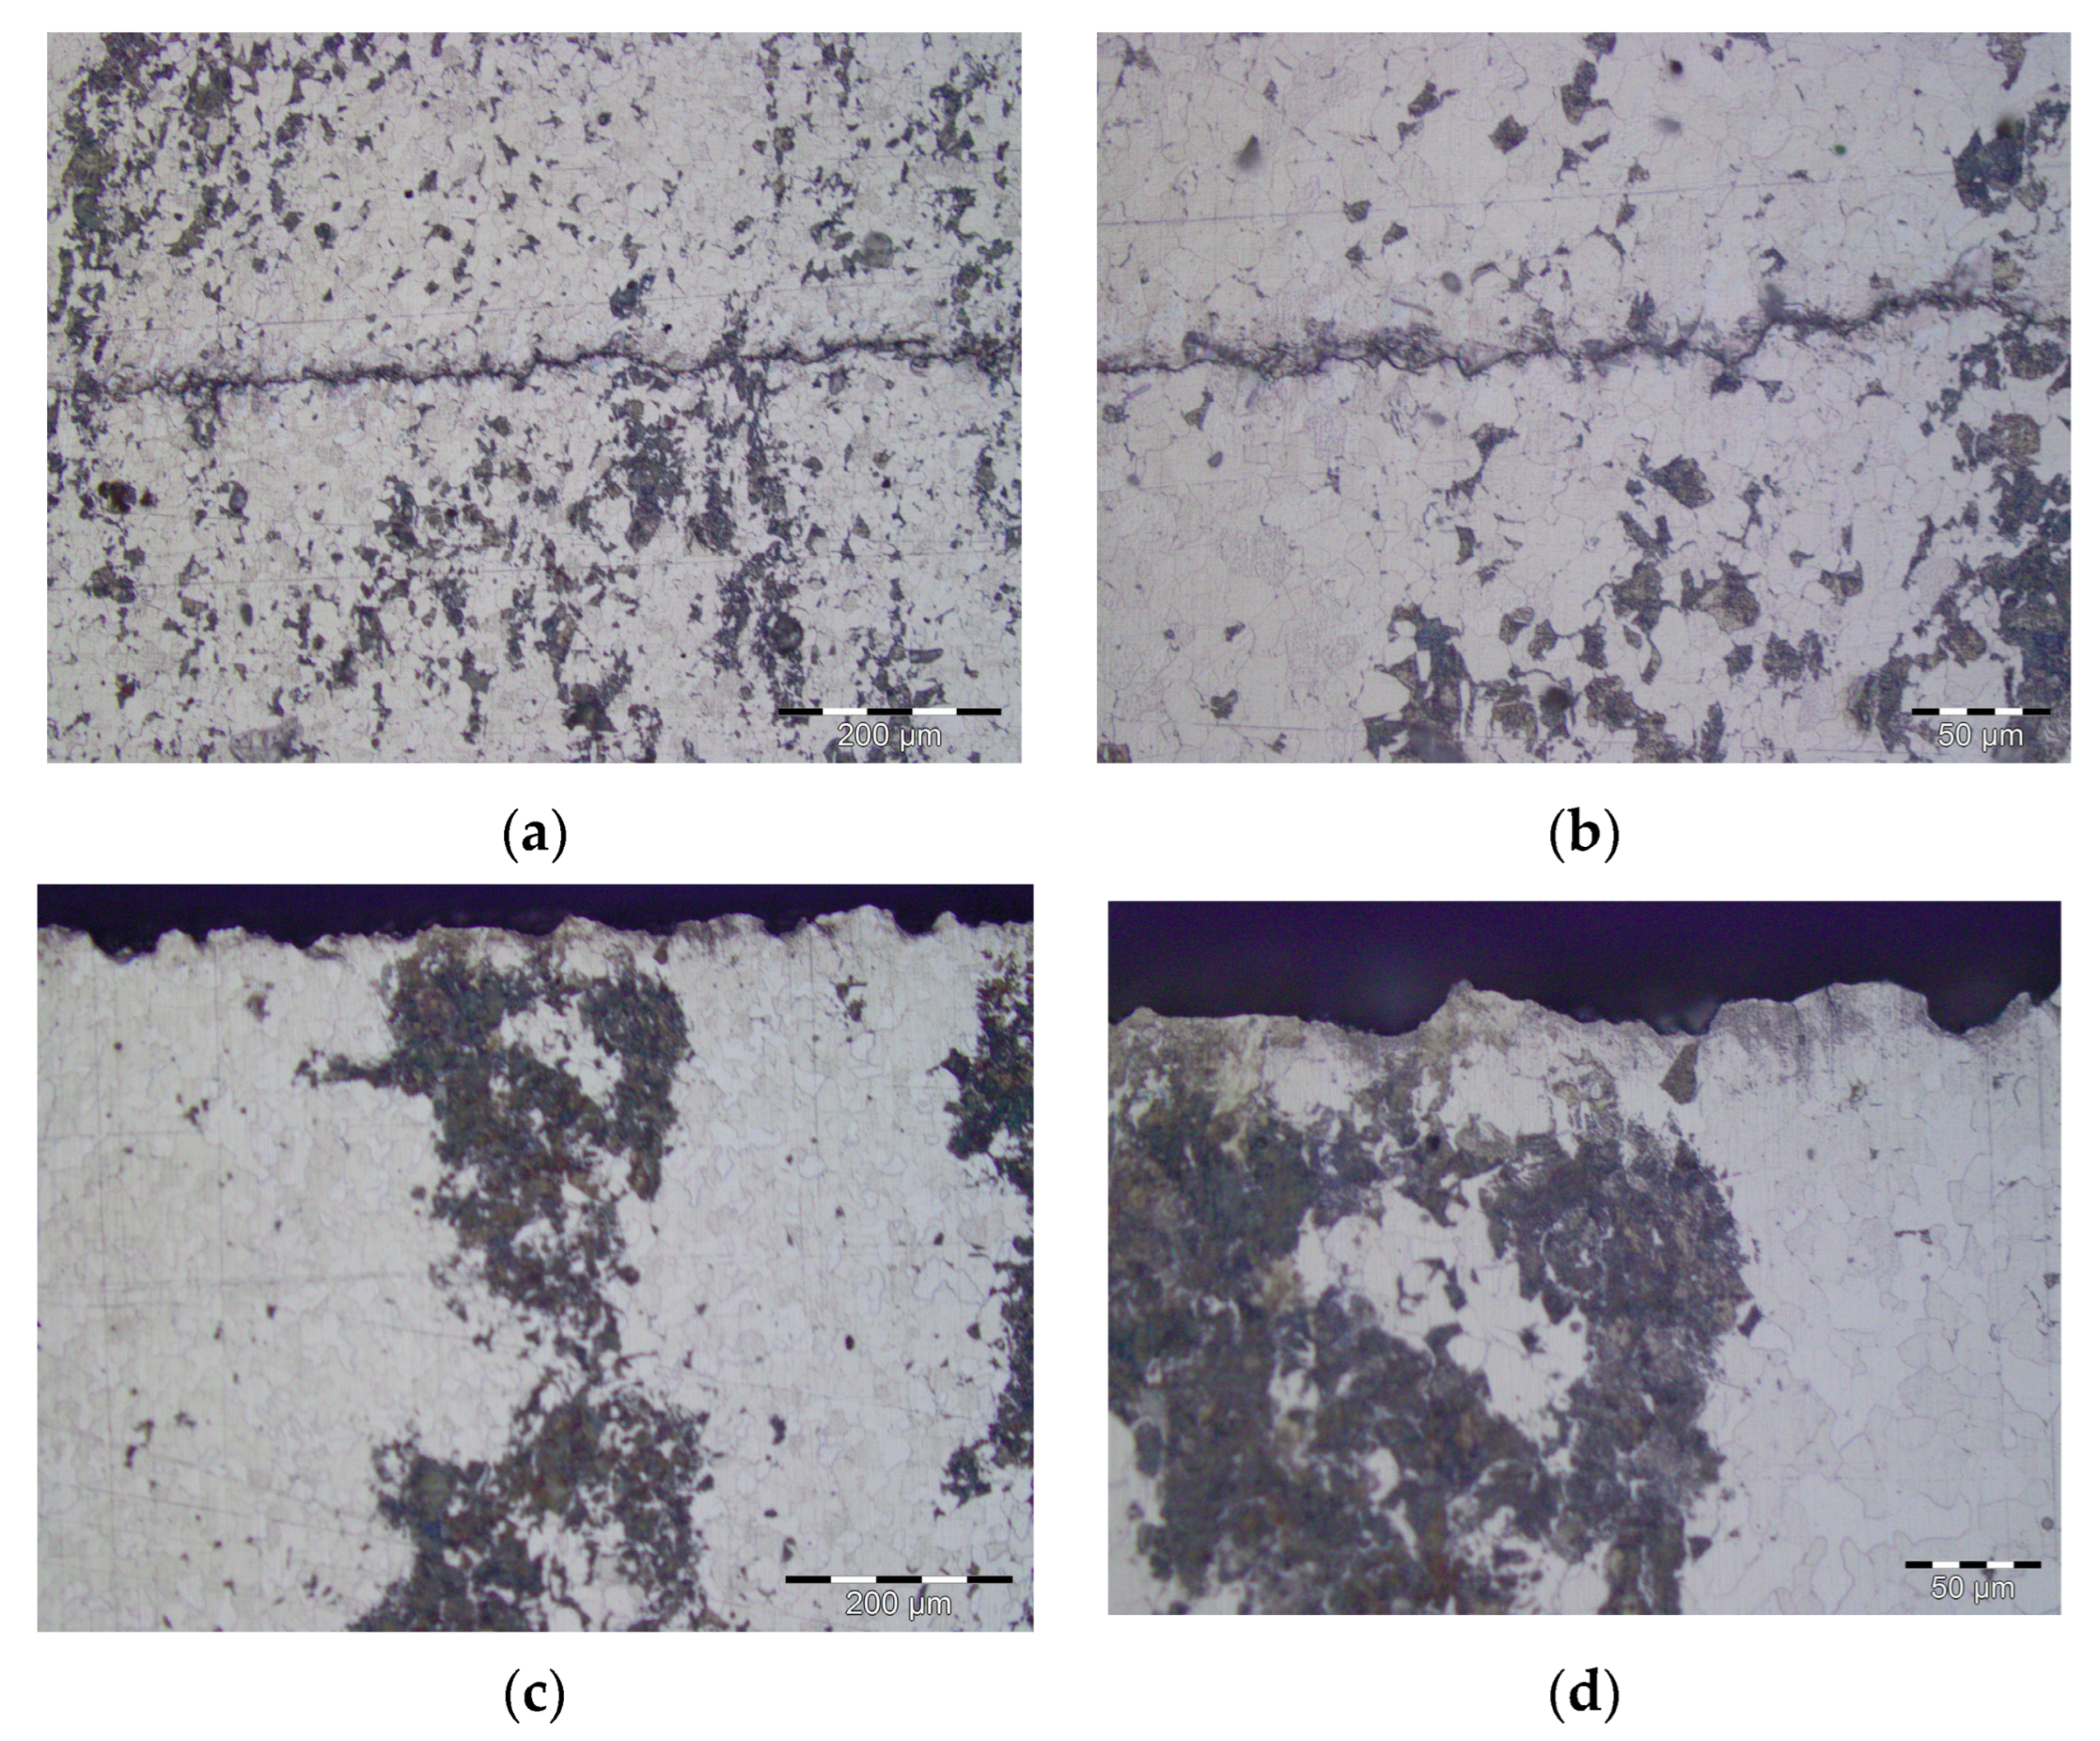
4. Results and Discussion

The experimental measurements were done on two different specimens made from S355 J0 material. These specimens had different surface structure. One specimen showed fine surface structure and the other one showed rough surface structure, therefore specimens were marked as “S355_J0_FM”, “S355_J0_RM” respectively.
The material constants C and m measured from the Paris’ law region of these two specimens were compared to the data published by de Jesus [2]. Values of the exponent m can range from 2.0 to 7.0 with most values being between 3.0 and 4.0 [7]. The measured material constant m shows good agreement with data from literature S355 J0 steel grade, comparison of the experimental data are stated in the Table 2.
To quantify the influence of the microstructure on the fatigue crack grow rate of the S355 J0 steel a crack grow rates under the constant value of ΔKI were measured. The same value of ΔKI was chosen as 20 MPam1/2 then crack growth rates da/dN were measured. The evaluated crack growth rate da/dN for S355_J0_FM is 4.2 × 10⁻⁵ mm/cycle and for S355_J0_RM specimen is 2.5 × 10⁻⁵ mm/cycle. This difference can be seen (marked by dash line) in Figure 3.
For this constant value of ΔKI = 20 MPam1/2 from given position from measurement a microstructure of the specimen was investigated. The difference of microstructure is show in Figure 4.

5. Conclusions

In this paper the influence of the material microstructure on the fatigue crack rates of the S355 J0 steel grade was investigated. This effect can be expressed by means of changes of the material constants in the Paris’ law. These changes of material constants due to microstructure can lead to the significant reduction of fatigue life time of the structure made from steel with fine microstructure. These fatigue properties of S355 J0 will be used in further probabilistic evaluation e.g., [8,9,10] and fatigue modelling for calculation as presented in e.g., [11,12,13,14,15,16].

Author Contributions

S.S., P.M. and J.K. have prepared analyzes and have analyzed the measured experimental data, P.P. has performed experimental measurements and S.F. has captured microstructure of the specimens.

Acknowledgments

This paper has been written with financial support from the project No. 17-01589S supported by the Czech Science Foundation. The second author is Brno Ph.D. Talent Scholarship Holder—Funded by the Brno City Municipality.

Conflicts of Interest

The authors declare no conflict of interest.

References

  1. ASTM E647. Standard test method for measurement of fatigue crack growth rates. In Annual book of astm standards. Am. Soc. Test. Mater. 1991, 3, 591–629. [Google Scholar]
  2. De Jesus, A.M.P.; Matos, R.; Fontoura, B.F.C.; Rebelo, C.; Simões da Silva, L.; Veljkovic, M. A comparison of the fatigue behavior between s355 and s690 steel grades. J. Construct. Steel Res. 2012, 79, 140–150. [Google Scholar] [CrossRef]
  3. Adedipe, O.; Brennan, F.; Kolios, A. Review of corrosion fatigue in offshore structures: Present status and challenges in the offshore wind sector. Renew. Sustain. Energy Rev. 2016, 61, 141–154. [Google Scholar] [CrossRef]
  4. Seitl, S.; Miarka, P.; Klusák, J.; Fintová, S.; Kunz, L. Comparison of the fatigue crack propagation rates in S355 J0 and S355 J2 steel grades. Key Eng. Mater. 2018, after revision in press. [Google Scholar] [CrossRef]
  5. Paris, P.; Erdogan, F. A critical analysis of crack propagation laws. J. Basic Eng. 1963, 85, 528–533. [Google Scholar] [CrossRef]
  6. EN 10025—Part 2: Technical Delivery Conditions for Non-Alloy Structural Steels. In Hot Rolled Products of Structural Steels; Europian Comittee for Standartization: Geneva, Switzerland, 2004; p. 33.
  7. Branco, R.; Antunes, F.V.; Ferreira, J.M.; Silva, J.M. Determination of Paris law constatnts with a reverse engineering technique. Eng. Fail. Anal. 2008, 16, 631–638. [Google Scholar] [CrossRef]
  8. Fernández Canteli, A.; Przybilla, C.; Nogal, M.; López Aenlle, M.; Castillo, E. ProFatigue: A software program for probabilistic assessment of experimental fatigue data sets. Procedia Eng. 2014, 74, 236–241. [Google Scholar] [CrossRef]
  9. Castillo, E.; Fernández-Canteli, A. A Unified Statistical Methodology for Modeling Fatigue Damage; Springer: Berlin/Heidelberg, Germany, 2009. [Google Scholar]
  10. Castillo, E.; Canteli, A.; Siegele, D. Obtaining S-N curves from crack growth curves: An alternative to self-similarity. Int. J. Fract. 2014, 187, 159–172. [Google Scholar] [CrossRef]
  11. Krejsa, M.; Kala, Z.; Seitl, S. Inspection based probabilistic modeling of fatigue crack progression. Procedia Eng. 2016, 142, 146–153. [Google Scholar] [CrossRef]
  12. Kala, Z. Identification of stochastic interactions in nonlinear models of structural mechanics. AIP Conf. Proc. 2017, 1863, 480004. [Google Scholar]
  13. Kala, Z.; Omishore, A. Fuzzy stochastic approaches for analysing the serviceability limit state of load bearing systems. Int. J. Math. Comput. Simul. 2016, 10, 294–301. [Google Scholar]
  14. Krejsa, M.; Koubová, L.; Flodr, J.; Protivinsky, J.; Nguyen, Q.T. Probabilistic prediction of fatigue damage based on linear fracture mechanics. Frattura ed Integrita Strutturale 2017, 11, 143–159. [Google Scholar] [CrossRef]
  15. Krejsa, M.; Janas, P.; Krejsa, V.; Kala, Z.; Seitl, S. DOProC-based reliability assessment of steel structures exposed to fatigue. Perspect. Sci. 2016, 7, 228–235. [Google Scholar] [CrossRef]
  16. Krejsa, M.; Seitl, S.; Brozovsky, J.; Lehner, P. Fatigue damage prediction of short edge crack under various load: Direct Optimized Probabilistic Calculation. Procedia Struct. Integr. 2017, 5, 1283–1290. [Google Scholar] [CrossRef]
Figure 1. CT test specimen—geometry (a) and actual test setup (b).
Proceedings 02 00470 g001
Figure 2. Structure of specimen S355_J0_FM (a) and S355_J0_RM (b) made from the HS S355 J0 grade, the crack was propagating in the horizontal direction; etched with 2% Nital, light optical microscope.
Proceedings 02 00470 g002
Figure 3. Comparison of the fatigue crack growth rates for S355_J0_FM and S355_J0_RM specimens and estimation of the crack grow rates.
Proceedings 02 00470 g003
Figure 4. The comparison of the microstructures with two magnifications 200 μm and 50 μm of the S355_J0_FM (a) 200 μm (b) 50 μm and S355_J0_RM (c) 200 μm and (d) 50 μm at same value of stress intensity range ΔKI = 20 MPam1/2 with various crack propagation rate.
Proceedings 02 00470 g004
Table 1. Chemical composition in percentage by weight (max. wt.%) of the used steel grades according to EN 10025-2:2004 standard [6].
Steel GradeCMn SiPSNCuCEV
S355 J00.21.60.550.0350.0350.0120.550.47
Table 2. The Comparison of material constants C and m, from experimental measurement and literature de Jesus et al. [2].
MaterialC [mm/(cycle⋅MPa⋅m0.5)]m [-]
de Jesus6.0 × 10−103.561
S355_J0_FM1.0 × 10−82.697
S355_J0_RM6.0 × 10−103.553
Publisher’s Note: MDPI stays neutral with regard to jurisdictional claims in published maps and institutional affiliations.

