Proceeding Paper

Damage Identification Using Sub-Microstrain FBG Data from a Pre-Stressed Concrete Beam During Progressive Damage Testing †

by
Dimitrios Anastasopoulos
1,*,
Maure De Smedt
2,
Guido De Roeck
1,
Lucie Vandewalle
2 and
Edwin P. B. Reynders
1
1
Structural Mechanics Section, Department of Civil Engineering, KU Leuven, 3000 Leuven, Belgium
2
Building Materials and Building Technology Section, Department of Civil Engineering, KU Leuven, 3000 Leuven, Belgium
*
Author to whom correspondence should be addressed.
Presented at the 18th International Conference on Experimental Mechanics (ICEM18), Brussels, Belgium, 1–5 July 2018.
Proceedings 2018, 2(8), 462; https://doi.org/10.3390/ICEM18-05367
Published: 18 June 2018
(This article belongs to the Proceedings of The 18th International Conference on Experimental Mechanics)

Abstract

:
Vibration-based damage identification can constitute a successful approach for Structural Health Monitoring (SHM) of civil structures. It is a non-destructive condition assessment method, dependent on the identification of changes in the modal characteristics of a structure that are related to damage. However, the damage identification from the modal characteristics of existing structures currently suffers from a low sensitivity of eigenfrequencies and mode shapes to certain types of damage. Furthermore, the sensitivity of eigenfrequencies to environmental influences may be sufficiently high to completely mask the effect even of severe damage. Modal strains and curvatures are more sensitive to local damage, but the direct monitoring of these quantities is challenging when the strain level is very low. In the present work, the identification of the modal strains of a pre-stressed concrete beam, subjected to a progressive damage test, is performed. Dynamic measurements are conducted on the beam at the beginning of each cycle and its response is recorded with multiplexed Fiber-optic Bragg Grating (FBG) strain sensors. Bending, lateral and torsional modes are accurately identified from dynamic strains of the sub-microstrain level. The evolution of the modal characteristics of the beam after each loading cycle is investigated. Changes of the eigenfrequency values, the amplitude and the curvature of the strain mode shapes are observed. The changes in the strain mode shapes appear at the locations where the damage is induced, and are already identified from an early damaged state.

1. Introduction

Vibration-Based Structural Health Monitoring (VBSHM), can be a successful approach for damage identification and structural condition assessment of civil structures, e.g., bridges, dams and tunnels. A drawback of the method is that it suffers currently from low sensitivity of the eigenfrequencies to certain types of damage, especially to local damage of moderate severity [1]. Moreover, the influence of the environmental factors (e.g., temperature) on eigenfrequencies can be high enough to completely mask the presence of damage [2]. In contrast, modal characteristics obtained from dynamic strain measurements, such as modal strains and modal curvatures, are much more sensitive to local damage [3]. The introduction of fiber-optic sensing systems, that can accurately measure dynamic strains while also offering ease of installation, resistance in harsh environment and long-term stability, contributed to an increased interest in adopting these systems for VBSHM applications [4].
The FBG [5] strain sensors have been successfully used for monitoring civil structures but mainly for measuring of static strains while the amount of sensors used was limited. The current challenge for the VBSHM of civil structures is to find monitoring systems that are easily implemented over large areas, sensitive to local damage, able to measure very small strain values and cost-effective. The FBG strain sensors can provide a good trade-off solution to these requirements. In this context, the aim of this study is to directly measure in a dense grid the very small dynamic strains that occur in civil structures, such as bridges, during operational or ambient excitation and to identify the system characteristics from these data. By tracking the shifts in the values of the characteristics, the identification of potential damage is possible.
The method is presented through application in a progressive damage test (PDT) on a complex, prestressed fiber-reinforced concrete “roof” beam [6]. The beam is monitored with three chains of multiplexed FBG sensors. It is excited with an impulse hammer at low force amplitudes, resulting in dynamic strains of sub-microstrain amplitude. Dynamic tests are performed at the end of each loading cycle and the data are used in a strain-based modal analysis. The obtained dynamic characteristics of the various damage stages are then compared and shifts in their values are related to the presence and location of structural damage.

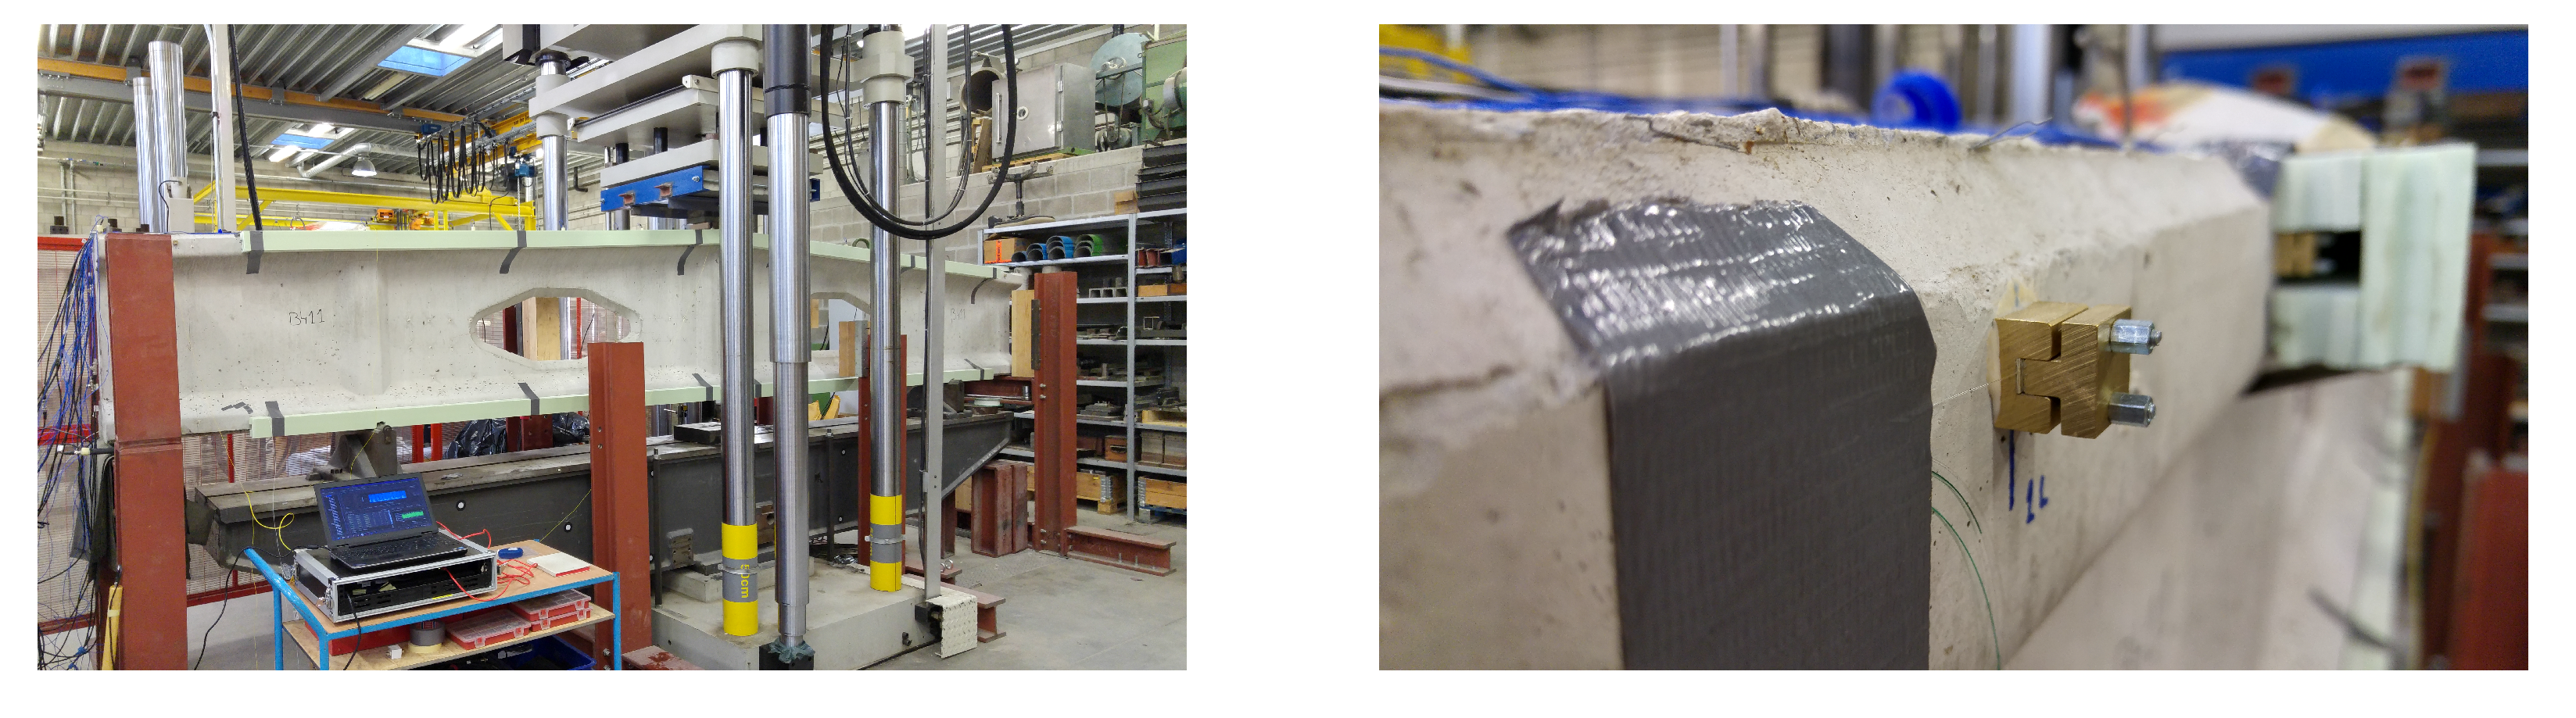
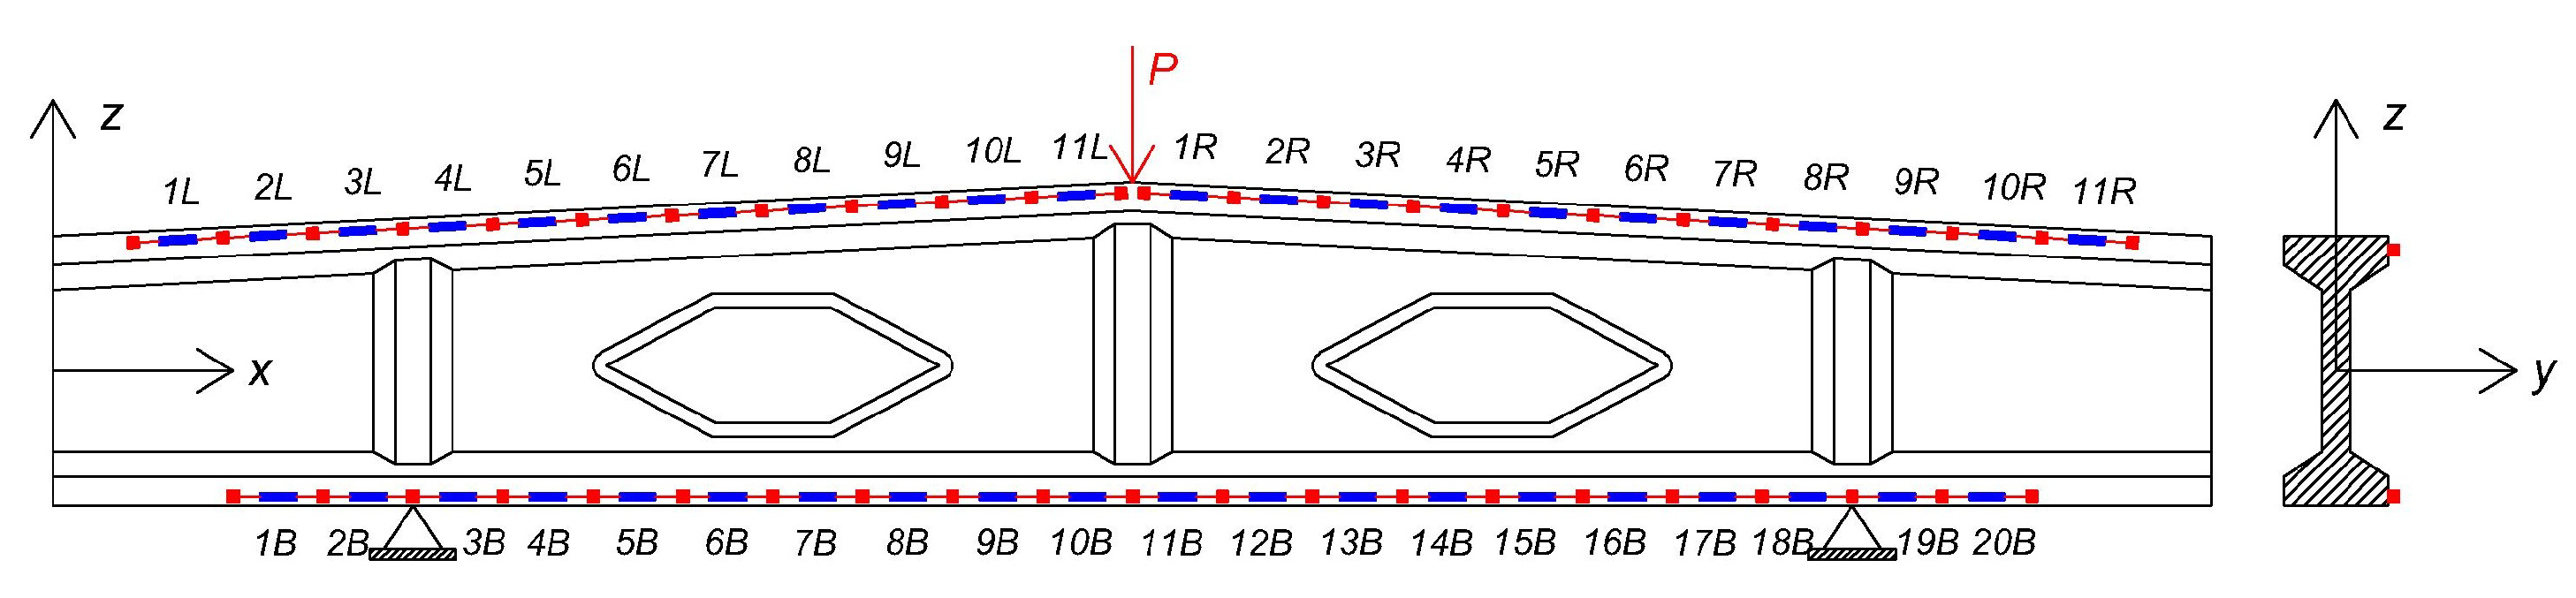
2. Experimental Setup

An I-shaped, pre-stressed concrete “roof” beam with two openings in its web serves as test structure (Figure 1). The beam’s length is 6.0 m and its height varies linearly between its ends and its middle from 0.75–0.90 m. The beam is supported on a steel table through two supports at 1.0 m from the ends. The static boundary conditions approximate these of a simply supported beam. This is not the case for the dynamic behavior as an interaction between the beam and the steel table is expected as the table and the connecting supports can not be considered as infinitely stiff with respect to the beam.

2.1. Dynamic Tests

The dynamic excitation of the beam is performed with hammer impacts in the vertical (z-axis in Figure 2) and the lateral (y-axis, out of plane in Figure 2) direction. The tests are performed at the beginning of each loading cycle, when the applied quasi-static load is zero. The response of the beam to the induced excitation is recorded with three chains of multiplexed Fiber-optic Bragg Grating (FBG) strain sensors; two at the top flange and one at the bottom flange (Figure 2) of the beam. The chains are attached on the side of the top and the bottom flange of the beam along its longitudinal direction through a clamping system, to measure axial dynamic strains, as shown in Figure 1 and Figure 2. The fiber is firmly fixed at discrete connections (Figure 2b) to ensure the proper transfer of strains from the beam to the sensors; the distance between two consecutive connections is 25 cm and one sensor exists between them, measuring the average strain or macro-strain over this distance. The fibers are pretensioned to ensure that they would remain in tension due to the applied force during the PDT. Thermal insulation is also provided around the fibers to ensure that temperature fluctuations in the laboratory would not affect the measurements (Figure 1). The strain acquisition system is an FAZ Technology FAZT I4 interrogator. The sampling frequency is 1000 Hz.

2.2. Progressive Damage Test

The beam is subjected to a 3-point progressive damage test. The quasi-static load is applied at the middle of the beam (Figure 2). Eleven loading cycles were performed. In each cycle, the maximum load was increased by 50 kN with respect to the previous cycle. The beam failed in shear during the eleventh loading cycle for a load of 592 kN.

3. Modal Analysis

The modal analysis is performed using the dynamic strain data. The system identification is conducted with the MACEC software [7], using the covariance-driven Stochastic Subspace Identification (SSI-cov) [8] algorithm where only the measured response (strains) is used for the identification. The maximum system order and the half number of Hankel block rows i that need to be defined in the algorithm are selected to be equal to 100 and 50 respectively. During data processing, the static or DC offset is removed from all measured signals.

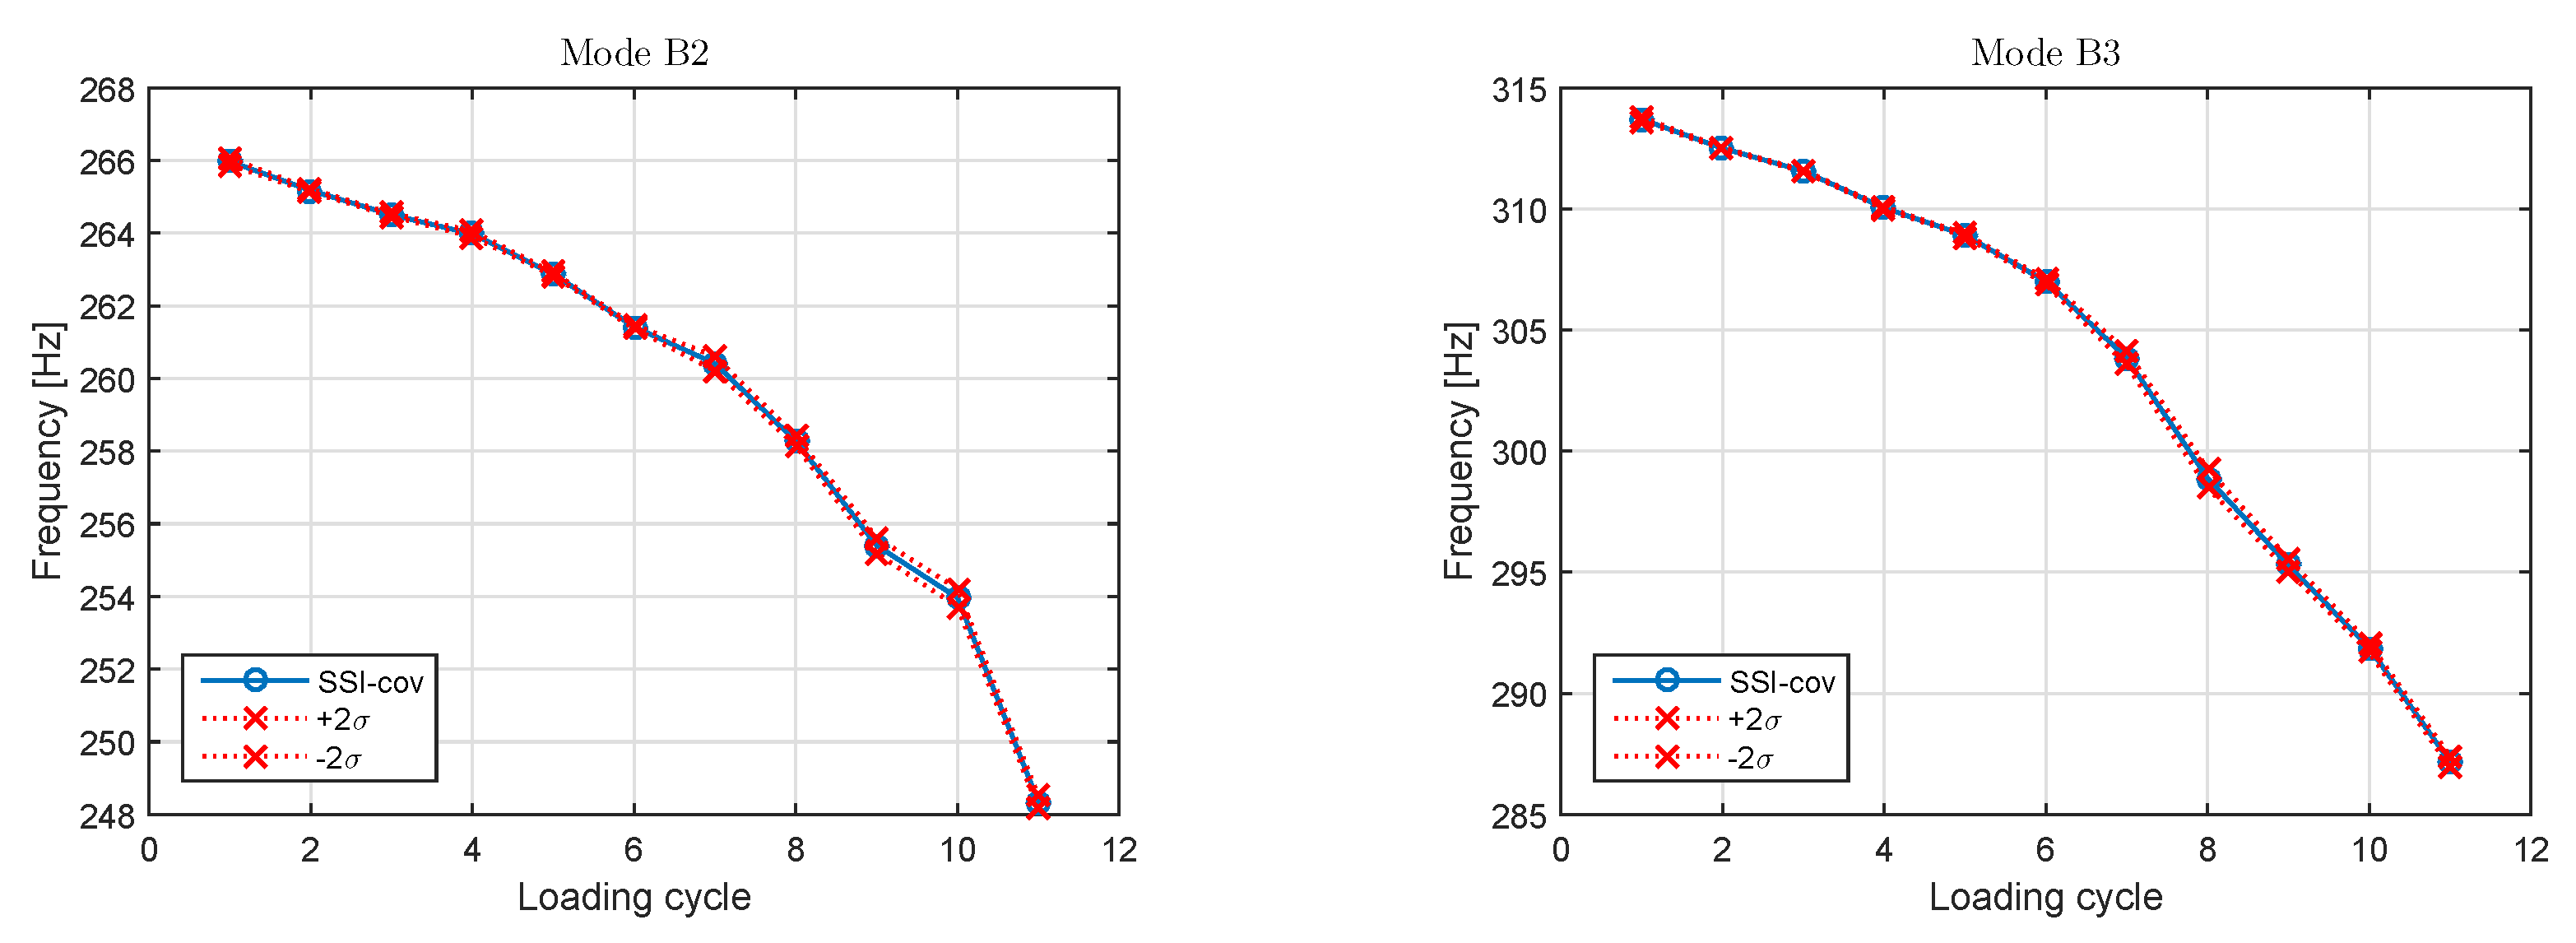
3.1. Eigenfrequencies

Eleven bending, lateral and torsion modes are identified in the frequency range [0–400] Hz. The eigenfrequency values for the undamaged beam are summarized in Table 1. High identification accuracy for the eigenfrequency values is obtained since the 95% confidence interval, as derived from the SSI-cov identification [8] is narrow. The eigenfrequencies of a validated finite element model (FEM) that is built in ANSYS are also provided for comparison. High-order solid elements are used for modeling the beam accurately. The material properties that are used (Young’s modulus and density) have been experimentally obtained from concrete cube and cylinder specimens.
When the experimentally identified and the numerically obtained eigenfrequencies are compared, a good match is observed for the lateral bending modes L1 and L2, the torsion modes T3 and T4, and the in-plane bending modes B2 and B3. On the contrary, for the remaining modes, a significant difference in the eigenfrequency values is observed. This is attributed to the interaction of the “roof” beam with the supporting beam, which is not taken into account by the FEM. In order to investigate which modes are influenced by the “roof” beam - supporting beam interaction, the modal assurance criterion (MAC) as a measure of consistency (degree of linearity) between the estimates of the modal vectors that are identified under different conditions is applied. The MAC values for the first two lateral modes L1 and L2 and the last two in-plane bending modes B2 and B3 are approximating unity (>0.98), indicating a high consistency between the calculated and the experimentally obtained modes. Therefore, for these modes, the assumption of free-free boundary condition applies and the system “roof” beam-supporting beam is decoupled. Hence, it is expected that any potential changes on the dynamic characteristics of these modes will originate from the damage that is induced to the “roof” beam and not from the interaction with the supporting steel beam.
The evolution of the eigenfrequencies throughout the PDT is shown in Figure 3. The presented eigenfrequencies correspond to the decoupled modes B2 and B3. A similar trend is observed for the decoupled modes L1 and L2 and thus they are not presented. For the damage-sensitive modes, a constant reduction of their eigenfrequency values is observed, which is correlated with the increased level of damage of the beam. The percentile reduction of the eigenfrequency values varies from 4 % to 9 % for the different modes, depending on the degree that each mode is influenced by the damage.

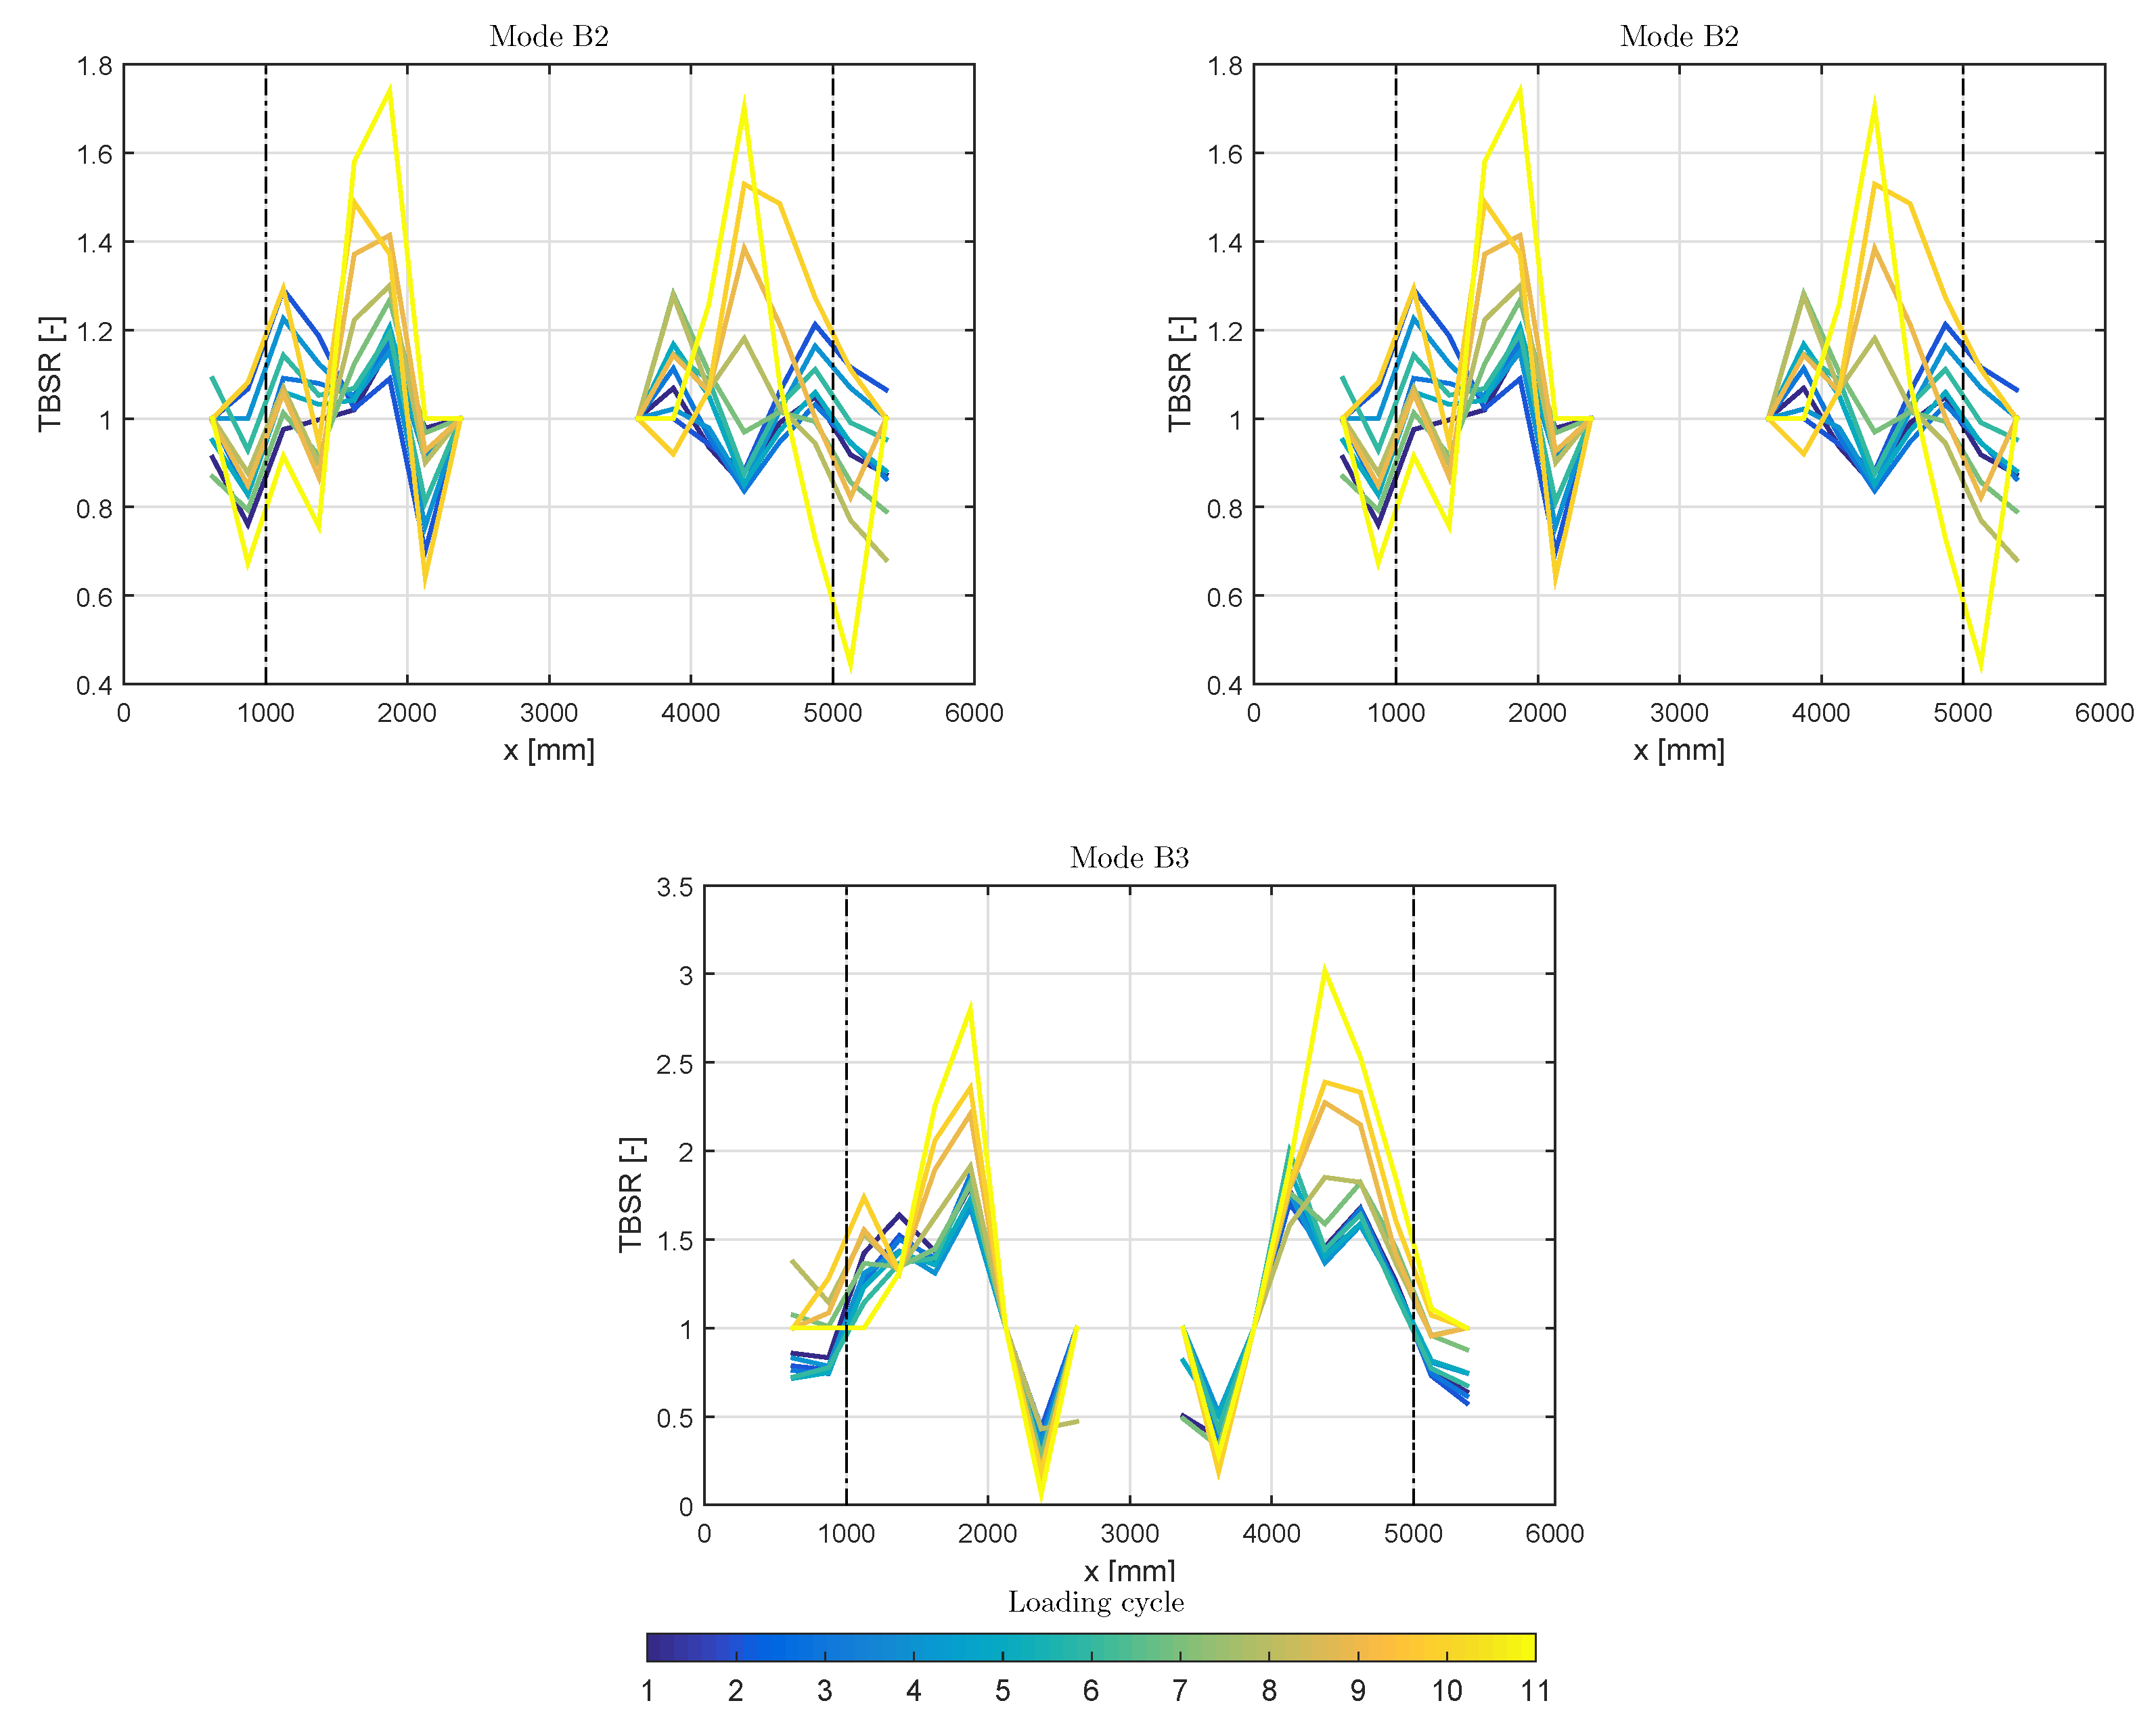
3.2. Strain Mode Shapes

The identified strain mode shapes of the beam are given in Figure 4 for four modes (L1, L2, B2 and B3), the same as for the eigenfrequencies. The top subplots correspond to the top flange fibers and the bottom to the bottom flange fiber. A least-squares fit is applied for the determination of the scale factor c that links the strain mode shapes of the various cycles with the strain mode shapes of the first loading cycle. The least-squares fit is calculated to the modal strain values at the ends of the fibers i.e., the zones outside of the static supports. Since these zones are not stressed due to the static loading, their values are not expected to change due to the imposed damage. To demonstrate the evolution of the modal strain shapes due to the imposed damage, combined graphs of the modal strain shapes that were identified in each loading cycle are presented.
Significant amplitude and curvature changes are observed in the vicinity of the damaged area (around the openings of the web), as it can be seen from the strain mode shapes in Figure 4. The increase in curvature and amplitude is directly related to the decrease of stiffness at certain locations of the beam (around 1500 mm and 4500 mm) where shear cracks were observed during the experiment. The evolution of the strain mode shapes during the different loading cycles is prominent. The larger amplitude values correspond to the last loading cycle, before the failure of the beam. The top flange strain mode shapes appear to be more sensitive to damage, which is in agreement with the observations during the experiment where most of the cracks were formed at the top of the beam. However, both the top and the bottom strain mode shape of the third bending mode (mode B3—Figure 4d) are influenced from the damage allowing in this way to identify also damage of moderate severity at the bottom flange of the beam.
Finally, a quantity for damage detection and localization is introduced: the top-to-bottom strain ratio (TBSR), which is defined as:
T B S R ( x ) = | ϵ t o p ( x ) | \ | ϵ b o t t o m ( x ) |
where | ϵ t o p ( x ) | is the absolute value of the longitudinal modal strain at the top of the beam, | ϵ b o t t o m ( x ) | is the absolute value of the longitudinal modal strain at the bottom of the beam, and x denotes, as before, the longitudinal coordinate. The TBSR is computed for the well-identified strain mode shapes of the in plane bending modes, B2 and B3. At the locations that the modal strains are approximating zero, mainly in the zone between 2700–3300 mm, the criterion is not applied since the division by very small quantities can yield inaccurate results. As can be clearly seen in Figure 5, where the evolution of the TBSR values along the beam for modes B2 and B3 throughout the PDT are given, the influence of the damage is significant. A clear increase or decrease of the TBSR at the locations where the damaged was mainly observed during the PDT, indicates its high sensitivity as a damage indicator. These changes appear already from the second loading cycle and become really apparent after the sixth loading cycle. The largest changes are observed at the zones around 1500 mm and 4500 mm, where the most severe cracks were observed during the PDT. There, the TBSR values have a percentile increase of up to 114 % between the undamaged beam and the damaged beam of the last loading cycle. Therefore, the TBSR is considered as a high sensitivity measure of the level of damage.

4. Conclusions

A new method was presented for VBSHM by means of quasi-distributed longitudinal macro-strain FBG sensing. The method was demonstrated and validated by progressive damage testing of a “roof” beam displaying more complex structural behavior than regular beam-type structures. While the dynamic strain amplitudes were very low (sub-microstrain RMS values were observed), the experimentally identified eigenfrequencies and strain mode shapes were seen to be very accurate. This indicates that the proposed combination of a high-accuracy tunable laser FBG interrogator and advanced parametric system identification techniques will be adequate also for large-scale civil structures. The damage that was induced into the “roof” beam by the PDT caused important changes in the eigenfrequencies and strain mode shapes identified from the FBG data in a relatively early stage. This confirms that strain mode shapes are sensitive to local damage even in this rather complex case where most cracks appear close to the strain sensors. The sensitivity becomes even larger when the ratio between the modal strain amplitudes at the top and the bottom of the beam (TBSR) is taken.

Acknowledgments

The research presented in this paper has been performed within the framework of the project G099014N “robust vibration-based damage identification with a novel high-accuracy strain measurement system”, funded by the Research Foundation Flanders (FWO), Belgium. The financial support of FWO is gratefully acknowledged. The authors wish to express their gratitude to Ergon NV for supplying the concrete beam that served as a test object in this study.

References

  1. Deraemaeker, A.; Reynders, E.; de Roeck, G.; Kullaa, J. Vibration based Structural Health Monitoring using output-only measurements under changing environment. Mech. Syst. Signal Process. 2008, 22, 34–56. [Google Scholar] [CrossRef]
  2. Peeters, B.; de Roeck, G. One-year monitoring of the Z24-bridge: Environmental effects versus damage events. Earthq. Eng. Struct. Dyn. 2001, 30, 149–171. [Google Scholar] [CrossRef]
  3. Unger, J.F.; Teughels, A.; de Roeck, G. Damage detection of a prestressed concrete beam using modal strains. Struct. Eng. 2005, 131, 1456–1463. [Google Scholar] [CrossRef]
  4. Glisic, B.; Inaudi, D. Fibre Optic Methods for Structural Health Monitoring; John Willey & Sons: Hoboken, NJ, USA, 2008. [Google Scholar]
  5. Meltz, G.; Morey, W.W.; Glenn, W.H. Formation of Bragg gratings in optical fibers by a transverse holographic method. Opt. Lett. 1989, 14, 823–825. [Google Scholar] [CrossRef] [PubMed]
  6. Anastasopoulos, D.; de Smedt, M.; Vandewalle, L.; de Roeck, G.; Reynders, E. Damage identification using modal strains identified from operational fiber-optic bragg grating data. Struct. Health Monit. 2018. [Google Scholar] [CrossRef]
  7. Reynders, E.; Schevenels, M.; de Roeck, G. MACEC 3.3: A Matlab Toolbox for Experimental and Operational Modal Analysis; Report BWM-2014-06; Leuven University: Leuven, Belgium, 2014. [Google Scholar]
  8. Reynders, E.; Maes, K.; Lombaert, G.; de Roeck, G. Uncertainty quantification in operational modal analysis with stochastic subspace identification: Validation and applications. Mech. Syst. Signal Process. 2016, 66–67, 13–30. [Google Scholar] [CrossRef]
Figure 1. The experimental setup of the modal test. (a) Side view of the experimental setup. (b) One of the connections for the FBG sensors.
Proceedings 02 00462 g001
Figure 2. The FBG sensors setup. 1L-11L and 1R-11R correspond to the FBGs of the two fibers of the top flange. 1B-20B correspond to the FBGs of the bottom flange fiber. The quasi-static force P for the PDT is applied in the direction of the red arrow.
Proceedings 02 00462 g002
Figure 3. Evolution of the eigenfrequencies as identified from the FBG strain data (solid lines) and their 95 % confidence intervals (dotted lines) for modes B2 and B3.
Proceedings 02 00462 g003
Figure 4. Evolution of the damage-sensitive strain mode shapes for the 11 loading cycles. The top subplots correspond to the top flange fibers while the bottom subplots to the bottom flange fiber. The dash-dotted lines indicate the location of the supports.
Proceedings 02 00462 g004
Figure 5. TBSR values between the undamaged beam strain mode shapes and the strain mode shapes of the various damage levels. The black dashed lines indicate the location of the supports. (a) Mode B2 and (b) Mode B3.
Proceedings 02 00462 g005
Table 1. Eigenfrequency values of the undamaged beam. The vertical bending modes are denoted with ’B’, the lateral bending modes with ’L’ and the torsional modes with ’T’. EMA stands for experimental modal analysis and FEM for finite element model.
MethodMode L1Mode T1Mode L2Mode T2Mode B1Mode L3
EMA27.2035.5075.3093.00127.50131.00
FEM27.4055.4077.15108.70115.40141.90
MethodMode T3Mode L4Mode T4ModeB2Mode B3
EMA178.00216.60244.80265.90313.70
FEM177.80234.50247.70264.40314.40
Publisher’s Note: MDPI stays neutral with regard to jurisdictional claims in published maps and institutional affiliations.

