Abstract
In this paper the pressure waves generated in a test rig previously presented by the authors for the experimental analysis of concrete slabs subjected to blast loading are analysed. To this aim, the concrete samples are replaced by one single aluminium slab instrumented with pressure gauges. In order to analyze the experimental scatter, the test set-up is repeated four times, with the only variation of the location of the aluminium slab within the four available positions in the test rig. The pressure histories registered show good agreement with the typical patterns expected in open-air explosions and demonstrates the quasi-planar shape of the pressure wave acting on the slabs. By comparing between the results obtained in different detonations, the explosive charge seems to be among the main sources of experimental scatter in this kind of tests.
1. Introduction
Recent terrorist attacks have highlighted the need for improving structural strength and resilience against impulsive loadings. Such improvement requires however a deeper knowledge about structural and material behaviours against high strain rate loadings. For this reason, a wide variety of field tests involving blast loading and structural members can be found in the literature during the last decades [,,,,]. These kind of tests present several difficulties, such as a the high economic cost, the preparation time, and the need for special permissions and facilities due to the use of explosives which entails high risk of damage of the data acquisition equipment during the tests. These difficulties lead to a scarce amount of tests and subsequently a scarce amount of experimental results to analyze the behaviour of a given material or structural member. This aspect is specially critical when analyzing structural materials which have an intrinsic large experimental scatter such as concrete and consequently, when an experimental campaign involving blast loading and concrete elements is restricted to a limited amount of samples, doubts may arise about if the structural behaviour found in the tests is representative of the structural member being analyzed, or is just a particular result for that sample.
In this paper, the experimental set-up presented in Morales et al. [] for testing concrete slabs is analyzed. The idea behind this set-up is to place the specimens in a symmetrical disposition with respect to the explosive load, so theoretically all samples are subjected to the same wave front. Moreover, the ratio between the samples dimensions and their standoff distance from the detonation point, makes it possible to assume that specimens are subjected to a planar blast wave. All these characteristics of the test set-up have been analysed from a theoretical point of view (see [,,]), but no experimental proof has been provided up to date: this is actually the main objective of this work.
2. Test Rig Description
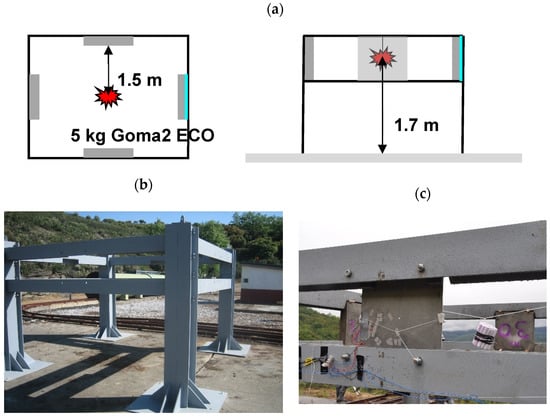
The test rig, which is intended to test concrete square slabs, was presented in [] and is shown in Figure 1. It consists of four steel columns braced by pairs of horizontal steel beams, conforming a square area. The samples are placed vertically between the horizontal beams in their midpoint, allowing thus to test up to four samples with one single explosive charge. The explosive is hanged in the centre of the frame, at the same distance from the ground level than the centre of the samples. This symmetrical configuration makes possible that all samples are theoretically subjected to the same explosive load. The standoff distance between the explosive and the samples is lower than the height of the explosive from the ground level, in order to avoid wave interferences between the incident wave and the wave reflected on the ground.

Figure 1.
(a) Sketch of the test rig, showing the position of the slabs and the explosive load; (b) General view of the steel frame; (c) Detail of the explosive placed in the centre of the frame, with the samples placed ready to be tested.
Given the standoff distance between the explosive load and the slabs (1500 mm) and the slabs dimensions (500 mm × 500 mm), it is possible to assume that a planar blast wave acts on the slabs during the tests. Assuming that this hypothesis is fulfilled, only two pressure gauges were used in the tests performed up to date [,,], each of them in the location of one of the slabs being tested.
3. Experimental Procedure
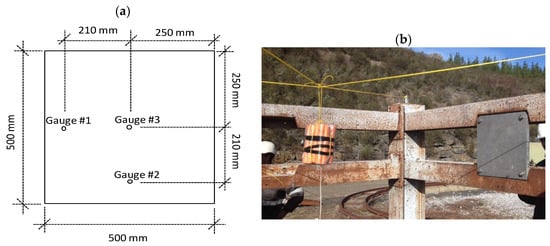
In order to characterize the blast wave generated in this testing procedure instead of the concrete samples, an instrumented aluminium slab was used in the tests presented here. The slab was machined having the same planar dimensions as the concrete slabs (500 mm × 500 mm). In the slab plane facing the blast wave, three pressure gauges were placed, as shown in Figure 2a. Pressure gauge #3 was placed in the central point of the plate (minimum theoretical distance to the detonation point), while pressure gauges #1 and #2 were placed at the same distance from gauge #1 and therefore, both are located at the same distance from the detonation point. According to this pressure gauges configuration, the blast wave should arrive first to pressure gauge #3, while the pressure histories registered in gauges #1 and #2 should be theoretically identical. The thickness of the plate was set equal to 30 mm, leading to similar stiffness and total mass than concrete samples.

Figure 2.
(a) Sketch of the aluminium plate showing its dimensions and the position of the three pressure gauges; (b) instrumented plate with three pressure gauges ready for the test.
The three pressure gauges used were piezoelectric PCB Piezotronics 102B sensors, especially suited for highly dynamic events. The signals registered by the pressure gauges were conditioned through an ICP 482C05 signal conditioner and recorded by a Tektronics DPO2024 oscilloscope. The detonation of the explosive loads was used to trigger all the data acquisition systems.
A total number of 4 tests were conducted, all of them with the same explosive load: 23 Goma 2-ECO cartridges of 151.5 gr each, making a total explosive load of 3.485 kg. The first two tests were conducted without changing the location of the aluminium plate, while in the third and fourth tests it was changed randomly among the remaining three available positions. It must be noted that, given the symmetrical configuration of the test rig and the repeated explosive load, the experimental tests should lead to similar results in the four cases.
4. Results
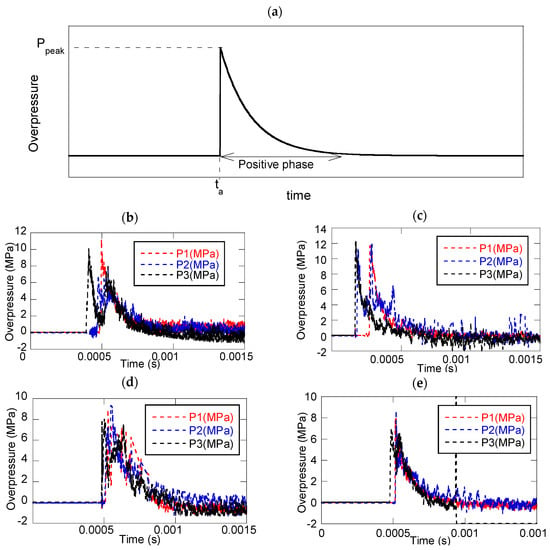
Figure 3 shows the pressure history records obtained in the four tests. Generally speaking, pressure histories recorded show consistent results for all the tests conducted. The blast waves registered in all gauges show the typical patterns from open air explosions (Figure 3a), with a sudden increase of pressure up to a peak value (Ppeak), followed by a progressive decay approaching to a cero overpressure value (atmospheric pressure). The arrival time of the blast wave (ta) is identified as the time when the pressure peak is registered, while the time between this peak and the decay to cero will be termed as the positive phase.

Figure 3.
(a) Typical pressure wave generated by an explosion; (b) Pressure histories registered in Test #1; (c) Pressure histories registered in Test #2; (d) Pressure histories registered in Test #3; (e) Pressure histories registered in Test #4.
5. Discussion
Table 1 shows the blast wave arrival times registered during the tests. Besides the arrival time obtained at each pressure gauge, the mean value and the standard deviation for the three gauges in each test are given. Except for test number 2, the arrival times measured in all tests were quite similar in the three pressure gauges. In the four tests, the blast wave arrived first to gauge number 3, surely due to the fact that this is the gauge closest to the detonation point, since it is placed at the centre of the slab. This result could raise doubts about the planar shape of the blast wave, however the standard deviation of the arrival time (maximum value of 45.6 µs) is well below the duration of the positive phase of the blast wave (near 500 µs), supporting the feasibility of assuming a planar blast wave for numerical analysis purposes [].

Table 1.
Arrival times (ta) of the blast waves registered in the tests, including mean values and standard deviations.
The differences in the blast wave arrival time measured in the second test could be attributed to an experimental deviation in the detection of the detonation time, which sets the cero time scale, or to an experimental deviation in the weight or energy of the explosive detonated in Test #2, since higher explosive loads lead to shorter blast wave arrival times.
In order to analyze the characteristics of the blast waves, Table 2 and Table 3 summarize the pressure peaks (Ppeak) and the impulse per unit area (I/A) generated by the explosions. This last parameter can be obtained as the integration of the pressure history with respect to time. However, as Figure 3 shows, the signals of pressure histories exhibit remarkable noise, especially as the curves vanish approaching the cero overpressure value at the end of the positive phase. This may introduce significant errors in the abovementioned integration, and therefore it was decided to limit the integration domain to the positive phase of the pressure histories, which as can be seen in Figure 3 ends approximately 1 ms after the detonation in all records. This impulse measured up to 1 ms after the detonation is termed as I/A@1ms.

Table 2.
Peak pressures (Ppeak) of the blast waves registered in the tests, including mean values and standard deviations.

Table 3.
Impulse per unit area during the first millisecond after the detonation (I/A@1ms) of the blast waves registered in the tests, including mean values and standard deviations.
Generally speaking the tables show consistent results in all tests, with reasonably low deviations in terms of pressure and impulse between pressure gauges in each test (with the only exception of Test 1). This result supports again the feasibility of simplifying the pressure wave acting on the slabs as a planar one, since the records obtained in the three gauges are similar in terms of time, pressure and impulse.
However, if we compare the average values obtained in all tests the differences are higher. The average pressure peaks of the four tests results in 9.38 MPa with a standard deviation of 15.36%. The same procedure for the impulse per unit area leads to an average value of 1.058 MPa·ms and a standard deviation of 26.80%. In other words: in spite of the care taken in using exactly the same blast load in the four tests, the experimental scatter introduced by the explosive is remarkable. This result reveals that in this kind of tests, characterizing the applied load in terms of explosive weight (kg of explosive substance) may introduce significant uncertainties, which are much higher as the number of tests conducted is decreased. For this reason the experimental set-up studied in this work is especially beneficial, since with a single explosive load, up to four samples placed at the same distance from the detonation point can be tested at one time, skipping thus the uncertainties that would be introduced if four samples were tested independently by detonating four nominally identical explosive loads. It might be argued that the position of the slabs in each test could be the reason behind the experimental scatter between detonations, but it must be reminded that Test#1 and Test#2 were conducted without changing the position of the instrumented slab, and the variation of the averaged pressure peaks and impulses between these two tests were remarkable as well: +25.24% and +22.43% respectively.
Finally, if we focus on Test#2 results, although the averaged peak pressure and impulse are in the upper part, their magnitudes do not justify the remarkable difference registered in the blast wave arrival time shown in Table 1 and already discussed. Therefore, in the author´s opinion, this difference can be attributed to an accidental deviation in the detection of the detonation time.
6. Conclusions
In this paper, the blast wave generated in the test rig presented by the authors in previous contributions for the experimental analysis of concrete slabs subjected to explosive load has been studied. To do so, the concrete samples have been replaced by one single aluminium slab instrumented with pressure gauges. The aluminium slab has been subjected to four explosive detonations, all of them with the same nominal explosive charge. The first two detonations were conducted without changing the position of the slab, while in the third and fourth detonations the position was randomly varied between the three remaining testing positions. Generally speaking, all pressure gauges show consistent results, with a pressure wave history according to the typical pressure histories expected in open air explosions.
For a given detonation, when comparing the arrival time of the overpressure peak among the three pressure gauges, the differences are limited well below the total duration of the positive phase of the wave. Since the differences in pressure peaks and impulse per unit area among the pressure gauges are also limited, the assumption of a planar wave acting on the specimens seems feasible.
Conversely, when pressure histories between detonations are compared, differences in all parameters analyzed are considerably higher. This result points to the explosive load as an important source of experimental scatter, since the blast waves generated by explosive charges nominally equal, may be significantly different in spite of being generated under the same atmospheric conditions.
Author Contributions
D.A.C. and F.G. conceived and designed the experiments; V.R., R.S., F.G. and D.A.C. performed the experiments; V.R. and D.A.C. analyzed the data and wrote the paper.
Acknowledgments
The authors thank the financial support from the Ministerio de Economía y Competitividad, Spain, under grant BIA2014-54916-R.
Conflicts of Interest
The authors declare no conflict of interest. The founding sponsors had no role in the design of the study; in the collection, analyses, or interpretation of data; in the writing of the manuscript, and in the decision to publish the results.
References
- Razaqpur, A.G.; Tolba, A.; Contestabile, E. Blast loading response of reinforced concrete panels reinforced with externally bonded GFRP laminates. Compos. Part B 2007, 38, 535–546. [Google Scholar] [CrossRef]
- Luccioni, B.M.; Luege, M. Concrete pavement slab under blast loads. Int. J. Impact Eng. 2006, 32, 1248–1266. [Google Scholar] [CrossRef]
- Magnusson, J.; Ansell, A.; Hansson, H. Air-blast-loaded, high-strength concrete beams. Part I: Experimental investigation. Mag. Concr. Res. 2010, 62, 127–136. [Google Scholar] [CrossRef]
- Millard, S.G.; Molyneaux, T.C.K.; Barnett, S.G.; Gao, X. Dynamic enhancement of blast-resistant ultra high performance fibre reinforced concrete under flexural and shear loading. Int. J. Impact Eng. 2010, 37, 405–413. [Google Scholar] [CrossRef]
- Wu, C.; Oehlers, D.; Rebentrost, M.; Leach, J.; Whittaker, A. Blast testing of ultra-high-performance fiber and FRP-retrofitted concrete slabs. Eng. Struct. 2009, 31, 2060–2069. [Google Scholar] [CrossRef]
- Morales-Alonso, G.; Cendón, D.A.; Gálvez, F.; Erice, B.; Sánchez-Gálvez, V. Blast Response Analysis of Reinforced Concrete Slabs: Experimental Procedure and Numerical Simulation. J. Appl. Mech. 2011, 78, 2060–2069. [Google Scholar] [CrossRef]
- Oña, M.; Morales-Alonso, G.; Gálvez, F.; Sánchez-Gálvez, V.; Cendón, D.A. Analysis of concrete targets with different kinds of reinforcements subjected to blast loading. Eur. Phys. J. Spec. Top. 2016, 225, 265–282. [Google Scholar] [CrossRef]
- Morales-Alonso, G. Experimental and Numerical Analysis of Reinforced Concrete Elements Subjected to Blast Loading. Ph.D. Thesis, Universidad Politécnica de Madrid, Madrid, Spain, 2013. [Google Scholar]
Publisher’s Note: MDPI stays neutral with regard to jurisdictional claims in published maps and institutional affiliations. |
© 2018 by the authors. Licensee MDPI, Basel, Switzerland. This article is an open access article distributed under the terms and conditions of the Creative Commons Attribution (CC BY) license (https://creativecommons.org/licenses/by/4.0/).