Abstract
The Local Defect Resonance (LDR) approach is a technique which is used to detect and localize defects in structural components in a non-invasive way. In this contribution, we will assess whether the local resonance frequencies changes by altering a set of experimental testing conditions (i.e., imposed boundary condition, number of excitation points and excitation location). The specimen is made of a carbon fiber reinforced polymer and contains multiple flat bottom holes. However, here, we will focus on three detectable defects. The measured response analyzed through a parametric data-processing approach confirms that the local resonance frequencies are independent of the proposed changes.
1. Introduction
The use of composite materials has gained significant interest over the last two decades across several industries. One of the main reasons is the global awareness to reduce the CO2-emissions [1]. Hence, Original Equipment Manufacturers (OEMs) and Tier 1 companies that are active in the aerospace, automotive and wind energy sector are highly interested to use lightweight composites as a structural material in their respective designs [2]. However, the non-destructive inspection techniques that are typically used on metallic parts are either not applicable on the composite components or the results are dubious [3]. In addition, the typical manufacturing defects in a composite component are also of a different nature than the defects in metallic components, but are also detrimental to the structural integrity of the structure. Therefore, over the years, new inspection techniques have been investigated and developed to assure the quality of the manufactured composite component by increasing the probability of defect detection.
2. LDR as a NDT Technique
During the last decade, the Local Defect Resonance (LDR) method has been introduced to detect and localize defects in polymers and composites [4,5]. It is a non-invasive inspection method which makes use of high-frequency vibrations to locally activate defective zones in a structure. A driving principle behind the method is that an embedded defect decreases the local stiffness within that particular area. In analogy with the classical modal testing approach, the vibration amplitude of a defect increases significantly when the excitation frequency matches the defect’s LDR frequency. This is comparable to the situation in which a solid structure resonates at its natural frequency. However, the resonance behavior of a solid structures is typically of a global nature, but that of embedded defects (i.e., such as delaminations) are locally confined to the defective zone. For instance, such a local modal vibration of a delamination in a solid has been observed in [6]. Earlier investigations, e.g., reported in [4,5,7], show that flat-bottom holes (FBH), fatigue cracks and delaminations can be successfully localized with this method in samples made of polymethyl methacrylate (PMMA), and Carbon Fiber Reinforced Polymer (CFRP). Furthermore, a formula is given in [5] in which the LDR frequency of a circular FBH can be calculated. The formula indicates that the LDR frequency of a given defect is completely independent from the imposed boundary/testing conditions on the global structure. Hence, in this contribution we will report on our experimental findings regarding this dependency.
3. Experimental Setup & Identification Methods
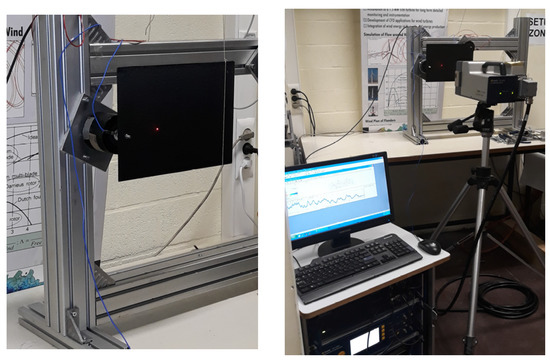
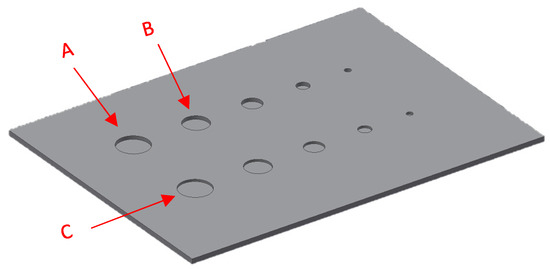
In order to visualize the LDR modes (i.e., to localize the defects) it is necessary to measure the individual frequency response on many points of the structure within a broad frequency range. Therefore, LDR measurements are typically performed by using a broadband excitation source (e.g., sweeping over a frequency range that includes the LDR frequency) while a scanning laser doppler vibrometer (SLDV) probes the surface. The configuration of the setup is shown in Figure 2. Here, the used SLDV is a Polytec PSV-400 (Polytec Gmbh, Germany) and as for the excitation source(s) we used the B&K electro-magnetic mini-shaker Type 4810. The CFRP test plate contains 12 layers of UD prepreg in the following stacking configuration [90 +60 −60 +30 −300]S. The post-cured total thickness of the plate is ca. 3.8 mm. As depicted in Figure 1, there are multiple FBHs drilled on the backside of the CFRP plate. A force sensor (PCB 208 B02) is placed between the shaker and the CFRP specimen to measure the input signal.

Figure 2.
The experimental setup: (left) The CFRP plate connected to the electro-magnetic shaker; (right) positioning of the Scanning Laser Doppler vibrometer (SLDV).

Figure 1.
Backside of the CFRP plate containing multiple circular FBHs. The marked FBHs (A, B and C) are detectable, see Section 4.
Starting from the measured input and output signals, the first 3 LDR modes are identified in a post-processing step via a modal parameter estimation technique.
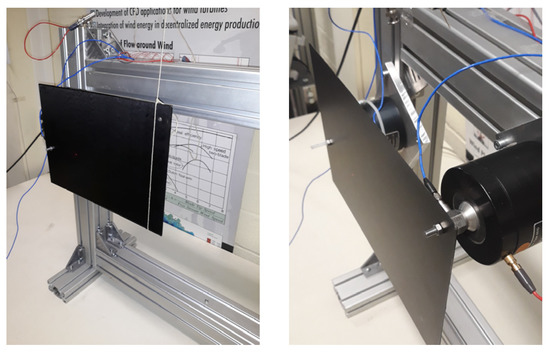
Different test cases have been done in order to study the variability of the LDR as a function of the test parameters (i.e., boundary conditions, excitation location and number of excitations). Five different test scenarios have been tried, and the configuration of each scenario is presented in Table 1. In each case, the plate was excited with a broad band chirp with a frequency band [9–18 kHz] that forces the plate to vibrate accordingly. Based on a preliminary test it was found that no LDR exists below 9 kHz. A grid of +5000 points has been scanned by the LDV to measure the velocity responses of the plate. By using the measured input force and the measured velocity responses, the FRFs of the +5000 points are calculated using the H1 estimator after transforming, by using the Fast Fourier Transform (FFT), the time-domain signals to the frequency-domain. The measured FRFs and the corresponding coherence functions are shown in Figure 3 for two randomly-chosen measured surface points. The coherence functions are very close to 1 in the frequency band of interest which confirms that quality of the measurement done. These FRFs (+5000 FRFs) will be used as the primary data for the modal parameter estimation step that will be done to extract the modal parameters of the LDR.

Table 1.
Overview of tested configurations.

Figure 3.
Two different boundary condition scenarios: the plate is fixed on one side and free suspended on the other side (i.e., a free-attached boundary condition) (left); the plate is fixed to two shakers (right).
Two modal parameter estimation methods, the peak picking method [8] and the Polymax modal parameter estimator [9,10], are applied to the measured FRFs with the aim to extract the modal parameters (resonance frequency and mode shapes) of the LDRs.
The peak picking method is a single degree of freedom frequency-domain method yielding local estimates for the system poles. It is based on the fact that the frequency response function goes through an extremum around the natural frequency. The frequency at which this extremum occurs is a good estimate for the damped natural frequency. The half power method (3 dB rule) generates an estimate of the corresponding damping ratio. Then, the mode shapes can be established by examining the magnitude of the imaginary part of the frequency response functions at the different measured points at the resonance frequencies. The peak picking method is a quick, simple, and user-dependent method that can be used as a quick check before attempting the more advanced modal parameter estimation techniques.
The Polymax modal parameter estimator is a multi-degrees of freedom frequency-domain method that yields global estimates for the modal parameters by fitting all the measured FRFs simultaneously in a linear least-squares sense using a right-matrix fraction description (RMFD) model [11]. The modal parameters of the different modes are calculated from the eigenvalues and the eigenvectors of the companion matrix of the estimated denominator coefficients of the RMFD model. Polymax has a big advantage of delivering a very clear stabilization chart that is basically used in the modal analysis community to distinguish between the physical and the dubious vibration modes. In comparison to the peak picking method, Polymax is more robust in terms of the reliability of the results and it is more user friendly, since it requires less user interaction. Hence, the results are less user-dependent.
4. Results and Discussion
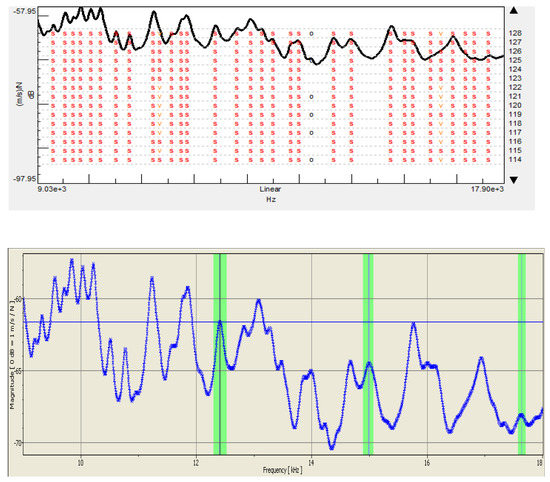
The measured FRFs are processed by using 2 methods, namely the peak picking method and the parametric estimation method by using the Polymax estimator. Both methods are used to identify the LDR frequency and mode shapes that correspond to the FBH defects on the tested plate. The difference between both approaches is noticeable from the results that are depicted in Figure 4. More specifically, the top graph of Figure 4 is the stabilization chart after using the Polymax estimator on the measured data. The red ‘s’ symbol indicates that the algorithm found and judged that there is a mode present at a specific frequency location. On the other hand, the bottom graph in Figure 4, is the peak picking method and it requires a substantial involvement from the user. Here, the green bars indicate that the user manually selected a band around a peak for further analysis (i.e., evaluate whether the corresponding mode shapes are physical/mathematical and/or global/local). Thus, by comparing both approaches it becomes clear that the automated processing (i.e., the use of the Polymax estimator) is preferred over the more manual approach, since it is less prone to errors that can be induced by the user, e.g., missing a peak in the higher frequency region.

Figure 4.
The measured average spectrum with: (top) the stabilization chart and the indication of the stable modes annotated by the red ‘s’ symbols; (bottom) the peak picking method where the user highlights the peaks.
The clear Polymax stabilization chart shows that there are about 31 stable modes within the frequency band of interest. By evaluating the corresponding mode shapes, it was found that not all these modes show a local mode behavior. Most of these modes show a combination of global and local dynamics. However, amongst those 31 modes, there are 3 modes that show a clear local mode behavior. The mode shapes together with the frequency values for those 3 local modes are shown in Figure 5.

Figure 5.
The 3 LDR mode shapes obtained from the LMS Test.Lab module. (a) LDR 1 with f = 12,401.06 Hz; (b) LDR 2 with f = 15,001.88 Hz; (c) LDR 3 with f = 17,612.82 Hz.
The 1st local mode is shown in Figure 5a. It represents the 1st local bending deflection of the biggest FBH located (i.e., defect labeled as “A” in Figure 1). The 2nd local mode that we have observed, appears around 15 kHz, shown in Figure 5b. It depicts a 1st out-of-phase local bending deflection of the first 2 FBHs located in the first row (i.e., defect labeled as “A” and “B” in Figure 1). The 3rd mode around 17.6 kHz, see Figure 5c, shows a 2nd local bending deflection of the 1st FBH (i.e., defect “A”) and a 1st in-phase local bending deflection between defect “B” and defect “C”.
These 3 local modes are tracked over the 5 different test cases that have been done, and the frequency values obtained from the Polymax estimator and the peak picking method are presented in Table 2 and Table 3 respectively. One can see from Table 2 that the LDR frequency is a defect-related parameter, independent from the test configuration (e.g., boundary condition, excitation location, number of excitation, and frequency resolution). The mean values of the 3 tracked LDR frequencies are (12.40 ± 0.019) kHz, (15.01 ± 0.011) kHz, and (17.62 ± 0.021) kHz.

Table 2.
The 3 LDR-frequencies in the various test cases. The values are obtained from the Polymax estimator.

Table 3.
The 3 LDR-frequencies in the various test cases. The values are obtained from the peak picking method.
A comparable result is obtained when one looks to the values that are obtained with the peak picking method (see Table 3). More specifically, the mean values of LDR 1 (12.44 ± 0.023) kHz and LDR 2 (15.01 ± 0.016) kHz correspond well with the values that have been obtained with the Polymax estimator. As for the mean value of LDR 3 there seems to be a discrepancy between the calculated mean value of both estimation methods. In addition, LDR 3 with the peak picking method has a higher standard deviation in comparison to the previous result obtained with the Polymax estimator. This illustrates the inaccuracy that is involved with the peak picking method.
5. Conclusions
In this paper we showed that the LDR frequency of different flat-bottom hole defects (in a CFRP plate) are independent from the experimental testing conditions (i.e., type of fixation, number of excitation and excitation location). The measured data was post-processed by using a peak-picking method and a parametric approach (i.e., by using Polymax estimator). The latter data processing method leads to a lower standard deviation for the different observed LDR modes when compared to the peak picking method. Furthermore, the excitation frequency was limited by the hardware to an upper limit of 20 kHz. Therefore, we were only able to discern three different LDR modes. To identify the other LDR modes (and thus identify the remaining FBHs) then it is recommended to use an excitation source with a higher excitation frequency.
Author Contributions
G.A. wrote the paper; G.A. and M.E.-K. generated the results and discussions; G.A. and M.E.-K. designed and performed the measurements, P.G. conceived the data analysis procedure and tools.
Acknowledgments
The work leading to this publication has been funded by the SBO project DETECT-IV (Grant no. 160455), which fits in the Macro-ModelMat (M3) research program funded by SIM (Strategic Initiative Materials in Flanders) and VLAIO (Flanders Innovation & Entrepreneurship Agency).
Conflicts of Interest
The authors declare no conflict of interest.
References
- Timmis, A.J.; Hodzic, A.; Koh, L.; Bonner, M.; Soutis, C.; Schafer, A.W.; Dray, L. Environmental impact assessment of aviation emission reduction through the implementation of composite materials. Int. J. Life Cycle Assess. 2015, 20, 233–243. [Google Scholar] [CrossRef]
- Heuss, R.; Muller, N.; van Sintern, W.; Starke, A.; Tschiesner, A. Lightweight, Heavy Impact; McKinsey Report; McKinsey: New York, NY, USA, 2012. [Google Scholar]
- Adams, R.D.; Cawley, P. A review of defect types and nondestructive testing techniques for composites and bonded joints. NDT Int. 1988, 21, 208–222. [Google Scholar]
- Solodov, I.; Bai, J.; Bekgulyan, S.; Busse, G. A local defect resonance to enhance acoustic wave-defect interaction in ultrasonic nondestructive evaluation. Appl. Phys. Lett. 2011, 99, 211911. [Google Scholar] [CrossRef]
- Solodov, I.; Bai, J.; Busse, G. Resonant ultrasound spectroscopy of defects: Case study of flat-bottomed holes. J. Appl. Phys. 2013, 113, 223512. [Google Scholar] [CrossRef]
- Sarens, B.; Verstraeten, B.; Glorieux, C.; Kalogiannakis, G.; VanHemelrijck, D. Investigation of contact acoustic nonlinearity in delaminations by shearographic imaging, laser doppler vibrometric scanning and finite difference modeling. IEEE Trans. Ultrason. Ferroelectr. Freq. Control 2010, 57, 1383–1395. [Google Scholar] [CrossRef] [PubMed]
- Solodov, I.; Rahammer, M.; Gulnizkij, N. Highly-Sensitive and Frequency-Selective Imaging of Defects via Local Defect Resonance. In Proceedings of the 11th European Conference on Non-Destructive Testing (ECNDT 2014), Prague, Czech Republic, 6–10 October 2014. [Google Scholar]
- Heylen, W.; Lammens, S.; Sas, P. Modal Analysis Theory and Testing; Department Werktuigkunde, Katholieke Universiteit Leuven: Heverlee, Belgium, 1997. [Google Scholar]
- Guillaume, P.; Verboven, P.; Vanlanduit, S.; Van der Auweraer, H.; Peeters, B. A poly-reference implementation of the least-squares complex frequency domain-estimator. In Proceedings of the 21th International Modal Analysis Conference (IMAC), Kissimmee, FL, USA, 3–6 February 2003. [Google Scholar]
- Siemens PLM (LMS International). LMS Test.Lab. Available online: www.plm.automation.siemens.com (accessed on 25 May 2018).
- Kailath, T. Linear Systems; Prentince-Hall: Upper Saddle River, NJ, USA, 1980. [Google Scholar]
Publisher’s Note: MDPI stays neutral with regard to jurisdictional claims in published maps and institutional affiliations. |
© 2018 by the authors. Licensee MDPI, Basel, Switzerland. This article is an open access article distributed under the terms and conditions of the Creative Commons Attribution (CC BY) license (https://creativecommons.org/licenses/by/4.0/).
