Abstract
A three-dimensional grain mapping technique for polycrystalline materials, called X-ray diffraction contrast tomography (DCT), was developed at SPring-8, which is the brightest synchrotron radiation facility in Japan. The developed technique was applied to an austenitic stainless steel. The shape and location of grains could be determined by DCT using the apparatus in a beam line of SPring-8. To evaluate the dislocation structure in fatigue, the total misorientation of individual grains was measured by DCT. The average value of the total misorientation over one sample was increased with the number of cycles. In a grain, the change of the total misorientation was largest for the primary slip plane. The maximum change of the total misorientation in fatigue was larger for planes with larger Schmid factor, and the first fatigue crack initiation was occurred in a grain, which had the greatest change of the total misorientation.
1. Introduction
Fatigue damage of metallic materials before crack initiation is believed to be the change of the dislocation structure during cyclic loading [1], and several methods have been proposed for the evaluation of the fatigue damage. Among them, X-ray diffraction technique has received considerable attention because the change in the microscopic structure of materials during fatigue and plastic deformation can be detected throughout the process from the initial to the final stages. Estimation of the dislocation densities in metals was first proposed by Gay et.al. [2]. X-ray diffraction for polycrystalline materials has been used to analyze microstructural changes related to the deformation of metallic materials. Taira et al. [3,4] and Nakai et al. [5] irradiated microbeam X-rays in the polycrystalline metal surface and analyzed the dislocation structure of the crystal grain from the diffraction pattern. They estimated the excessive dislocation density, the microscopic lattice strain by the measurement of the extent of the diffraction spot. Recently, three-dimensional grain mapping techniques for polycrystalline materials have received considerable attention. New mapping techniques, based on the diffraction of a synchrotron beam, such as three-dimensional X-ray diffraction microscopy [6] and differential aperture X-ray microscopy [7] have been proposed. Nondestructive grain mapping techniques have been used to analyze the microstructural changes related to the deformation and the annealing processes in metallic samples. Data acquisition technique for the simultaneous reconstruction of the three dimensional shape of grains in a bulk polycrystalline material has been proposed by Ludwig et al. [8]. This procedure is called X-ray diffraction contrast tomography (DCT), which is similar to the conventional X-ray absorption contrast tomography. DCT can simultaneously provide information on the three-dimensional grain arrangement of a sample, such as the shapes, locations, and crystallographic orientations of grains, together with microstructural features visible in the X-ray absorption contrast such as cracks, pores, and inclusions.
The authors proposed a hybrid technique combined DCT with the microbeam X-ray method, which enables the estimation of dislocation structure of each crystallographic grain in polycrystalline alloys [9]. In the present study, the change of misorientation of each grain in a polycrystalline alloy and metals in fatigue process is identified as a function of resolved shear stress in the slip direction. To identify the crack initiation, the reflection contrast tomography (RCT) is more adequate, and preferable sample-to-detector distance for DCT is different from that of RCT, then, dual detector system was constructed for the present study.
2. Theory
2.1. Principle of DCT
The apparatus used for the DCT is identical to the conventional microtomographic imaging setup. During a tomographic scan, grains embedded in the bulk of a polycrystalline sample, those satisfies Bragg’s condition of diffraction, produce a bright diffraction spot as shown in Figure 1. At the same time, an extinction spot with the same shape can be observed in the transmitted beam, which is set behind the sample. Since each grain produces diffraction and extinction spot, they must be classified into groups belonging to individual grains. For grains with no misorientation, the shapes of diffraction/extinction spots are corresponding to the projection of grain from incident X-ray direction, then, the three-dimensional grain shapes can be reconstructed. Once the diffraction/extinction spot pairs have been assigned to a grain, its crystallographic orientation can be identified.
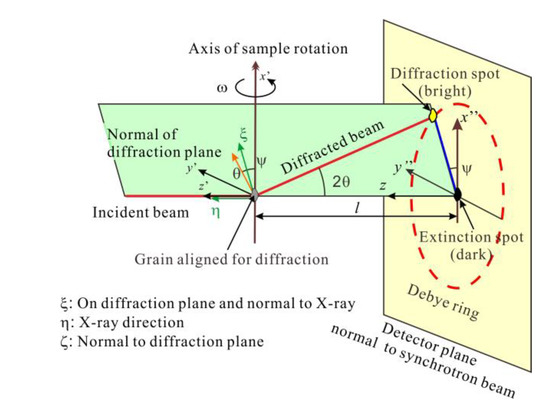
Figure 1.
Principle of DCT.
2.2. Spot Summation and Segmentation of Diffraction and Extinction Spots
Usually, every grain has misorientation due to dislocations, the diffraction and extinction spot images were spread over a range of the rotation angles, and only part of the diffracting grain appeared in each projection image. Therefore, the contributions from the same grain under each diffraction condition should be summed.
The diffraction and extinction spots are similar in shape but have opposite brightness. The extinction spot corresponding to each diffraction spot can be identified by template matching. The crystallographic orientation of each grain can be calculated from the locations of pairs of diffraction and extinction spots. Information on the diffraction spots is useful in the segmentation of extinction spots, which often have considerable overlap.
2.3. Classification of Diffraction and Extinction Spots and Tomographic Reconstruction of Grain
Because one grain has many crystallographic planes, several extinction and diffraction spots appear during a rotation of a sample. The segmented extinction spots should be classified into sets belonging to the same grain. This procedure was accomplished by the following two filtering steps. Each extinction spot is a projection of a grain, and hence, the vertical position of the spot is invariant during the tomographic rotation. The top and bottom vertical limits of the extinction spots belonging to the same grain are therefore employed as a criterion. In the second step, the centerlines of the spots are back-projected onto the sample plane, while taking into account the corresponding rotation angles. The intersection of the lines obtained by back-projection of the extinction spot projections provides an approximate grain position. The orientation of each diffraction plane can also useful for the classification.
A tomographic reconstruction can be obtained for each grain using a standard algebraic reconstruction algorithm (ART) based on the parallel beam geometry [10]. By stacking the reconstructed two-dimensional slices, the corresponding three-dimensional grain volumes can be assembled.
2.4. Total Misorientation
Spread of rotation angle which satisfies the Bragg’s diffraction condition, Δωdiff, reflects the curvature of a crystallographic plane, i.e., excessive dislocation density, and the total misorientation, β, of the plane can be calculated by measuring the diffraction angle, θ, and the position of the diffraction spot in Debye ring, ψ, those are defined in Figure 1 [11].
2.5. Slip Direction and Schmid Factor
Normal unit vector of the diffraction plane in the coordinate system fixed to the sample is given by the values, θ, ψ, and ω, where ω is rotation angle of a sample from a reference position. Orientation and Schmid factor of each grain can be determined from the intersections of two diffraction planes [11].
3. Experimental Procedure
3.1. Materials and Specimens
An austenitic stainless steel was employed for experiments. It was heat treated at 1373 K for 0.5 h followed by furnace cooling. After the heat treatment, the average grain size was 55 μm, and the 0.2% proof stress was 278 MPa. Fatigue tests were conducted at the stress ratio, R, of -1 with the loading frequency, f, of 20 Hz using specimens of a rectangular crosssection with 0.3 mm width and 0.3 mm thickness as shown in Figure 2.
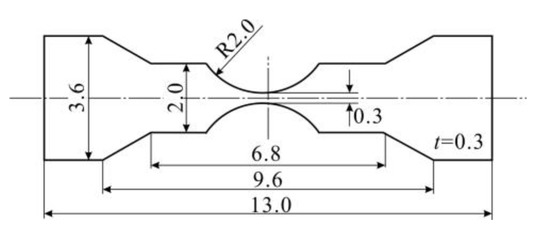
Figure 2.
Shape and dimensions of pecimen.
3.2. Experimental Setup
Schematic illustration of the fatigue-testing machine and the DCT imaging apparatus are shown in Figure 3. Piezoelectric element (PZT) driven actuators were employed for the fatigue-testing machine, which was small enough to put on the rotating stage for the DCT imaging. Then inline fatigue tests could be conducted. DCT was performed at a bending beam line, BL19B2, of SPring-8. This beam line delivers an X-ray beam with high brightness and high spatial coherence, allowing microtomography to be performed with high spatial resolution in the μm range [12,13,14,15]. The polychromatic synchrotron beam was monochromated to an energy of 37 keV using a Si {111} double-crystal monochromator. Two-dimensional projection images were recorded on a high-resolution detector system based on a transparent luminescent screen, light optics, and a CCD camera.
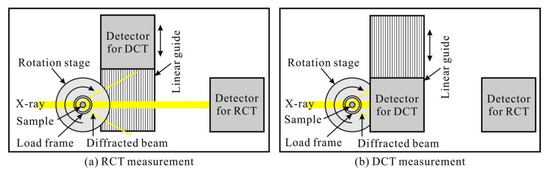
Figure 3.
Schematic of dual camera measurement system.
The sample-to-detector distance was 10 mm for DCT measurement. An effective pixel size of 2.7 μm was employed in the projection image for the experiment. The size of the beam at the sample position was limited to 1.0 mm × 1.0 mm by using an X-ray slits to detect diffraction spots. Projection images were obtained at intervals of 0.06° over 180°. The fatigue tests were interrupted and the DCT imaging was conducted after certain numbers of cycles.
4. Experimental Results and Discussion
The cross section of the crack initiation site is shown in Figure 4, where the crack initiation site observed by the RCT imaging of the same specimen is also indicated. To examine the dependence of the crystallographic planes, the changes in the values of the total misorientation, β, with the number of cycles are shown in Table 1, where the averaging were conducted for all diffraction spots in the specimen, and the numbers of cycles shown in the last column are just before the failure of specimens. It is obvious for the results of {111} plane (primary slip plane) that the values were increased with the number of cycles, suggesting that the dislocation density increased with the number of cycles. The values for other planes remain unchanged except just after the start of the fatigue tests.
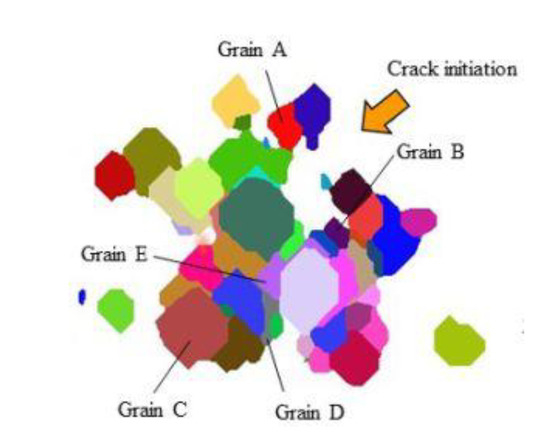
Figure 4.
Cross section of specimen at crack initiation site.

Table 1.
Change of average value of total misorientation, βave.
Since each grain has different value of β, the values of a primary slip plane for a specific grain shown in Figure 4 were examined. As shown in Figure 5, the value for a plane in Grain B shows the great change, while others remain almost unchanged. Although every grain has four {111} planes, only two planes could be identified in these grains. Other two planes may be classified to belong to another grain. These four {111} planes are crystallographically equivalent but have different resolved shear stress. Thus, they are not mechanically equivalent and the change in β with the number of cycles depends on the resolved shear stress in each plane, which depends on the slip direction relative to the loading axis.
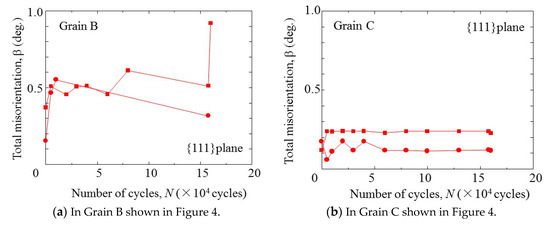
Figure 5.
Change of total misorientation of individual grain in fatigue.
The change of β may come from the change in the dislocation density in the slip system. As a result, the first crack initiation may have been occurred in a grain, which had the maximum change of β that was Grain B in Figure 5.
The average values of β increased in fatigue process as shown in Table 1, but the value for each diffraction plane did not increase monotonically, but they fluctuate as shown in Figure 5. This behavior may reflect the annihilation, multiplication and/or the structure of dislocations. The maximum values of the change in β during fatigue process in each primary slip plane, Δβmax are shown in Figure 6 as a function of Schmid factor of each plane, Fs, where the effect of constraint from their neighbor grains was ignored. The values of Δβmax depended on the orientation of diffraction planes and the value was greater for greater Schmid factor, Fs, i.e., greater resolved shear stress on the plane. A fatigue crack was first initiated from the grain, which had the highest value of Δβmax. This information is very useful for the study of the fatigue crack initiation.
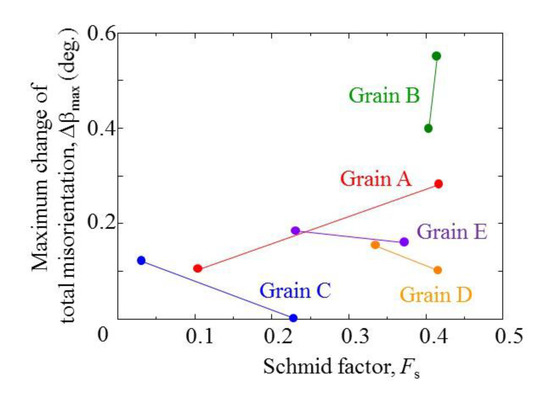
Figure 6.
Effect of Schmid factor on maximum change of total misorientation, β, in fatigue.
It is interesting to know that the maximum value of the Schmid factor is close to 0.5, and the small discrepancy from 0.5 must come from the fact that the size of the present specimen, i.e., the number of grains around the cross section, was not large enough to apply continuum mechanics. Then, the slip plane and the slip directions in the bulk sample are considered to agree with those given by the continuum mechanics. For bulk polycrystalline material, grains those have slip systems, which are almost coincident with the maximum slip plane and the slip direction of continuum mechanics must be received largest fatigue damage. This is consistent with the observations by Nakai et al. [16,17,18], where the condition of the fatigue crack initiation was provided by the continuum mechanics.
5. Conclusions
In the present study, the change of misorientation of individual grains in fatigue was estimated using ultrabright synchrotron radiation, which is one of the techniques for three-dimensional grain mapping of polycrystals. Inline fatigue testing machine was developed for this experiments. The results obtained were as follows.
- (1)
- Total misorientation, β, of each grain could be evaluated from the spread of the diffraction angle and the position of the diffraction spots in Debye ring of each grain.
- (2)
- The changes in the average values of βave for {111} plane (primary slip plane) were increased with the number of cycles in fatigue tests. The values for other planes remained unchanged.
- (3)
- The value of β showed the greatest change for a plane in a grain at the crack initiation site, while the values for other planes of the grain at the crack initiation site and other grains remained almost unchanged.
- (4)
- The maximum change of β during fatigue process in each primary slip plane, Δβmax were larger for larger Schmid factor, Fs, and a fatigue crack was first initiated from the grain, which had the highest value of Δβmax.
Acknowledgments
The synchrotron radiation experiments were conducted at BL19B2 in SPring-8 with the approval of the Japan Synchrotron Radiation Research Institute under proposal numbers, 2016A1563, 2016B1627, and 2017A1603. The authors are grateful to K. Kajiwara for his technical support. Support of this work through by Grant-in-Aid for Scientific Research (B) from Japan Society for the Promotion of Science under proposal number 26289008 (Head investigator: Y. Nakai, Kobe University) is also gratefully acknowledged.
Conflicts of Interest
The authors declare no conflict of interest.
References
- Suresh, S. Fatigue of Materials; Cambridge University Press: Cambridge, UK, 1991. [Google Scholar]
- Gay, P.; Hirsch, P.B.; Kelly, A. The estimation of dislocation densities in metals from X-ray data. Acta Metall. 1953, 1, 315–319. [Google Scholar] [CrossRef]
- Taira, S.; Hayashi, K. X-Ray investigation on fatigue fracture of notched steel specimen: Observation of fatigue phenomena of annealed low-carbon steel by X-ray microbeam technique. Bull. Jpn. Soc. Mech. Eng. 1966, 9, 627–636. [Google Scholar] [CrossRef]
- Taira, S. X-ray-diffraction approach for studies on fatigue and creep. Exp. Mech. 1973, 13, 449–463. [Google Scholar] [CrossRef]
- Nakai, Y.; Tanaka, K.; Nakanishi, T. The effects of stress ratio and grain size on near-threshold fatigue crack propagation in low-carbon steel. Eng. Fract. Mech. 1981, 15, 291–302. [Google Scholar] [CrossRef]
- Poulsen, H.F. Three-Dimensional X-Ray Diffraction Microscopy. Mapping Polycrystals and Their Dynamics; Springer Tracts in Modern Physics; Springer: Berlin, Germany, 2004. [Google Scholar]
- Larson, B.C.; Yang, W.; Ice, G.E.; Budai, J.D.; Tischler, T.Z. Three-dimensional X-ray structural microscopy with submicrometre resolution. Nature 2002, 415, 887–890. [Google Scholar] [CrossRef] [PubMed]
- Ludwig, W.; Schmidt, S.; Lauridsen, E.M.; Poulsen, H.F. X-ray diffraction contrast tomography: A novel technique for three-dimensional grain mapping of polycrystals. I. Direct beam case. J. Appl. Crystallogr. 2008, 41, 302–309. [Google Scholar] [CrossRef]
- Shiozawa, D.; Nakai, Y.; Miura, R.; Masada, N.; Matsuda, S.; Nakao, R. 4D evaluation of grain shape and fatigue damage of individual grains in polycrystalline alloys by diffraction contrast tomography using ultrabright synchrotron radiation. Int. J. Fatigue 2016, 82, 247–255. [Google Scholar] [CrossRef]
- Gordon, R.; Bender, R.; Herman, G.T. Algebraic reconstruction techniques (ART) for three-dimensional electron microscopy and X-ray photography. J. Theor. Biol. 1970, 29, 471–481. [Google Scholar] [CrossRef]
- Nakai, Y.; Shiozawa, D.; Asakawa, N.; Nonaka, K.; Kikuchi, S. Change of misorientation of individual grains in fatigue of polycrystalline alloys by diffraction contrast tomography using ultrabright synchrotron radiation. Struct. Integr. Procedia 2017, 3, 402–410. [Google Scholar] [CrossRef]
- Shiozawa, D.; Nakai, Y.; Nosho, H. Observation of 3D shape and propagation mode transition of fatigue cracks in Ti-6Al-4V under cyclic torsion using CT imaging with ultra-bright synchrotron radiation. Int. J. Fatigue 2014, 58, 158–165. [Google Scholar] [CrossRef]
- Shiozawa, D.; Makino, T.; Neishi, Y.; Nakai, Y. Observation of rolling contact fatigue cracks by laminography using ultra-bright synchrotron radiation. Procedia Mater. Sci. 2014, 3, 154–164. [Google Scholar] [CrossRef][Green Version]
- Makino, T.; Neishi, Y.; Shiozawa, D.; Fukuda, Y.; Kajiwara, K.; Nakai, Y. Evaluation of rolling contact fatigue crack path in high strength steel with artificial defects. Int. J. Fatigue 2014, 68, 168–177. [Google Scholar] [CrossRef][Green Version]
- Nakai, Y. and Shiozawa, D. Initiation and growth of pits and cracks in corrosion fatigue for high strength aluminium alloy observed by micro computed-tomography using ultra-bright synchrotron radiation. Appl. Mech. Mater. 2011, 83, 162–167. [Google Scholar] [CrossRef]
- Tanaka, K.; Nakai, Y.; Maekawa, M. Microscopic study of fatigue crack initiation and early propagation in smooth specimen of low carbon steel. J. Soc. Mater. Sci. Jpn. 1982, 31, 376–382. [Google Scholar] [CrossRef]
- Nakai, Y.; Kusukawa, T. Quantitative evaluation of slip-band growth and crack initiation in fatigue of 70-30 brass by means of atomic-force microscopy. Trans. Jpn. Soc. Mech. Eng. 2001, 67, 476–482. [Google Scholar] [CrossRef][Green Version]
- Nakai, Y. Evaluation of fatigue damage and fatigue crack initiation process by means of atomic-force microscopy. Mater. Sci. Res. Int. 2001, 7, 73–81. [Google Scholar] [CrossRef]
Publisher’s Note: MDPI stays neutral with regard to jurisdictional claims in published maps and institutional affiliations. |
© 2018 by the authors. Licensee MDPI, Basel, Switzerland. This article is an open access article distributed under the terms and conditions of the Creative Commons Attribution (CC BY) license (https://creativecommons.org/licenses/by/4.0/).