


Abstract
Post-earthquake analysis using radar interferometry has become a standard procedure for assessing earthquakes with significant damages. Sentinel-1 satellite provides 6-day revisiting time, and Sentinel-2 data has 5-day revisiting time and the same viewing angle that can enable the detection of changes in surface/land-cover after a major seismic event. Using Sentinel-2 alongside Sentinel-1 could bring new benefits when gathering spatial information about a post seismic event. In our study, we focused on analyzing a major earthquake, which occurred on 14 November 2016 with 7.8 magnitude near the city of Kaikōura, New Zealand, using both Sentinel-1 radar images and Sentinel-2 optical data. Hundreds of landslides were reported as a result of this earthquake. In addition, substantial land uplift was detected in some parts of the sea shore. Differential interferometry allowed us to estimate earthquake strength analyzing the distribution of absolute vertical displacement values. Sentinel-2 pre- and post-earthquake images were used in order to assess land-cover changes and automatically detect landslides, which occurred after the earthquake. Linking DInSAR results with Sentinel-2 change detection analysis helped us to get a more complex perspective on the earthquake impact, to create landslide inventory maps, and to subsequently develop workflows for quick post-event analysis.
1. Introduction
Earthquake impact assessment and subsequent landslide mapping have become the crucial tasks that follow a seismic event. A strong earthquake can potentially trigger thousands of landslides. Usually, the spatial extent that is affected by a strong earthquake is very big. In the case of the Kaikōura earthquake, up to hundreds of square kilometers were affected, which made it hard to quickly assess landslides using traditional mapping techniques. Radar interferometry offers substantial operational advantages over optical sensors, such as weather independence. Since the introduction of the ESA’s Sentinel-1B satellite, radar data has been made freely available at 6-day revisit time. Radar data has been already successfully used to assess earthquake triggered landslides [1], although usually L-band radar data (e.g., ALOS-PALSAR, JAXA) were used. When sensing surface changes, L-band radar data has an advantage over C-band, as it penetrates through vegetation and thus can get better coherence values.
A major effect of earthquakes is that they usually cause vertical changes and displacements in affected areas. One of the prominent techniques that can quantify such changes is satellite-based differential synthetic aperture radar interferometry (DInSAR) technology. This technique enables one to detect and measure displacements of the Earth’s surface over a period of time. DInSAR exploits the information contained in the radar phase before and after the earthquake takes place. It includes interferogram formation and the phase difference calculation between two satellite acquisitions taken from almost the same satellite position [2]. The phase difference can have multiple contributions from a flat Earth phase, topography, atmospheric effects, a phase noise, and a possible ground displacement component in the line-of-sight (LOS) direction [3]. The sensitivity of the DInSAR technique for displacements is usually in millimeters and can be used for long-term monitoring of landslides [4]. Besides identification of slow vertical motions, differential interferometry can be potentially used for detecting surface changes, which occur after strong earthquakes.
Sentinel-2 has been used in studies regarding the detection of temporal changes in crops [5,6,7], although when focusing on post-earthquake assessment, it is limited with regard to weather and cloud coverage. With Sentinel-2B operational satellite, the revisiting time was reduced to 5 days, which makes Sentinel-2 much more applicable. Combining SAR data with optical data thus can be beneficial when evaluating catastrophic events. There have been some studies, which focused on combining SAR data with optical data, but none of them focused directly on earthquake impact assessment. The combination of SAR data and Landsat data was successfully used for agriculture studies [8], forest structure mapping [9], and, recently, landslide mapping in Kenya [10]. To the best of our knowledge, there is no study combining Sentinel-1 and Sentinel-2 data for seismic and post-seismic hazard assessment while mostly working with the above-mentioned Landsat data or simulated Sentinel-2 data [7]. Sentinel-2, in comparison with Landsat-8, offers higher spatial resolution for selected bands (10 m in visible to near infrared bands), which allows mapping landscape changes at higher spatial detail.
The 2016 Mw7.8 Kaikōura earthquake occurred in the northeastern region of the South Island, New Zealand on 13 November 11:02 (UTM). The damaging earthquake generated extreme surface displacements, land deformations, and surface ground motions [11]. A detailed description of M7.8 Kaikōura complex rupture process is given by [12]. Hundreds of landslides were reported as a consequence of the earthquake. Most of the landslides were located in Hurunui District, North Canterbury, around Cape Campbell in Marlborough and in the Kaikōura Ranges [12].
In our paper, we demonstrate how DInSAR results derived from Sentinel-1 data and Sentinel-2 change detection analysis can be used to develop workflows for quick post-event analysis, to create landslide inventory maps, and overall, to get a complex perspective on the earthquake impacts.
2. Experiments
2.1. Satellite Data
Table 1.
Overview of Sentinel-1 scenes used.
Table 2.
Overview of Sentinel-2 scenes used.
2.2. Methods
As it was stated above, studies combining optical and radar remote sensing for landslide detection have been, up to now, still rather rare. Both types of satellite data can serve simultaneously as a source of different kinds of information. In our study, we have used radar interferometry for vertical displacement generation. We generated differential interferogram, which was phase-filtered using Goldstein phase filtering and multilooked using SNAP software. Phase unwrapping was done using Snaphu software. Displacement was then calculated from the unwrapped interferogram. Both differential interferogram and displacement in LOS direction were georeferenced using Range-Doppler Terrain Correction and used as quantification of earthquake impact and as indicators of the distribution of landslides [13].
Sentinel-2 data used in our study were, in the first step, atmospherically corrected using the flat field calibration (e.g, [14]). Cirrus clouds and thick clouds, and snow and water were mapped and masked out from the Sentinel-2 reflectance data. In order to map newly triggered landslides, vegetation cover was mapped in both images before and after the earthquake. To differentiate surfaces covered by vegetation from exposed surfaces, atmospherically resistant vegetation index (ARVI, [15]) was calculated. Unlike NDVI, this index is much less susceptible to atmospheric effects and thus can overcome some of the atmospheric-induced errors. Differences in mapped surface water classes were also assessed, as these could be caused by landslides or the earthquake itself. Both radar- and optical-based layers were matched with fault network and with the database of historical landslides in New Zealand, which is available to the public by the GNS Science (formerly Institute of Geological and Nuclear Sciences Limited) (Lower Hutt, New Zealand).
3. Results and Discussion
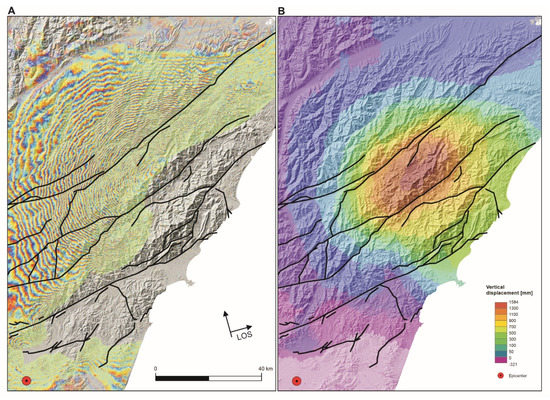
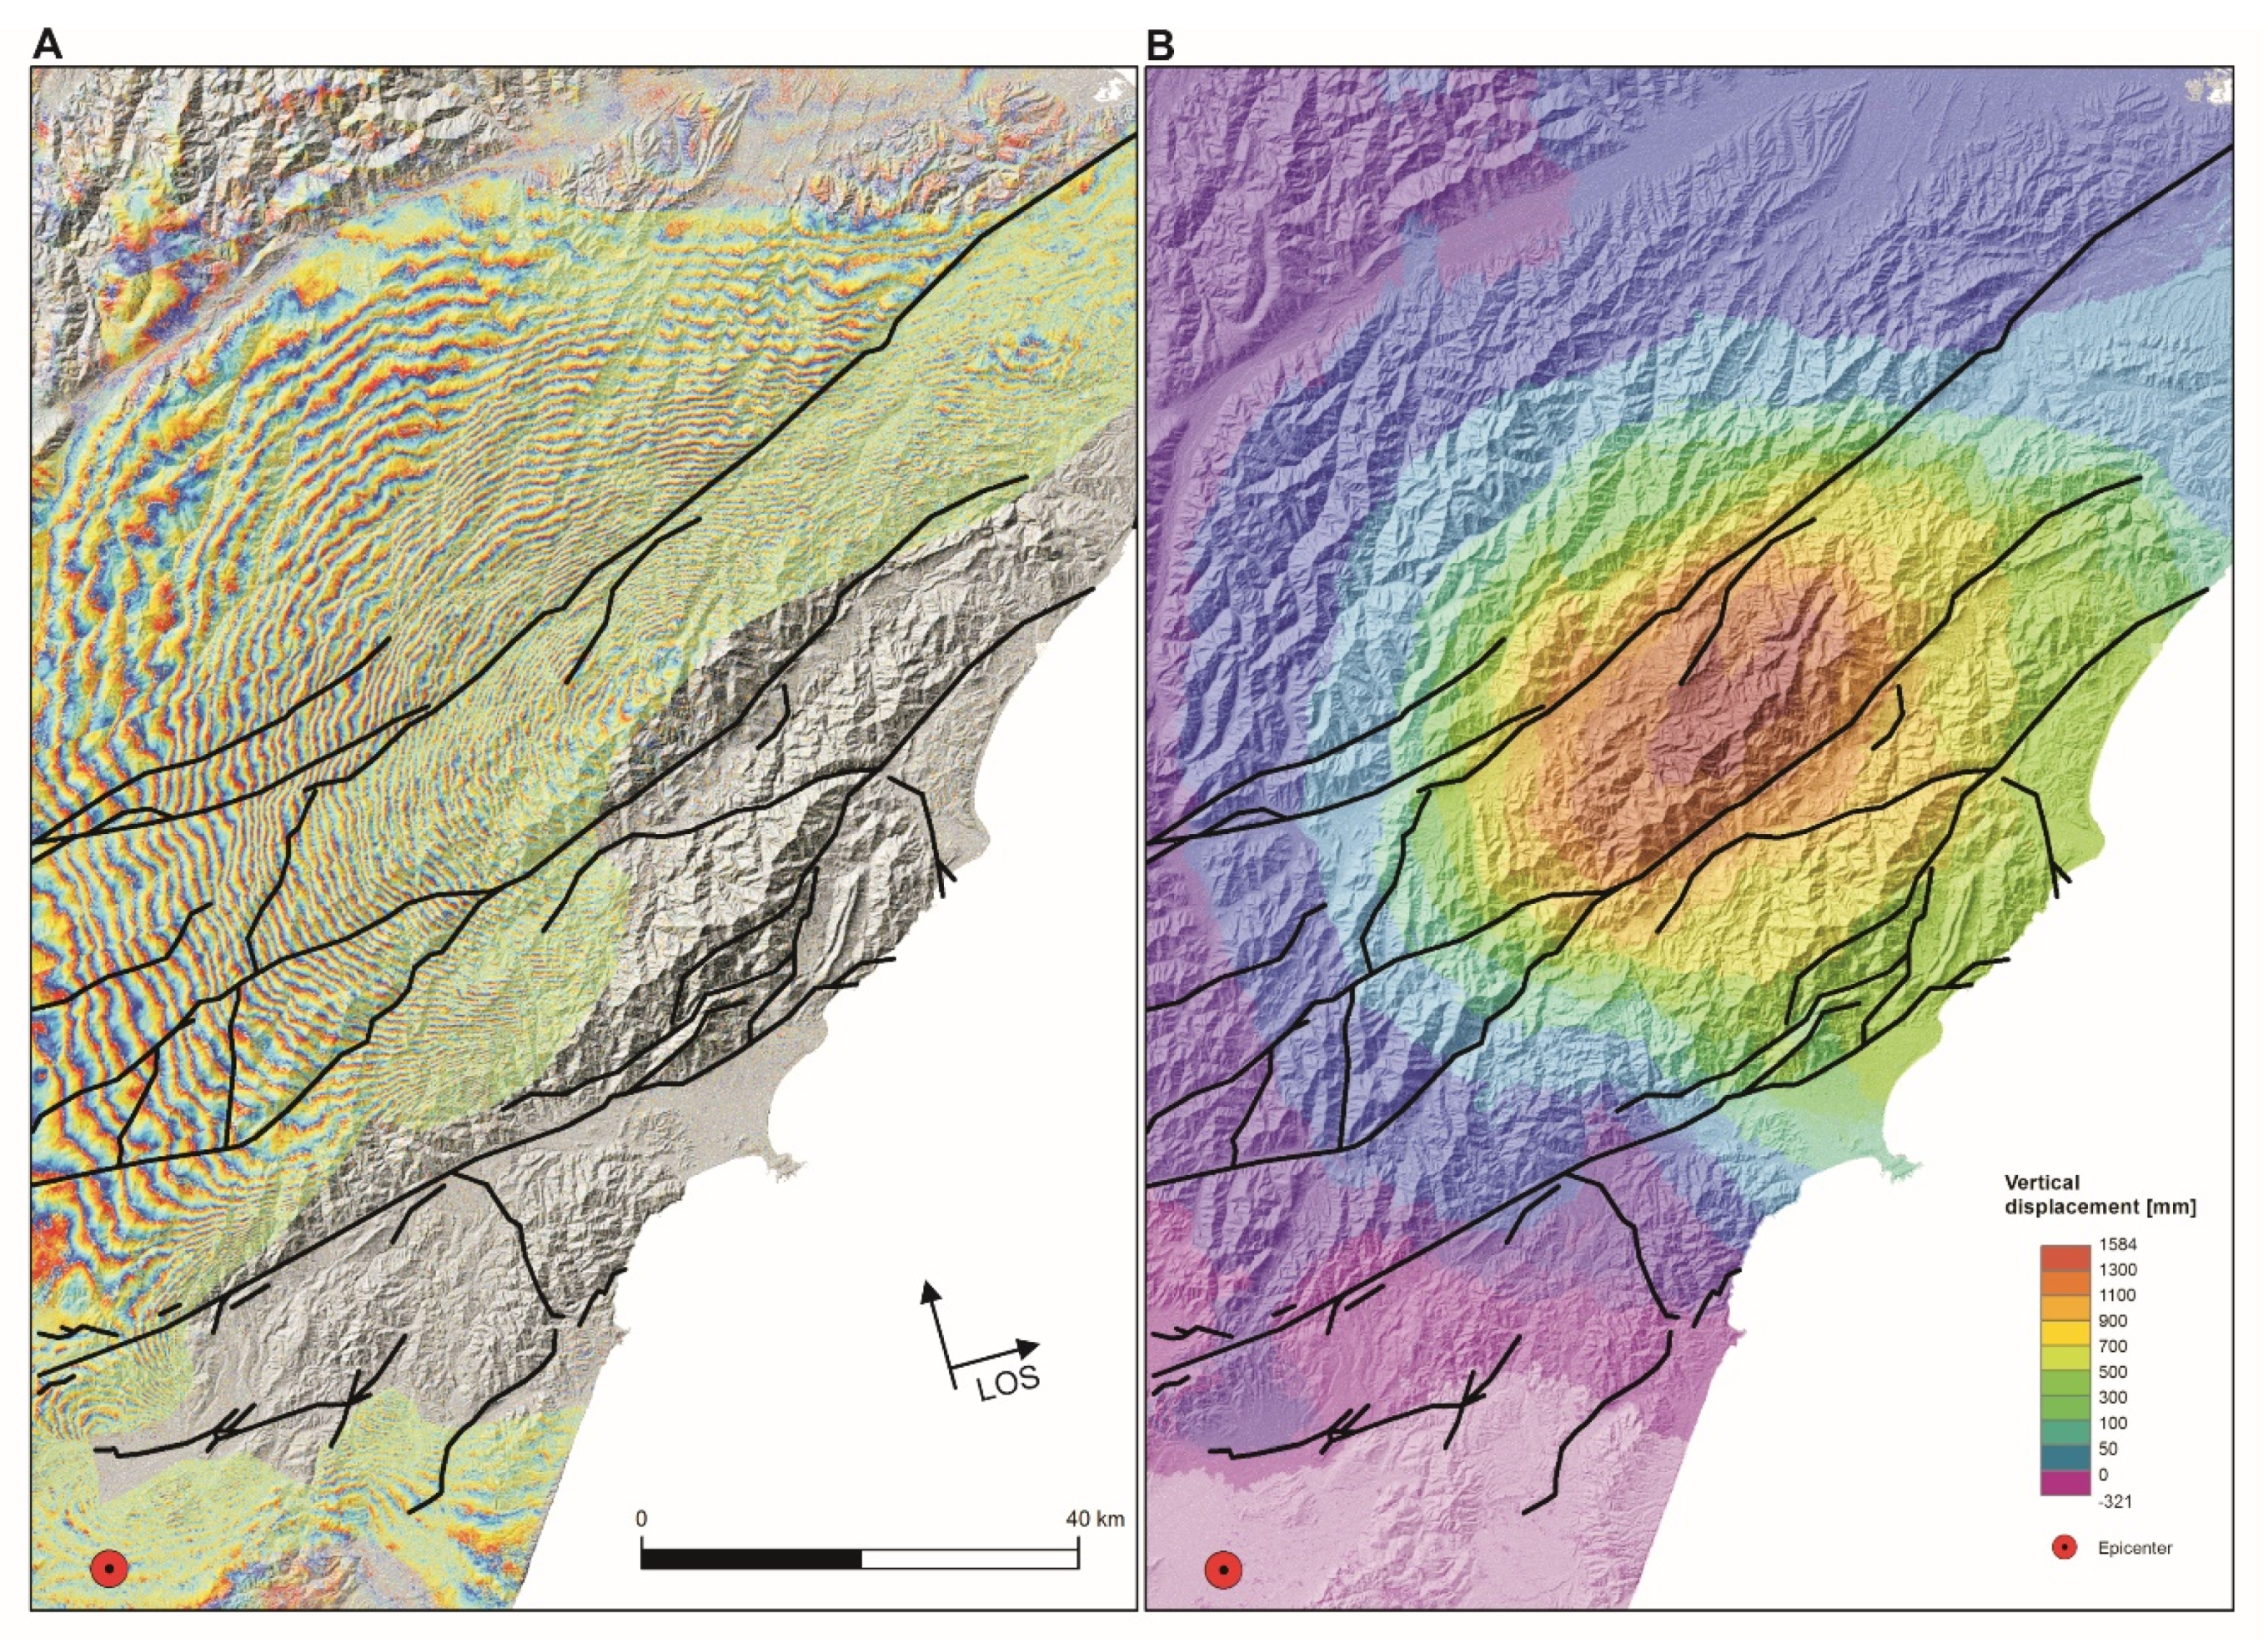
Landslides triggered by the Kaikōura earthquake occurred within very wide area characterized by complex terrain. Changes in vegetation cover were mapped using two scenes of Sentinel-2 and, together with the vertical displacement obtained from an interferometric pair of Sentinel-1 images, served as a basis for landslide analysis triggered by the earthquake. Figure 1 shows two maps with two results of differential interferometry. Differential interferogram (A) was clipped by relevant coherence (>0.5). Together with the displacement in the direction of LOS, it is possible to identify the most affected area. The maximum displacement was around 1.5 m in the inland part with significant displacement continuing towards the sea shore (B).
Figure 1.
Two maps showing differential interferogram from Sentinel-1 data acquired between 3 November 2016 and 15 November 2016 (A) and displacement in LOS direction generated from the same interferometric pair (B) are overlaid by major faults and the Kaikōura earthquake epicenter.
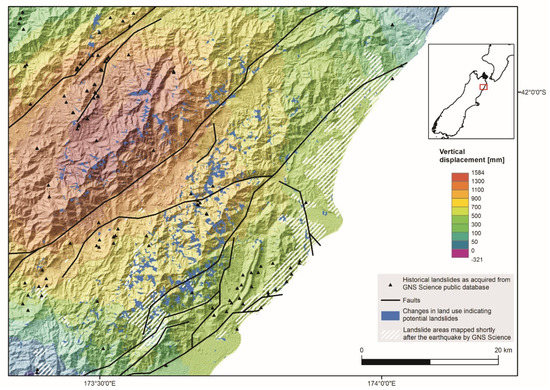
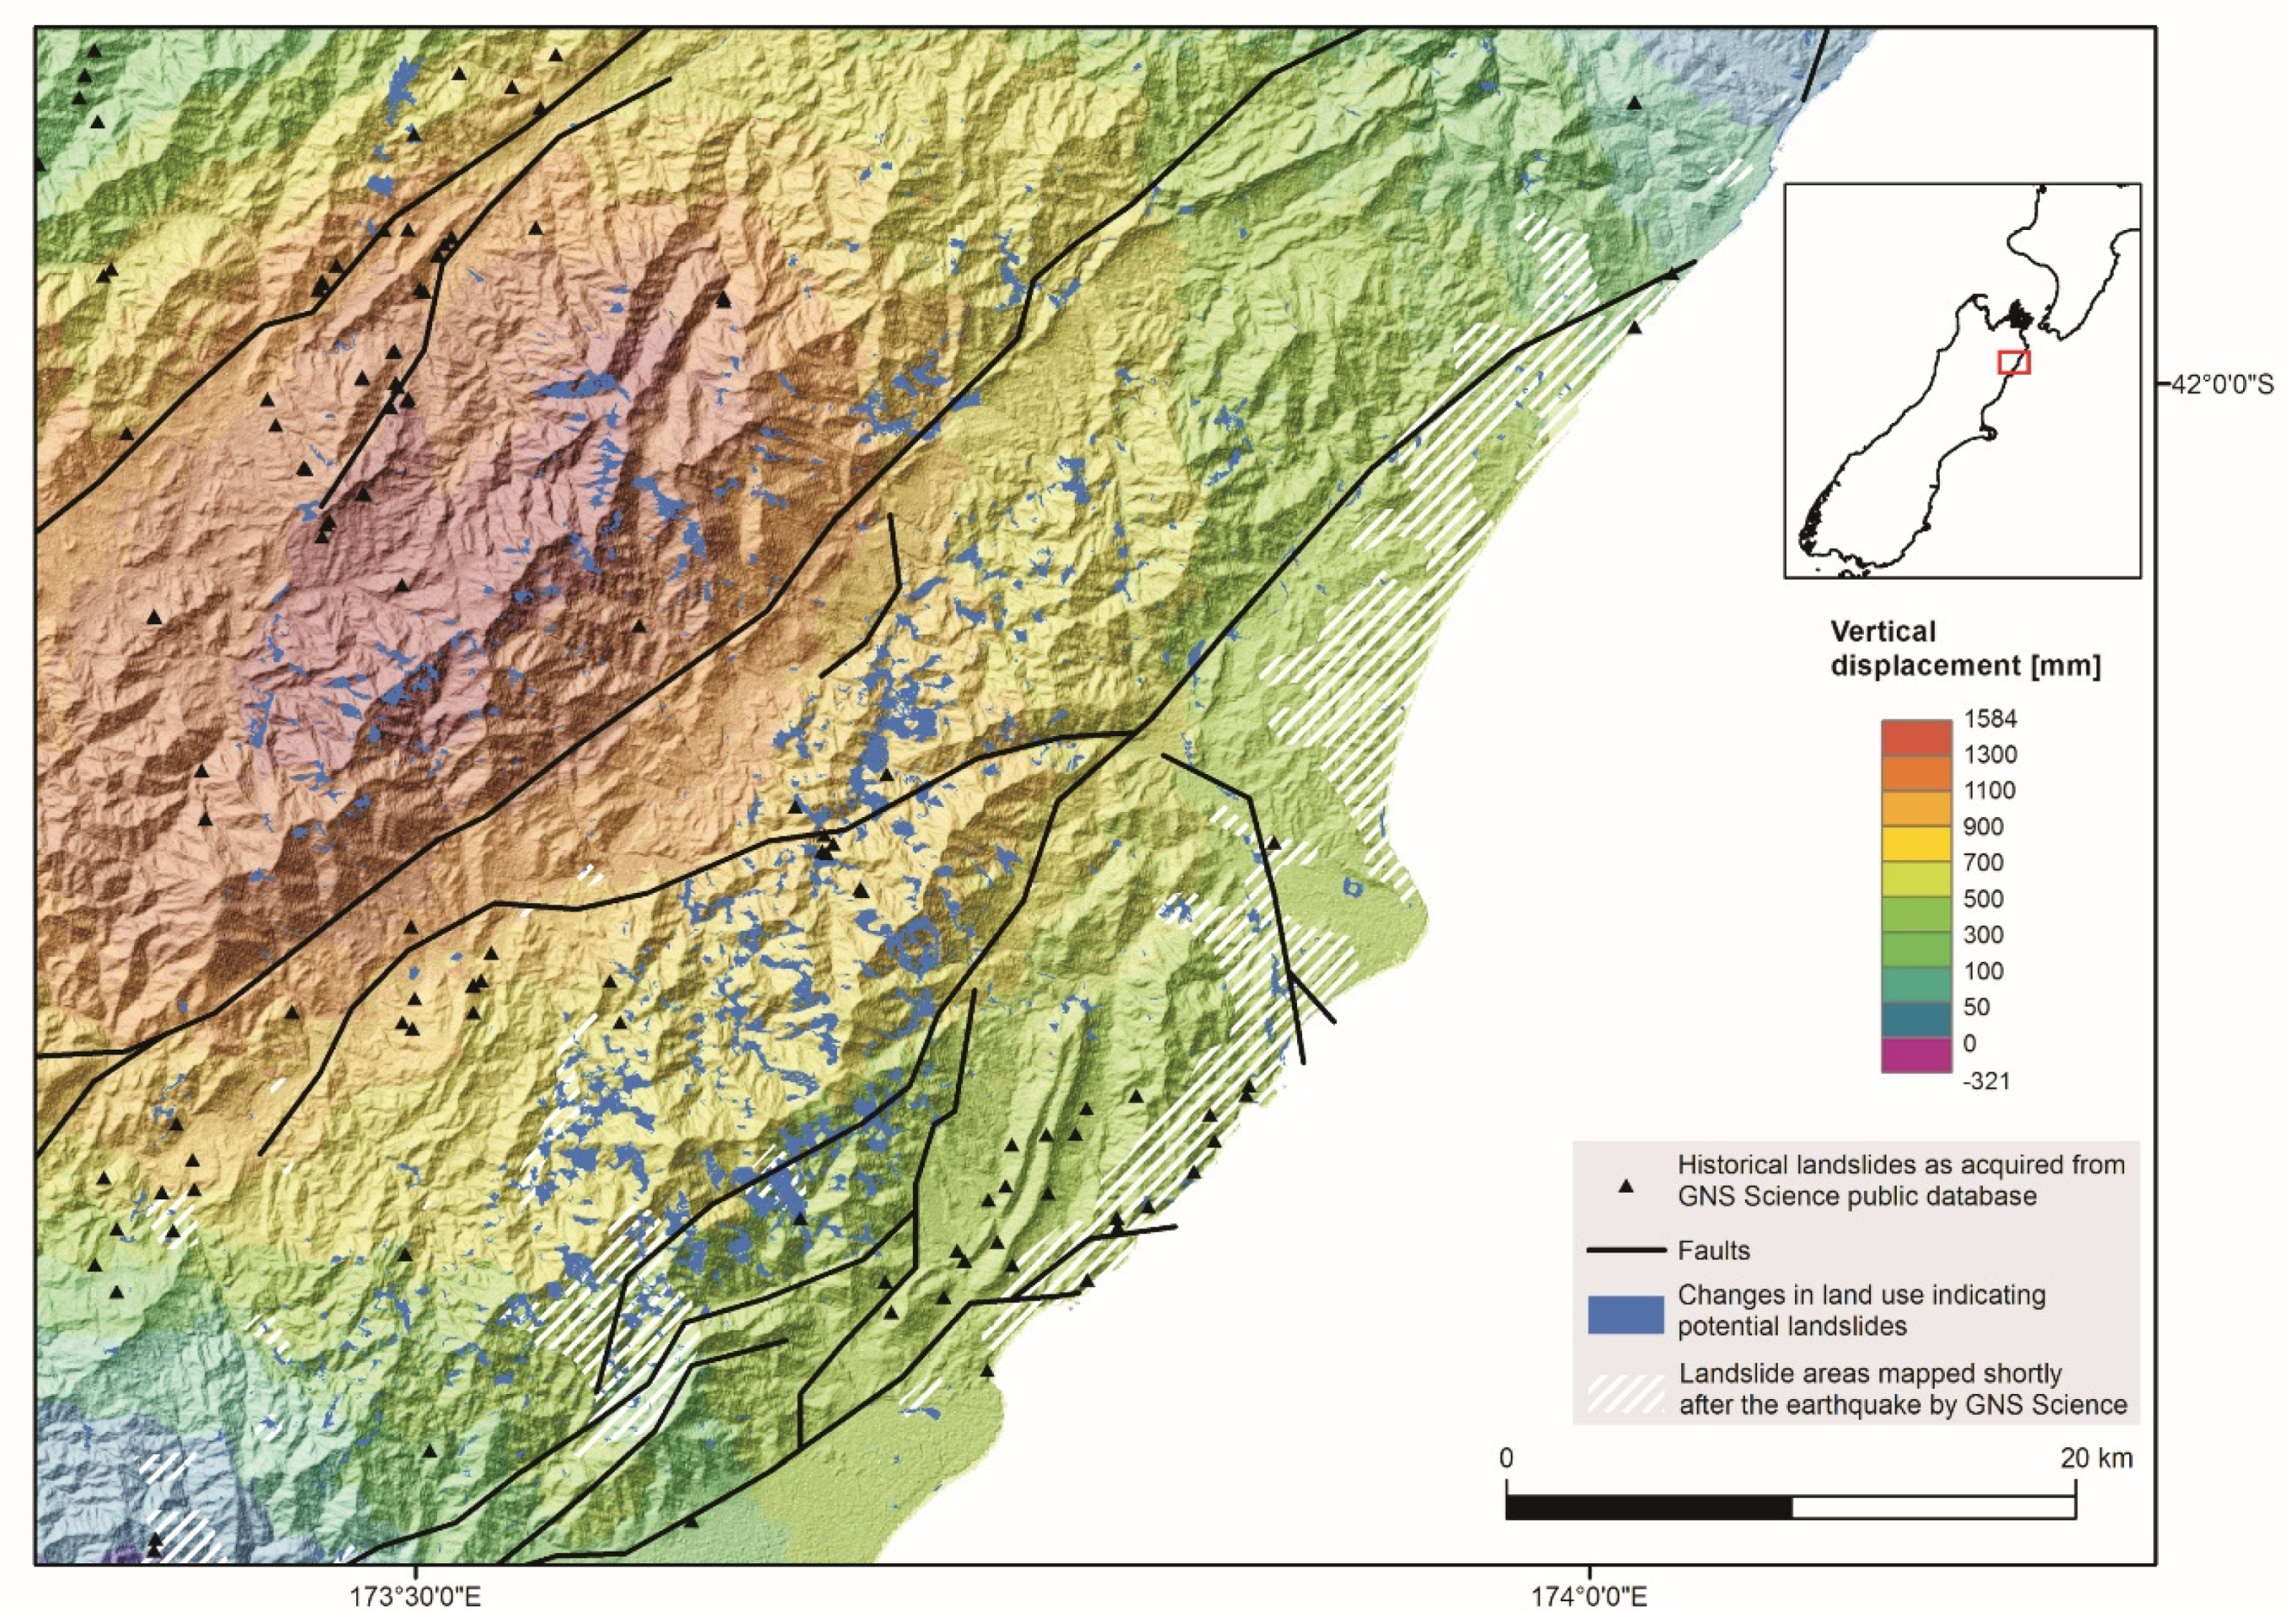
Landslides were mapped from the Sentinel-2 images over the most affected area of the South Island (see vertical displacement map (Figure 1B)). Mapped landslides were displayed together with the vertical displacement from the Sentinel-1 data and faults based on [16] (Figure 2). Areas, representing clusters of landslides mapped by [17] within first three months after the earthquake (hashed polygons, Figure 2), cover only some parts of the affected area. Results showed that all major landslides mapped by [17] for some affected areas corresponded very well with the landslides detected on the basis of Sentinel-2 images (Figure 3). However, using Sentinel-2 data we were able to map potential landslides within the whole affected area. We can conclude that most of the landslides identified from Sentinel-2 data are spatially connected with the known fault systems and within the areas characterized by higher vertical displacement values (>700 mm).
Figure 2.
Map shows areas that changed their surfaces to bare soil/rock following the Kaikōura earthquake and that are likely to be landslides triggered by the earthquake (the blue polygons).
Figure 3.
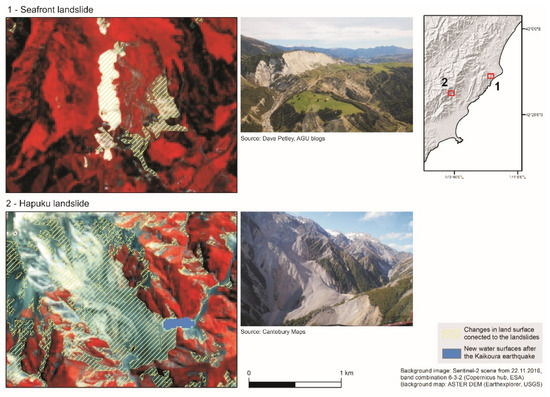
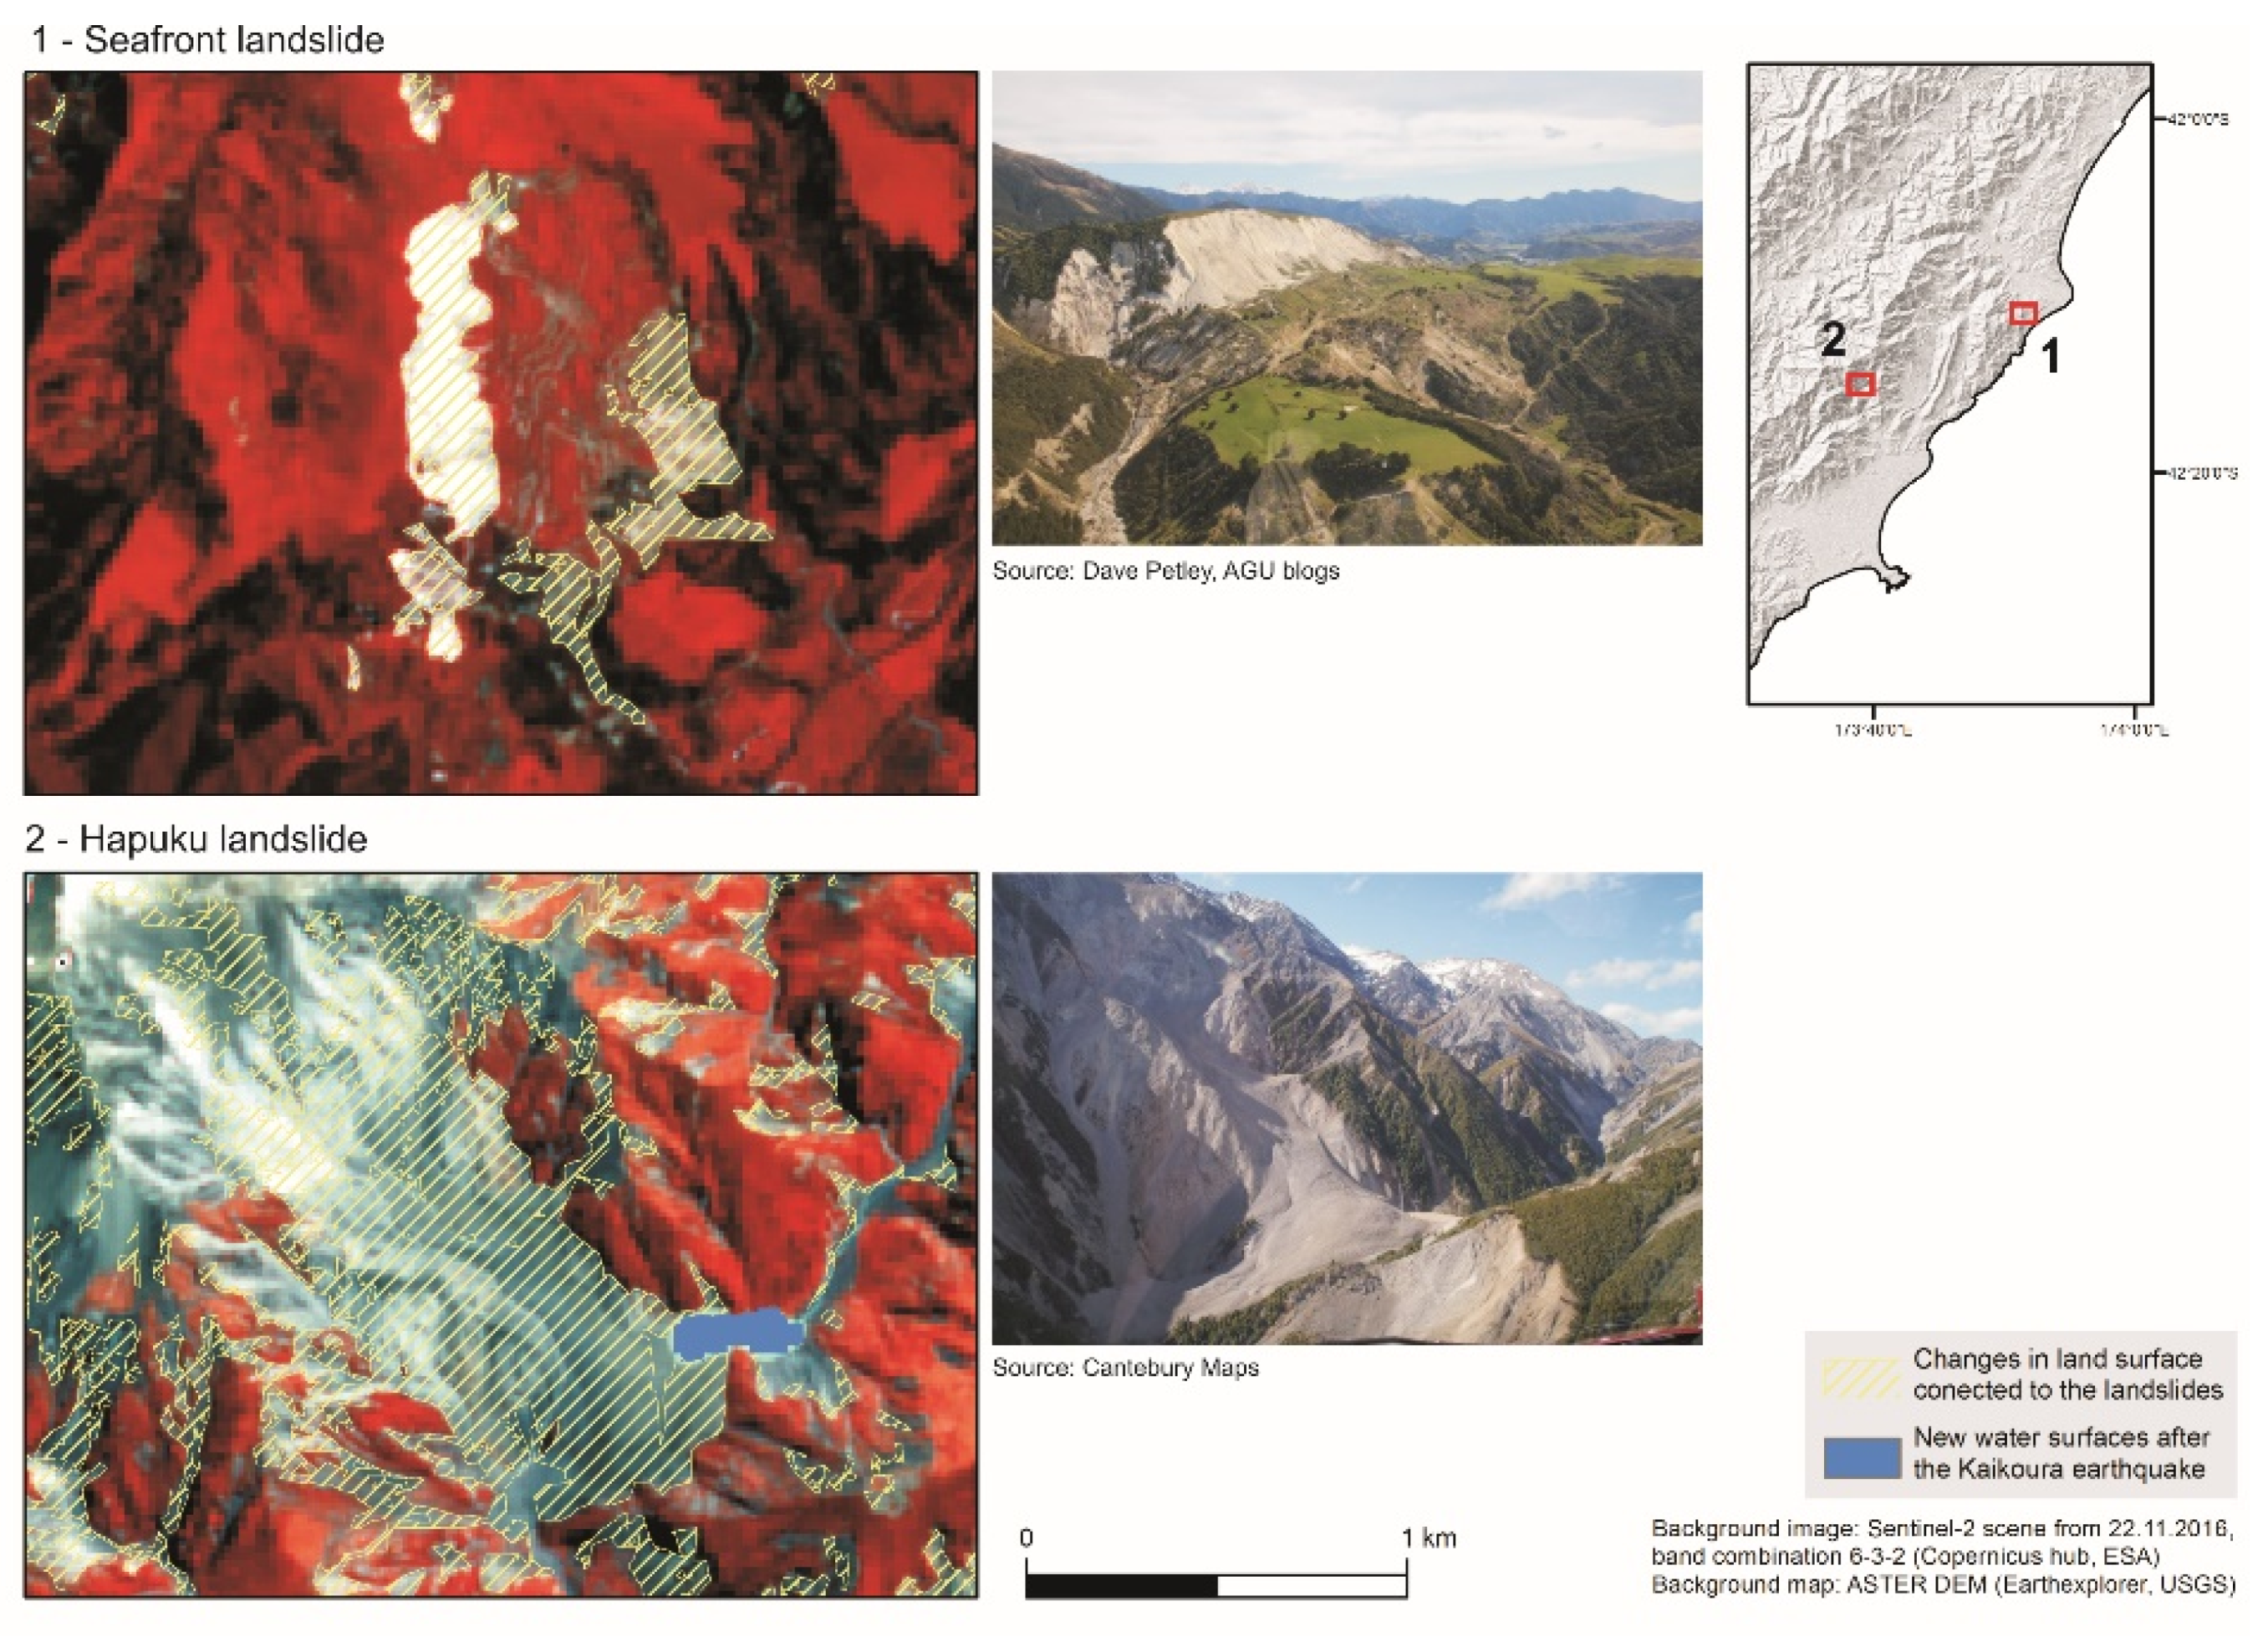
Two major landslides caused by the Kaikōura earthquake, derived from Sentinel-2 data.
In addition to landslides, new lakes/water bodies, created when new landslides blocked/changed the water/river flows, can be potentially dangerous. In our study, Sentinel-2 data allowed mapping such new water bodies, which is demonstrated in Figure 3 as an example of the big water body resulting from the Hapuku landslide, the biggest landslide triggered by the Kaikōura earthquake, with total area reaching 2 km2.
4. Conclusions
Synergic use of Sentinel-1 interferometric products and products derived from Sentinel-2 optical data could, taken together, allow for quick assessment and a complex earthquake impact analysis. Radar interferometry allowed us to assess earthquake impacts via computing vertical displacements and differential interferograms. Employing vegetation/water change detection on a basis of pre and post-event Sentinel-2 data allowed us to identify the new landslides and water bodies resulting from the Kaikōura earthquake. Sentinel-2 data provides more bands over visible (VIS) and near-infrared (NIR) regions of the electromagnetic spectrum at a higher spatial resolution (up to 10-m) in comparison with other satellites (e.g., Landsat), thus enabling more detailed detection of land cover changes. Due to the short revisiting time of both Sentinel-1 and Sentinel-2 satellites, it is possible to analyze major seismic events and post-seismic impacts shortly after event occurrence over large areas and identify critical “hot-spots” faster.
Author Contributions
Jan Jelének performed the processing work of the radar data and prepared a draft version of the manuscript. Veronika Kopačková performed processing of the optical data. Kateřina Fárová helped with the processing of the radar data. All authors have read and agreed to the published version of the manuscript.
Acknowledgments
Research was conducted under the Czech geological survey grant No. 321610.
Conflicts of Interest
The authors declare no conflict of interest.
Abbreviations
The following abbreviations are used in this manuscript:
| ARVI | Atmospherically resistant vegetation index |
| DInSAR | Differential synthetic aperture radar interferometry |
| ESA | European space agency |
| LOS | Line of sight |
| NDVI | Normalized difference vegetation index |
| SAR | Synthetic aperture radar |
References
- Czuchlewski, K.R.; Weissel, K.; Kim, Y. Polarimetric synthetic aperture radar study of the Tsaoling landslide generated by the 1999 Chi-Chi earthquake, Taiwan. J. Geophys. Res. 2003, 108, 1–11. [Google Scholar] [CrossRef] [Scilit]
- Hanssen, R.F. Radar Interferometry: Data Interpretation and Error Analysis, 1st ed.; Springer: Dordrecht, The Netherlands, 2001. [Google Scholar]
- Osmanoglu, B.; Sunar, F.; Wdowinski, S.; Cabral-Cano, E. Time series analysis of InSAR data: Methods and trends. ISPRS J. Photogramm. Remote Sens. 2016, 115, 90–102. [Google Scholar] [CrossRef] [Scilit]
- Lazecký, M.; Comut, F.C.; Hlaváčová, I.; Gürboga, S. Practical Application of Satellite-Based SAR Interferometry for the Detection of Landslide Activity. Procedia Earth Planet. Sci. 2015, 15, 613–618. [Google Scholar] [CrossRef] [Scilit]
- Belgiu, M.; Csillik, O. Sentinel-2 cropland mapping using pixel-based and object-based timeweighted dynamic time warping analysis. Remote Sens. Environ. 2018, 204, 509–523. [Google Scholar] [CrossRef] [Scilit]
- Valero, S.; Mroin, D.; Inglada, J.; Sepulcre, G.; Arias, M.; Hagolle, O.; Dedieu, G.; Bontemps, S.; Defourny, P. Processing Sentinel-2 image time series for developing a real-time cropland mask. In Proceedings of the 2015 IEEE International Geoscience and Remote Sensing Symposium (IGARSS), Milan, Italy, 26–31 July 2015. [Google Scholar]
- Veloso, A.; Mermoz, S.; Bouvet, A.; Le Toan, T.; Planells, M.; Dejoux, J.-F.; Ceschia, E. Understanding the temporal behavior of crops using Sentinel-1 and Sentinel-2-like data for agricultural applications. Remote Sens. Environ. 2017, 199, 415–426. [Google Scholar] [CrossRef] [Scilit]
- Amorós-López, J.; Gómez-Chova, L.; Alonso, L.; Guanter, L.; Zurita-Milla, R.; Moreno, J.; Camps-Valls, G. Multitemporal fusion of Landsat/TM and ENVISAT/MERIS for crop monitoring. Int. J. Appl. Earth Obs. Geoinf. 2013, 23, 132–141. [Google Scholar] [CrossRef] [Scilit]
- Hyde, P.; Dubayah, R.; Walker, W.; Blair, J.B.; Hofton, M.; Hunsaker, C. Mapping forest structure for wildlife habitat analysis using multi.sensor (LiDAR, SAR/InSAR, ETM+, Quickbird) synergy. Remote Sens. Environ. 2006, 102, 63–73. [Google Scholar] [CrossRef] [Scilit]
- Mwanki, M.W.; Kuria, D.N.; Boitt, M.K.; Ngigi, T.G. Image enhancements of Landsat 8 (OLI) and SAR data for preliminary landslide identification and mapping applied to the central region of Kenya. Geomorphology 2017, 282, 162–175. [Google Scholar] [CrossRef] [Scilit]
- Wotherspoon, L.M.; Palermo, A.; Holden, C. The 2016 Mw7.8 Kaikōura Earthquake: An Introduction. Bull. N. Z. Soc. Earthq. Eng. 2017, 50, i–iv. [Google Scholar]
- Duputel, Z.; Rivera, L. Long-period analysis of the 2016 Kaikōura earthquake. Phys. Earth Planet. Interiors 2017, 265, 62–66. [Google Scholar] [CrossRef] [Scilit]
- Castaldo, R.; De Novellis, V.; Solaro, G.; Pepe, S.; Tizzani, P.; De Luca, C.; Bonano, M.; Manunta, M.; Casu, F.; Zinno, I.; et al. Finite element modelling of the 2015 Gorkha earthquake through the joint exploitation of DInSAR measurements and geologic-structural information. Tectonophysics 2017, 714–715, 125–132. [Google Scholar] [CrossRef] [Scilit]
- Matějíček, L.; Kopačková, V. Changes in Croplands as a Result of Large Scale Mining and the Associated Impact on Food Security Studied Using Time-Series Landsat Images. Remote Sens. 2010, 2, 1463–1480. [Google Scholar] [CrossRef] [Scilit]
- Kaufman, Y.J.; Tanre, D. Atmospherically resistant vegetation index (ARVI) for EOS-MODIS. IEEE Trans. Geosci. Remote Sens. 1992, 30, 261–270. [Google Scholar] [CrossRef] [Scilit]
- Langridge, R.M.; Ries, W.F.; Litchfield, N.J.; Villamore, P.; Van Dissen, R.J.; Barell, D.J.A.; Rattenbury, M.S.; Heron, D.W.; Haubrock, S.; Townsend, D.B.; et al. The New Zealand Active Faults Database. N. Z. J. Geol. Geophys. 2016, 59, 86–96. [Google Scholar] [CrossRef] [Scilit]
- Preliminary Landslide Inventory for the 2016 Kaikoura, New Zealand Earthquake Derived from Satellite Imagery and Aerial/Field Reconnaissance. Available online: http://www.geerassociation.org/component/geer_reports/?view=geerreports&id=80&layout=default (accessed on 5 November 2017).

Publisher’s Note: MDPI stays neutral with regard to jurisdictional claims in published maps and institutional affiliations. |
© 2018 by the authors. Licensee MDPI, Basel, Switzerland. This article is an open access article distributed under the terms and conditions of the Creative Commons Attribution (CC BY) license (https://creativecommons.org/licenses/by/4.0/).