1. Introduction
The freely available and easily accessible Landsat archive of more than 40 years, of consistent high resolution multispectral satellite data, offers an unparalleled opportunity for large scale analysis of phenomena observable at Landsat temporal and spatial resolutions. The urban growth is one of these phenomena, with great importance in fields like urban planning, risk and vulnerability analysis, telecommunication and other socio-economical analysis.
Several studies have shown that, Earth Observation can provide valuable data and information to monitor and analyse urbanization, and map the extent of settlements. However, a major issue with any classifier design, regardless of its complexity or robustness, is the feature selection step. This is a specially difficult task in the case of global or semi-global analysis. As the degree of generalization of the classification task increases, larger amount of data is to be considered, which results in increase in the inter- and intra-class variability, as more natural samples are added to the data pool. In the particular case of urban detection, the look, the distribution, and even the definition of what comprises urban areas differ across the globe in a significant way. For instance, whether roads are considered urban or not, this changes from one part of the world to another, according to the local definition of urban areas. The semantic disparity adds to the natural variation of the look and distribution of roads across the globe, which is substantial as it is.
Another major example is the buildings class. The appearance of buildings is heavily influenced by many cultural, environmental, economical and social factors, typically vary wildly on a global scale.
There are not many published works in the field of remote sensing doing exhaustive analysis of the feature space. This is first due to data availability, which greatly reduces the choice available for any research study, and secondly to the field expertise, which tempts researchers to use the typical features for the task in hand, rather than performing a very time consuming feature selection routine. There are, nevertheless, some surveys in the literature for the feature space. Torija and Ruiz [
1] have implemented three different methods for feature selection. First method is a correlation based feature-subset selection algorithm, the second one is a wrapper method, using three different induction algorithms. The third method is using PCA as an embedded dimensionality reduction tool, in order to project the features to a lower dimensional space. They did the study to select among the 32 variables relevant in the noise-pollution in the environment, before applying three different classifiers. Tokarczyk et al. [
2] did an investigation of features for the case of image segmentation into four classes. PCA and Deep Believe Networks were used as feature reduction techniques. Chan et al. [
3] have investigated texture features at 250 m resolution. 12 texture parameters were calculated for the infrared band. Different window sizes for the calculation of these features were used. The resulting 60 features were investigated using decision trees as an example of wrapper method.
The purpose of this work is to do an investigation of feature space for the large scale urban detection problem using Landsat data. The aim is to select the feature sub-set which maximizes the classification accuracy, for a reasonable computational cost. This feature selection step will precede and be independent of classifier choice, so the chosen feature set will perform consistently better than any other set, regardless of the used classification algorithm.
2. Landsat Features for Urban Classification
Many features have been suggested for the classification of Landsat data, with different achieved accuracy. The most popular features include:
Raw Landsat pixels [
4,
5].
2.1. Raw Pixels of Landsat Scene
This is a straightforward feature set, just using the spectral signature composed by the raw pixels in the various bands of Landsat to classify the land cover. This can be considered the baseline, with large room for improvement by extracting more specialized features. An obvious problem facing any method employing the raw pixels is the occlusion caused by clouds. There are easy ways to overcome this problem, given enough data and somewhat relaxed constraints for the classification problem. Simple averaging of the pixels over some time period (a year for instance) is ought to reduce the effect of clouds greatly.
2.2. Spectral Indices
The indices calculated from the Landsat bands emphasize different properties of land cover, according to the wavelength of the bands involved in the index computation. The general formula for these indices is
where
is the index between the two bands
i and
j.
is band number i in the scene.
These indices represent band-pass filters, sensitive for the corresponding wavelengths of the bands involved. As can be seen in the formula, these indices range from −1 to 1. There are generally six bands of the same resolution in Landsat 4,5,7. These six bands are the remaining ones after excluding the panchromatic and the thermal bands, as both have different resolutions compared to the other 30m bands. If an algorithm is to be compatible with old Landsat data as well as the new one, the new bands introduced in Landsat 8 should be avoided, restricting the used bands to the common ones. Using these six bands, it is possible to calculate 15 different indices with the formula above.
2.3. Texture
High texture value is a distinct feature of urban areas, as urban areas typically appear as dense texture against a rather smooth background (e.g., vegetation, bare-land, water). There are different types of texture descriptors in use for the problem of urban delineation, the most common one is the Gray Level Coocurance Matrix (GLCM) [
10,
11]. Other more sophisticated texture descriptors are Gabor and Haar textures.
3. Method
The goal here is not to use a generic feature ranking method, in order to derive an absolute feature importance ranking; the goal is rather to rank the features we have for the urban detection task, which is a binary classification problem. This condition makes the issue of feature selection much more accessible. The feature selection problem is described as follows
Let the feature vector be , if the classification accuracy of an ideal classifier C using all M features is , for label l, then we would like to find the indices s of a subset of size N which maximizes
where .
The typical curve of the classification accuracy of any classifier monotonically increases as a function of the number of features in the set , until it comes to a plateau after all important features have been added. The absolute theoretical maximum is achieved when . The order of the problem of feature ranking is , where is the factorial of N.
We used the two common methods of features selection in this work, these are wrappers and filters.
3.1. Filter Methods
In this class of methods the features are investigated separately, which implies the assumption of independence between them. This is in fact not the case in most of remote sensing data, as the features typical originate from the same source and therefore correlate. But these are still useful to evaluate the relative importance of features, and it is possible to combine them with other methods, in order to make the feature selection method more efficient.
3.1.1. Information Theoretic Based Methods
All these methods rely on the concept of mutual information, and they calculate the feature importance based on this value. The mutual information (MI) between the two sets
x and
y is defined as
where
H is the entropy, found as
Few measures have been used in this category [
12].
Asymmetric Dependency Coefficient (ADC)
Normalized Gain Ratio (Us)
Symmetric Gain Ratio (
)
3.2. Wrapper Methods
Wrapper methods or embedded methods are a family of algorithms which use the classifier itself for feature ranking, what is referred to as
induction algorithm. This can be demonstrated by Random Forest [
13] and SVM [
14], both of which can assign an importance index to each feature as part of their supervised training.
3.3. Voting Scheme
To combine the sub-sets suggested by all above methods, we implemented a two-tire voting scheme to aggregate the ranking of all methods. In the first round the different categories of methods each votes the best N features according to its measure. This is done by simply sorting the features according to importance, then choosing the N most important features. This pool of features is further reduced by a second round of voting, the size now is features, as the 5 categories of measures will vote N features each. In this round, the N statistical modes are taken to be the aggregated decision of all measures.
4. Results
4.1. Data
To evaluate the methods, five Landsat 8 scenes in Europe were used. The chosen scenes are: Path/Row (183/33) Athens, (193/23) Berlin, (183/29) Bucharest, (193/26) Munich and (199/26) Paris. As a first step towards a global urban feature design, this region in Europe was taken, with scenes from eastern, central and western Europe. The socio-economics of this region is comparable to some degree, and the landscape and urban structures are rather similar.
The scene with the least cloud-coverage from the year 2014 for each path/row was chosen, then the cloud masking was performed. The used ground truth was extracted from the Global Urban Footprint (GUF) [
15]. GUF is a binary layer which delineates the urban areas on a global scale based on TanDEM-X data.
For the subsequent experiments, 50,000 points were randomly chosen uniformly over each scene, with a constraint that at least 20% of the samples be of urban class. This is to adjust the class ratio, as the urban class covers only 3% of the pixels on average in all scenes, rendering the classification problem highly unbalanced.
The features computed are all 15 spectral indices, eight GLCM features for each band, and the average and mean of Gabor filter using three scales and three angles. The total number of features is 178 for each scene.
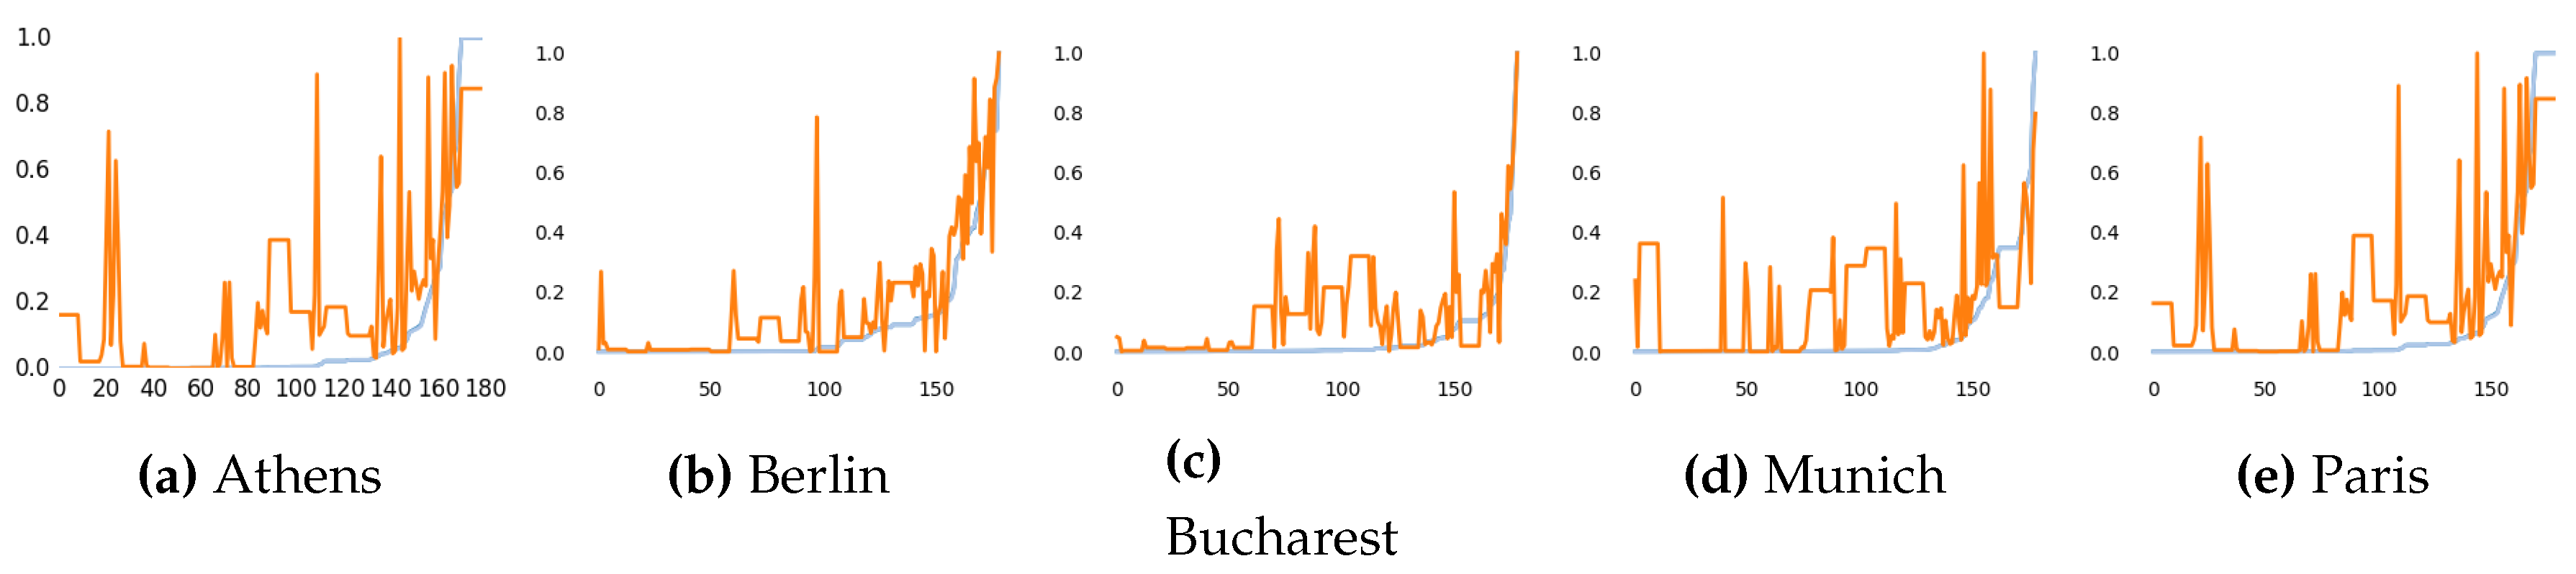
4.2. Best Features
To select the best sub-set of features, we used the different methods discussed in
Section 3. The ranking of mutual information methods is shown in
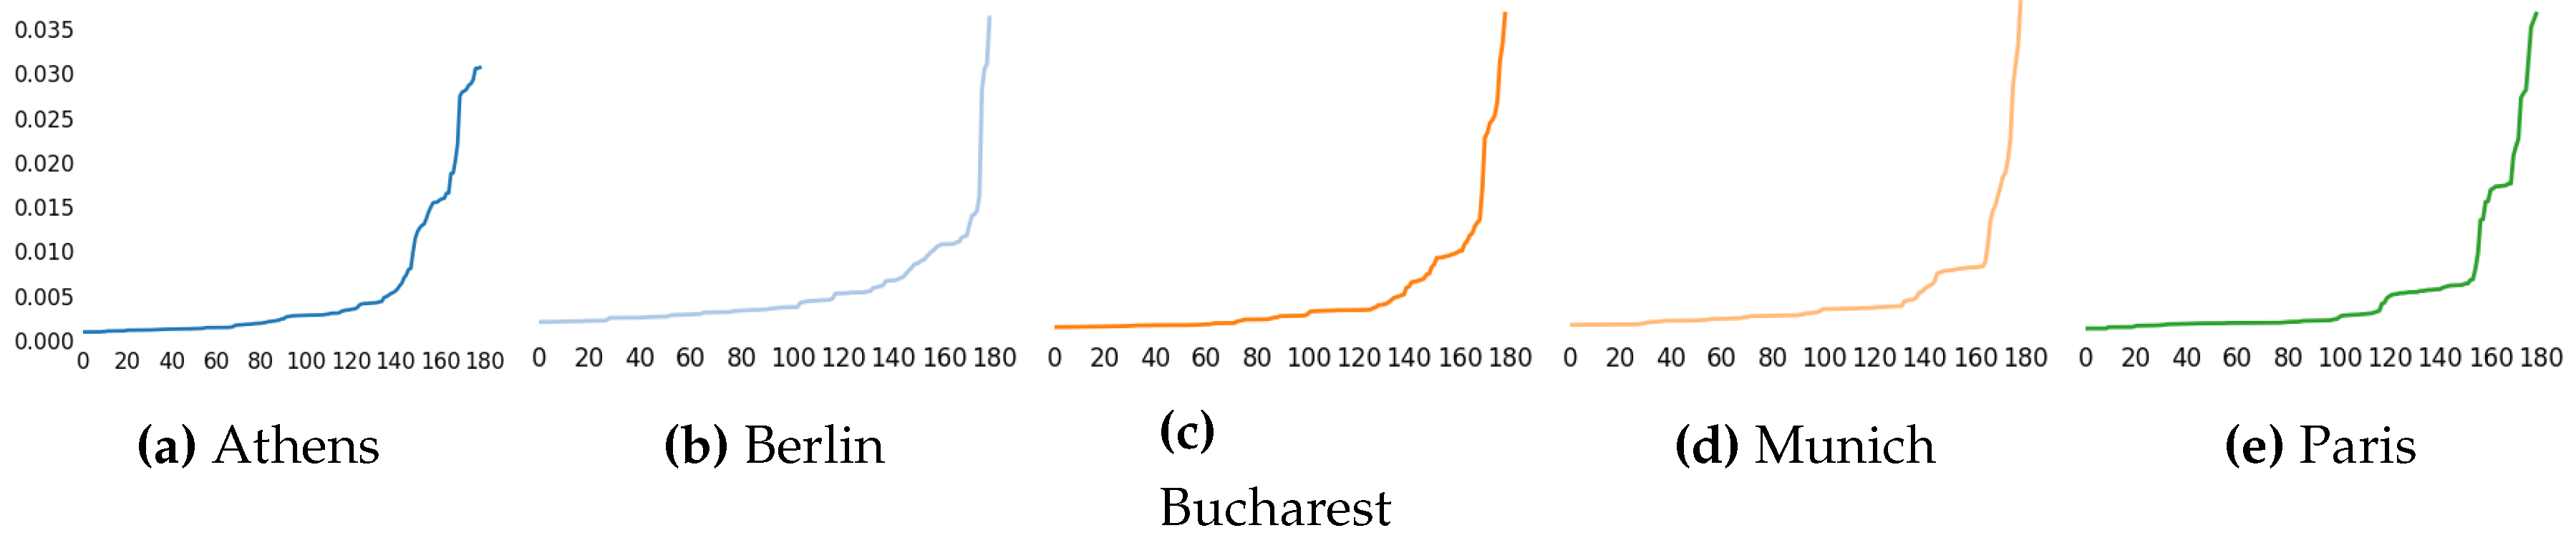
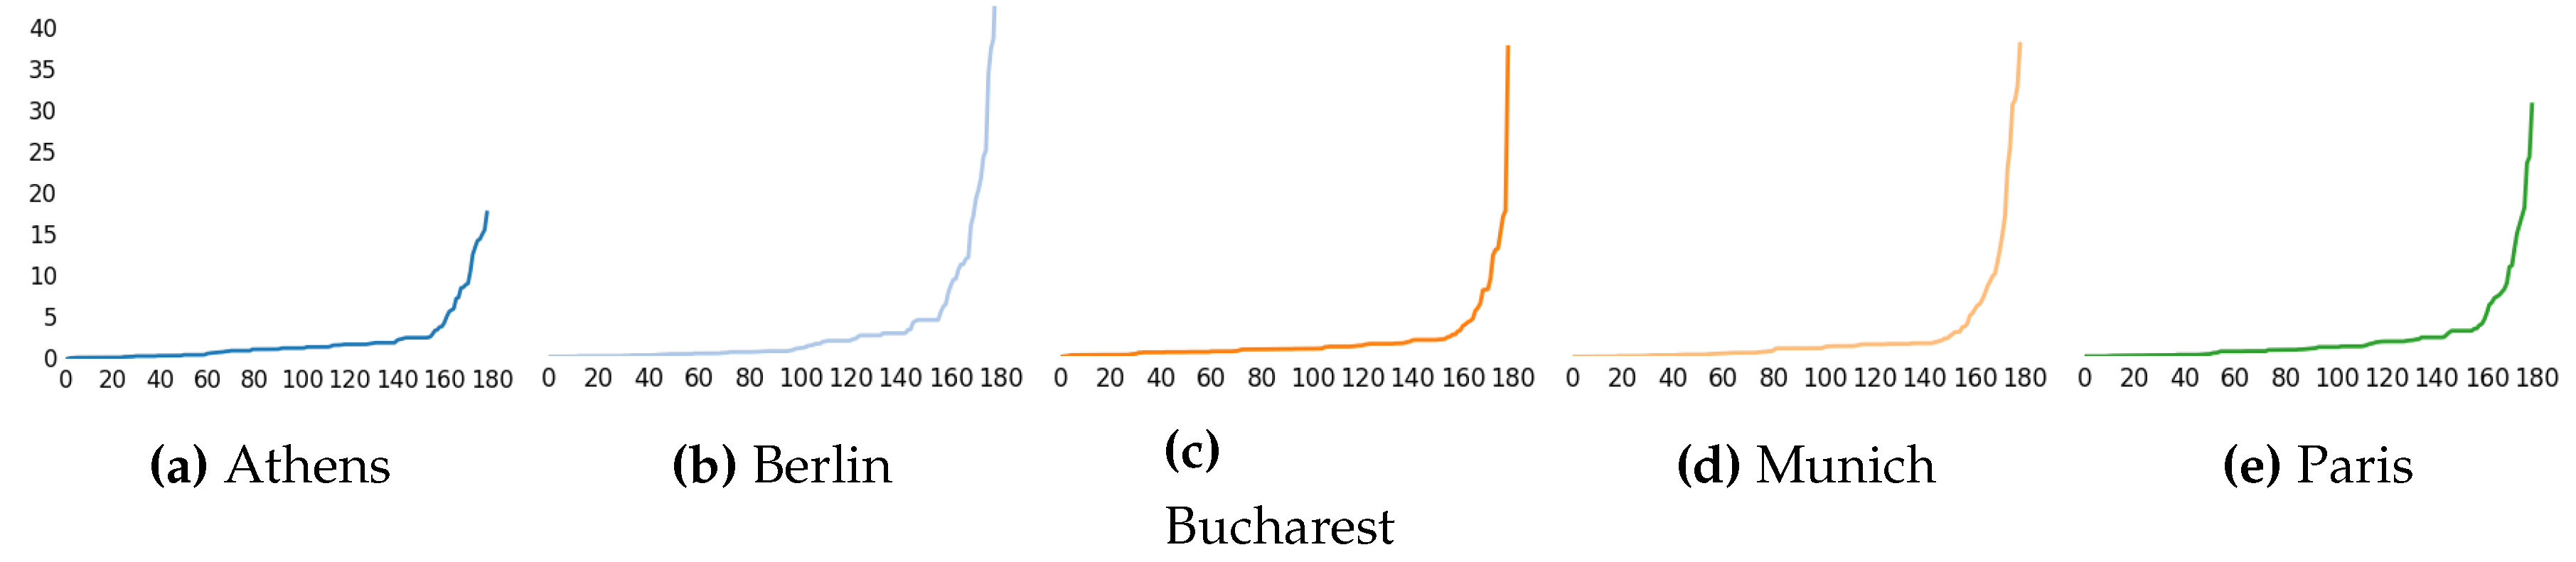
Figure 1. Each method produces different ranking for the features, the graph depicts this ranking sorted from less important to highest importance. The ranking according to wrapper methods are shown in
Figure 2 for the Random Forest, and
Figure 3 for SVM based.
The measures have been sorted separately for better visualization, but the index of each feature is not the same along the different plots.
The best features after applying the two-step voting algorithm are:
Band 0: GLCM Dissimilarity, Energy, Homogenity.
Band 1: GLCM Homogenity.
Band 2: GLCM Energy.
Spectral indices: NDWI, SAVI, Index 7, Index 10, Index 14.
5. Conclusion
As a first step towards a global urban classifier based on Landsat data, we investigated 178 different features to select a feature set which guarantees good performance locally, and provide good generalization capacity, so it can be used in other areas. Using different feature selection methods, the best features for each city were chosen in a two-step voting process. The chosen features are not the same for all cities, which emphasizes the difficulty of selecting features for a global conventional classifier.
