Abstract
This study was carried out for Siberia using Terra/Modis satellite data (2002–2016), data of ground surveys on burned areas of different ages, long-term meteorological information, and numerical simulation results. On the basis of meteorological and wildfire databases, we evaluated the probability (~18%) of an extreme fire danger scenario that was found to occur every 8 ± 3 years in different parts of the region. Next, we used Fire Radiative Power (FRP) measurements to classify the varieties of burning conditions for each wildfire in the database. The classification of the annually burned forest area was obtained in accordance with the assessments of burning intensity ranges categorized by FRP. Depending on the fire danger scenario in Siberia, 47.04 ± 13.6% of the total wildfire areas were classified as low-intensity burning, 42.46 ± 10.50% as medium-intensity fire areas, and 10.50 ± 6.90% as high-intensity. Next, we calculated the amount of combusted biomass and the direct emissions for each wildfire, taking into account the variable intensity of burning within the fire polygons. The total annual emissions were also calculated for Siberia for the last 15 years, from 2002 to 2016. The average estimate of direct carbon emission was 83 ± 21 Tg/year, which is lower than the result (112 ± 25 Tg/year) we obtained using the standard procedure.
1. Introduction
According to long-term satellite observations, there is a significant trend of increase in the number of wildfires and in the extent of burnt area in Siberian forests [1]. Wildfires in the boreal forests of Siberia are responsible for 70–90% of annual burnt area in Russia. Direct wildfire carbon emissions in Siberia are currently 120–140 Tg/year [2,3], and this value can double up to 240 Tg/year, according to forecasts for the second half of the 21st century [4]. Currently, the problem of quantitative estimates of fire emissions is not completely solved. A number of studies discuss both the available emission estimates [3,5,6,7,8] and the factors that influence the accuracy of such numerical simulations [2,9,10,11]. The main problem of such estimates is the consideration of the variations in the combustion parameters that occur even within the same fire polygon. To solve it, a remote sensing approach for wildfire’s energy estimate [12,13,14] could be used.
The aim of this study was to implement available satellite data on wildfires in Siberia and Fire Radiative Power (FRP) measurements [12] to quantitative estimate direct wildfire emissions. It was proposed to classify the burned areas according to the energy released and the intensity of the wildfires.
In this regard, the following aspects of the problem were considered: (1) analysis of the fire characteristics in relation to fire development scenarios; (2) classification of burned areas according to the estimation of the fire intensity; (3) estimation of combusted forest fuels and direct fire emissions and accuracy analysis.
2. Experiments
2.1. Study Area
The territory of Siberia covers 1000 MHa with a forested area of about 600 MHa. Forests dominated by larch (Larix sibirica, Larix gmelinii) range over an area of 270–300 MHa; an area of Scots pine (Pinus sylvestris) stands extends over 120 MHa, dark coniferous stands occupy 100 MHa, and mixed forest covers about 77 MHa. We considered all forest fires detected in Siberia (50°–67° N and 60°–150° E) from 2002 to 2016 (Figure 1a). The data on forest types was derived from reference [15].
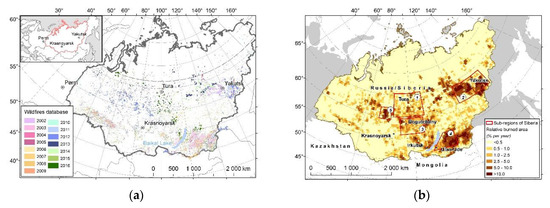
Figure 1.
Study area: (a) Spatial distribution of wildfires in Siberia in 2002–2016. Wildfires in areas >1500 Ha are shown on the map; (b) Relative burned area (% per year). Sub-regions of Siberia: (1) Central Siberian flat taiga region; (2) Eastern Siberian taiga–permafrost region; (3) Angara river forest region; (4) mountain and permafrost forest region of Transbaikal; (5) Central Siberian plain–taiga region.
2.2. Data
Air temperature and precipitation data for the whole Siberia were taken from the Climatic Research Unit (http://www.cru.uea.ac.uk), the Weather Archive (http://rp5.ru), and the National Climatic Data Center (NCDC Climate Data) (http://www7.ncdc.noaa.gov/CDO/cdo).
Active fire products of Modis data for fire detection (MOD14/MYD14) with estimates of fire radiative power (FRP) [16,17] were acquired from the Level-1 and Atmosphere Archive & Distribution System (LAADS) Distributed Active Archive Center (DAAC) website (https://ladsweb.modaps.eosdis.nasa.gov/). We used also our own wildfires data collected using Terra/Modis in the V.N. Sukachev Institute of Forest (Krasnoyarsk, Russia) [18]. In the analyses, we used statistically significant wildfire samples (7394 fires).
2.3. Methods
Firstly, we analyzed fire danger seasonal statistics for different sub-regions of Siberia for the last N = 30 years, using meteorological daily data on temperature, precipitation, dew point temperature along with the data on relative burned area (RBA, %) per forested area per year. The probability of extreme fire danger scenario P{E} (according to weather conditions and wildfire numbers) was estimated as P{E} = NE/N, where NE is the number of extreme fire seasons occurred in a local area. The minimum and maximum probabilities for sub-regions (Figure 1b) are summarized in the Table 1.

Table 1.
Fire danger scenario statistics for Siberia. P{E}: probability of extreme fire danger scenario, RBA: relative burned area.
Next, we classified the fire pixels into three categories of FRP using thresholds calculated on the basis of the statistical parameter of fire radiative power distribution. All fire pixels were separated into three categories: category I corresponded to the low FRP fires (FRP < FRPmean − σ), category II to medium FRP fires (FRPmean − σ < FRP < FRPmean + σ), and category III to high FRP fires (FRP > FRPmean + σ), where FRPmean and σ are FRP mean value and standard deviation, respectively. According to these categories, we distinguished areas of fires corresponding to low, medium, and high FRP. As it was shown in reference [19], the biomass combustion rate is linearly related to FRP. So, a refinement of the combusted biomass and direct emissions estimates was performed by accounting for variations in the combustion characteristics within each fire polygon. The combusted biomass and carbon emissions were calculated as [20]:
where M is the combusted biomass (kg), С is the carbon emissions (g), A is the burned area (m2), β is the combustion completeness, B is the pre-fire fuel load (kg/m2), CE is the emission factor (g/kg).
M = A × β × B,
C = A × β × B × CE
The pre-fire fuel loads (B = 1.38–5.4 kg/m2) for the sub-regions of Siberia were summarized from published data [21,22]. At the stage of numerical modeling, we used generalized data on on-ground fuels in forests with prevalence of larch, pine, dark coniferous, and deciduous stands as the input parameter. The non-stationary model of surface fire was simulated using the author’s software “SigmaFire” [23].
In Equations (1) and (2), the parameter A(m2) was represented as the sum of the areas having various FRP values:
For each area Ai(FRPi), an estimate of combusted forest fuels was made using Equation (1), taking into account the variable values of combustion completeness β. The value of β for each area was determined according to the FRP category and based on the model values β = βi(FRPi) = 0.35–0.60 [11,19].
We compared our results with the estimates obtained using the original approach (1):
where ∆Mrel is the relative difference, M is the amount of combusted fuels calculated using approach (1), Md is the amount of combusted fuels calculated using burned area separation, considering Equation (3).
∆Mrel = 100 × (M − Md)/M,
Finally, we estimated direct carbon emissions (C) and relative difference according to Equation (4).
3. Results and Discussion
3.1. Fire Danger Scenarios and Relative Burned Area
The proportion of forested area burned with low, medium, or high FRP strongly depended on the fire danger scenario. Firstly, we obtained the spatial distribution of the relative burned area for Siberia by summarizing data on total burned areas in the last two decades (Figure 1b). The characteristics of the fire season scenarios were also evaluated (Table 1). The annual relative burned area varied from 0.3% to more than 10% of the total forested area. The average for Siberia was 1.5%, which was three times greater than the average annual burned area (0.56%) in western Canada [22,24].
3.2. FRP Data and Ratio of Burned Areas
Most of the Modis fire pixels (up to 88% of the total) had FRP values below 50 MW/km2. The mean FRP value at the 95% confidence level was 37.4 MW/km2 (σ = 17.1 MW/km2). Two threshold values were defined to separate fire pixels by FRP categories: 20.3 MW/km2 and 54.5 MW/km2. On the basis of the FRP categories, we classified the fire polygons into areas of low, medium, and high intensity of burning (Table 2).
Table 2.
Forest areas burned by fires of various intensities in 2002–2016.
An instrumental-based estimation of the areas burned by fires of various intensities in Siberia was performed for the first time. In previous studies, empirically obtained data indicated that the burned areas corresponded to 22%, 38.5%, and 38.5% for low-, medium-, and high-intensity fires, respectively [2]. Previously, we estimated (Ponomarev et al., 2017) [25] that the area burned by high-intensity and crown fires was 8.5% of the total burned forested area in Siberia. Similar assessments made using satellite data were presented in reference [26], providing estimates of burned areas in larch forests (up to 50% of the total), dark coniferous (about 5%), light coniferous, and deciduous (18% and 19%, respectively), which is consistent with other studies [2,22].
3.3. Assessment of Combusted Biomass and Direct Carbon Emissions
Our field measurements indicated 0.7–1.3 kg/m2 of ground layer fuel in post-fire plots of larch and pine tree stands in the Central Siberian flat taiga region. We considered also various empirical estimates of forest fuels combusted during wildfires of various intensities: 0.11–0.97 kg/m2, 0.86–2.15 kg/m2, and 2.25–5.36 kg/m2, respectively, for low-, medium-, and high-intensity fires [2,5,27]. The coefficient of combustion completeness varied [11,21] depending on the FRP category. The coefficient β was 0.35–0.40 for low FRP, 0.40–0.45 for medium FRP, and 0.45–0.55 for high FRP.
The calculated estimate (Table 3) of direct carbon emissions from Siberian fires was 83 ± 21 Tg/year, which is lower than the result (112 ± 25 Tg/year) we obtained using Equations (1) and (2). Between 2002 and 2016, direct fire emissions varied from the minimum values of 20–40 Tg/year (low fire danger scenarios of 2004, 2005, 2007, 2009, 2010) to a maximum value of 227 Tg/year in the extreme fire danger season of 2012. Taking into account the confidence interval, this corresponds to the range of values reported in publications for different scenarios of fire activity in Siberia [2,3,7,11].
Table 3.
Mean long-term values of biomass combusted (M) and direct carbon emissions (C) calculated using Equations (1) and (2) and the described approach considering Equation (3).
4. Conclusions
We performed a classification of fire areas, taking into account the combustion intensity according to the FRP range. It was quantitatively established that in Siberia low-intensity fires were responsible for 47.04 ± 13.6% of the total annual burned area, medium-intensity fires for 42.46 ± 10.50%, and high-intensity fires for 10.50 ± 6.90%. The mean annual direct fire emissions in Siberia between 2002 and 2016 were estimated as 83 ± 21 Tg/year, which is lower than the result (112 ± 25 Tg/year) we obtained using the standard method. The result of the calculation strongly depended on the fire danger scenario of the season, as well as on the relative burned area (0.01–14.5%). The direct emissions varied from 20 Tg/year in low fire danger scenario seasons up to 227 Tg/year in the extreme fire danger season of 2012.
Author Contributions
E.P. suggested the idea of the study; E.S., O.P., N.Y. processed the satellite database on wildfires; T.P., I.B., A.K., A.P. performed the field experiments; K.L., E.P. contributed numeric simulation materials and analysis tools; T.P., E.S. analyzed the meteorological data; E.P. wrote the paper. All authors have read and agreed to the published version of the manuscript.
Acknowledgments
This research was supported by the Russian Foundation for Basic Research, the Government of the Krasnoyarsk region, the Krasnoyarsk Regional Science Fund (17-41-240475). The field expeditions in 2016 and 2017 and analysis were partly supported by the Russian Foundation for Basic Research (16-04-0796, 17-04-00589, 18-05-00432). Satellite data pre-processing and wildfire data collection in 2009–2013 were supported by the NASA Land-Cover Land-Use Change (LCLUC) Science Program (08-LCLUC08-2-0003). The equipment used was provided by the Regional Center for Remote Sensing, Federal Research Center “KSC SB RAS” (Krasnoyarsk, Russia).
Conflicts of Interest
The authors declare no conflict of interest.
Abbreviations
The following abbreviations are used in this manuscript:
| FRP | Fire Radiative Power |
| RBA | Relative Burned Area |
References
- Ponomarev, E.I.; Kharuk, V.I. Wildfire Occurrence in Forests of the Altai–Sayan Region under Current Climate Changes. Contemp. Probl. Ecol. 2016, 9, 29–36. [Google Scholar] [CrossRef]
- Soja, A.J.; Cofer, W.R.; Shugart, H.H.; Sukhinin, A.I.; Stackhouse, P.W., Jr.; McRae, D.J.; Conard, S.G. Estimating fire emissions and disparities in boreal Siberia (1998–2002). J. Geophys. Res. 2004, 109, D14S06. [Google Scholar] [CrossRef]
- Shvidenko, A.Z.; Shchepashchenko, D.G.; Vaganov, E.A.; Sukhinin, A.I.; Maksyutov, S.; McCallum, I.; Lakyda, I.P. Impact of wildfire in Russia between 1998–2010 on ecosystems and the global carbon budget. Dokl. Earth Sci. 2011, 441, 1678–1682. [Google Scholar] [CrossRef]
- Zamolodchikov, D.G.; Grabovskii, V.I.; Kraev, G.N. Dynamics of Carbon Budget in Forests of Russia for Last Twenty Years. Forestry 2011, 6, 16–28. (In Russian) [Google Scholar]
- Conard, S.G.; Sukhinin, A.I.; Stocks, B.J.; Cahoon, D.R.; Davidenko, E.P.; Ivanova, G.A. Determining effects of area burned and fire severity on carbon cycling and emissions in Siberia. Clim. Chang. 2002, 55, 197–211. [Google Scholar] [CrossRef]
- Ivanova, G.A.; Ivanov, V.A.; Kukavskaya, Е.А.; Conard, S.G.; McRae, D.J. Effect of Fires on Carbon Emission in the Pine Forests of Middle Siberia. Sib. J. Ecol. 2007, 14, 885–895. (In Russian) [Google Scholar]
- Bondur, V.G.; Gordo, K.A.; Kladov, V.L. Spatial and Temporal Distributions of Wildfire Areas and Carbon-Bearing Gas and Aerosol Emissions in North Eurasia Based on Satellite Monitoring Data. Issledovanie Zemli iz Kosmosa (Remote Sens.) 2016, 6, 3–20. (In Russian) [Google Scholar] [CrossRef]
- Baldocchi, D.; Chu, H.; Reichstein, M. Inter-annual variability of net and gross ecosystem carbon fluxes: A review. Agric. For. Meteorol. 2017, 1–14. [Google Scholar] [CrossRef]
- McRae, D.J.; Conard, S.G.; Ivanova, G.A.; Sukhinin, A.I.; Baker, S.P.; Samsonov, Y.N.; Blake, T.W.; Ivanov, V.A.; Ivanov, A.V.; Churkina, T.V.; et al. Variability of Fire Behavior, Fire Effects and Emissions in Scotch Pine Forests of Central Siberia. Mitig. Adapt. Strateg. Glob. Chang. 2006, 11, 45–74. [Google Scholar] [CrossRef]
- Kukavskaya, E.; Soja, A.; Petkov, A.; Ponomarev, E.; Ivanova, G.; Conard, S. Fire Emissions Estimates in Siberia: Evaluation of Uncertainties in Area Burned, Land Cover, and Fuel Consumption. Сan. J. For. Res. 2013, 43, 493–506. [Google Scholar] [CrossRef]
- Glagolev, M.V.; Sabrekov, A.F. Reply to А.V. Smagin: II. Carbon balance in Russia. Dyn. Environ. Glob. Clim. Chang. 2014, 5, 50–69. (In Russian) [Google Scholar]
- Ichoku, C.; Kaufman, Y.J. A method to derive smoke emission rates from MODIS fire radiative energy measurements. IEEE Trans. Geosci. Remote Sens. 2005, 43, 2636–2649. [Google Scholar] [CrossRef]
- Vermote, E.; Ellicott, E.; Dubovik, O.; Lapyonok, T.; Chin, M.; Giglio, L.; Roberts, G.J. An approach to estimate global biomass burning emissions of organic and black carbon from MODIS fire radiative power. J. Geophys. Res. 2009, 114, 1–22. [Google Scholar] [CrossRef]
- Safronov, A.N.; Fokeeva, E.V.; Rakitin, V.S.; Grechko, E.I.; Shumsky, R.A. Severe Wildfires Near Moscow, Russia in 2010: Modeling of Carbon Monoxide Pollution and Comparisons with Observations. Remote Sens. 2015, 7, 395–429. [Google Scholar] [CrossRef]
- Bartalev, S.A.; Egorov, V.A.; Ershov, D.V.; Isaev, A.S.; Loupian, E.A.; Plotnikov, D.E.; Uvarov, I.A. Mapping of Russia’s vegetation cover using MODIS satellite spectroradiometer data. Curr. Probl. Remote Sens. Earth Space 2011, 8, 285–302. (In Russian) [Google Scholar]
- Justice, C.O.; Giglio, L.; Korontzi, S.; Owens, J.; Morisette, J.T.; Roy, D.; Descloitres, J.; Alleaume, S.; Petitcolin, F.; Kaufman, Y. The MODIS fire products. Remote Sens. Environ. 2002, 83, 244–262. [Google Scholar] [CrossRef]
- Giglio, L. MODIS Collection 5 Active Fire Product User’s Guide, Version 2.5; Dep. of Geogr. Univ. of Maryland: College Park, MD, USA, 2013; p. 61. [Google Scholar]
- Ponomarev, E.I.; Shvetsov, E.G. Satellite detection of forest fires and geoinformation methods for calibrating of the result. Issledovanie Zemli iz Kosmosa (Remote Sens.) 2015, 1, 84–91. (In Russian) [Google Scholar] [CrossRef]
- Wooster, M.J.; Roberts, G.; Perry, G.L.W.; Kaufman, Y.J. Retrieval of biomass combustion rates and totals from fire radiative power observations: FRP derivation and calibration relationships between biomass consumption and fire radiative energy release. J. Geophys. Res. 2005, 110, D24311. [Google Scholar] [CrossRef]
- Seiler, W.; Crutzen, P.J. Estimates of gross and net fluxes of carbon between the biosphere and atmosphere from biomass burning. Clim. Chang. 1980, 2, 207–247. [Google Scholar] [CrossRef]
- Tsvetkov, P.A. Adaptation of Larix gmelinii to Fires in the Northern Taiga of Central Siberia. Sib. J. Ecol. 2005, 1, 117–129. (In Russian) [Google Scholar]
- de Groot, W.J.; Cantin, A.S.; Flannigan, M.D.; Soja, A.J.; Gowman, L.M.; Newbery, A. A comparison of Canadian and Russian boreal forest fire regimes. For. Ecol. Manag. 2013, 294, 23–34. [Google Scholar] [CrossRef]
- Litvintsev, K.Y.; Amelchugov, S.P.; Gavrilov, A.A.; Dekterev, A.A.; Negin, V.A.; Kharlamov, E.B.; Software for Numerical Simulation of Fire Dynamics (σFire); Certificate No. 2010613073; 2010. Available online: http://3ksigma.ru/wp-content/uploads/2017/10/Manual_SigmaPB_v4.pdf (accessed on 22 February 2018).
- Ponomarev, E.I.; Kharuk, V.I.; Ranson, J.K. Wildfires Dynamics in Siberian Larch Forests. Forests 2016, 7, 125. [Google Scholar] [CrossRef]
- Ponomarev, E.I.; Shvetsov, E.G.; Usataya, Y.O. Registration of Wildfire Energy Characteristics in Siberian Forests Using Remote Sensing. Issledovanie Zemli iz Kosmosa (Remote Sens.) 2017, 4, 3–11. (In Russian) [Google Scholar] [CrossRef]
- Bartalev, S.A.; Stytsenko, F.V.; Egorov, V.A.; Loupian, E.A. Satellite assessment of fire-caused forest mortality in Russia. Forestry (Lesovedenie) 2015, 2, 83–94. (In Russian) [Google Scholar]
- Kasischke, E.S.; Bruhwiler, L.P. Emissions of carbon dioxide, carbon monoxide, and methane from boreal forest fires in 1998. J. Geophys. Res. 2003, 108, 8146. [Google Scholar] [CrossRef]
Publisher’s Note: MDPI stays neutral with regard to jurisdictional claims in published maps and institutional affiliations. |
© 2018 by the authors. Licensee MDPI, Basel, Switzerland. This article is an open access article distributed under the terms and conditions of the Creative Commons Attribution (CC BY) license (https://creativecommons.org/licenses/by/4.0/).