Spatial Variability of Daily Evapotranspiration in a Mountainous Watershed by Coupling Surface Energy Balance and Solar Radiation Model with Gridded Weather Dataset †

Abstract
:1. Introduction
2. Experiments
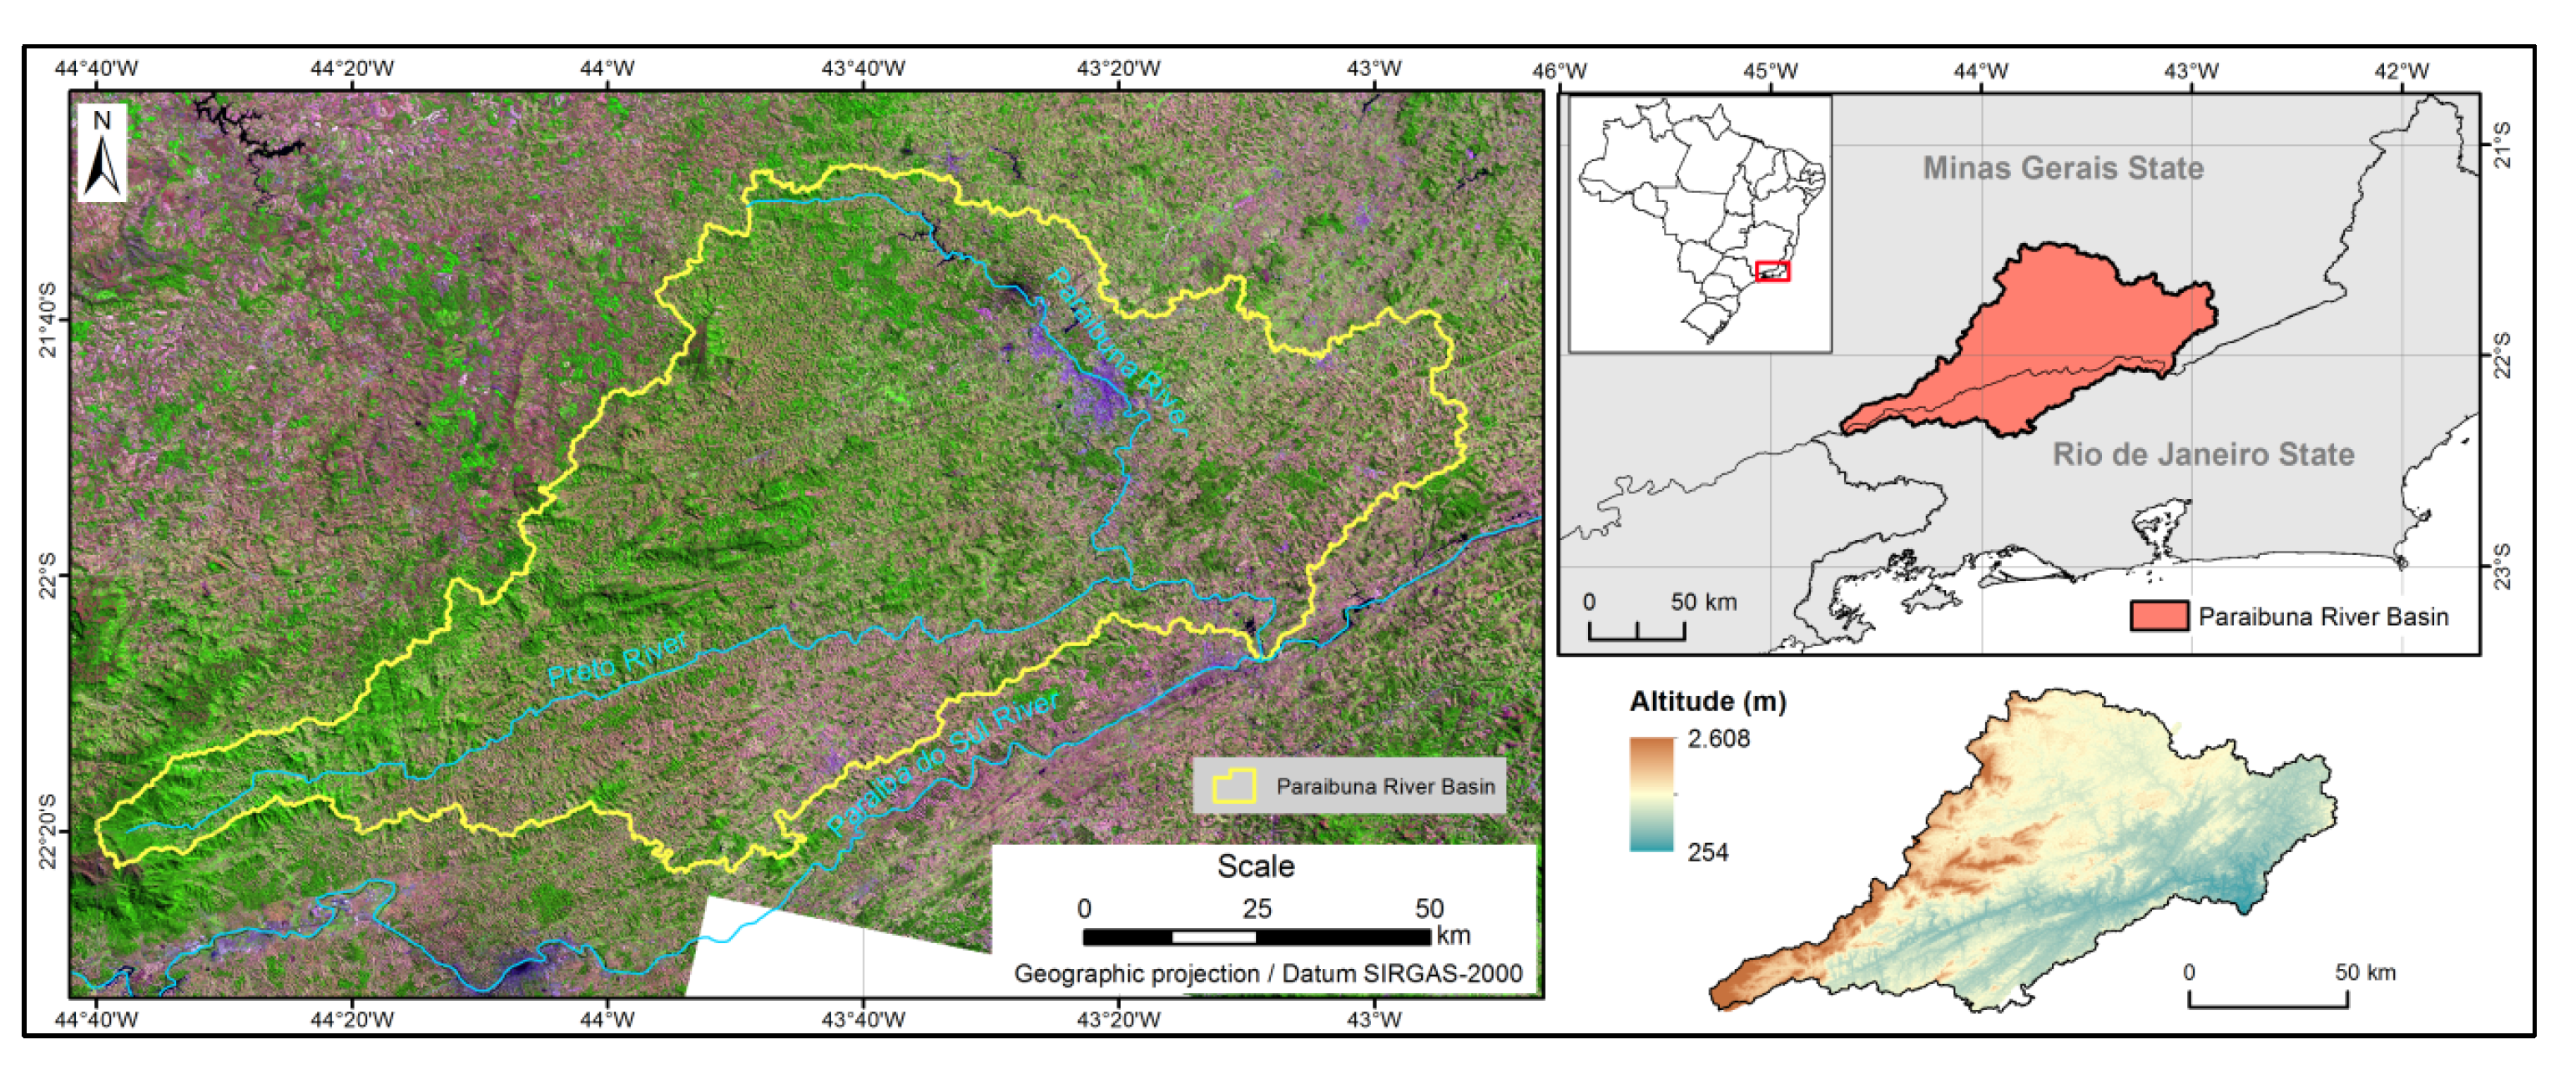
2.1. Study Area
2.2. Materials and Methods
2.2.1. Datasets
2.2.2. GLDAS Data Preparation
2.2.3. Solar Radiation Model
2.2.4. SEBAL Model Adaptations for Tilted Surfaces
3. Results
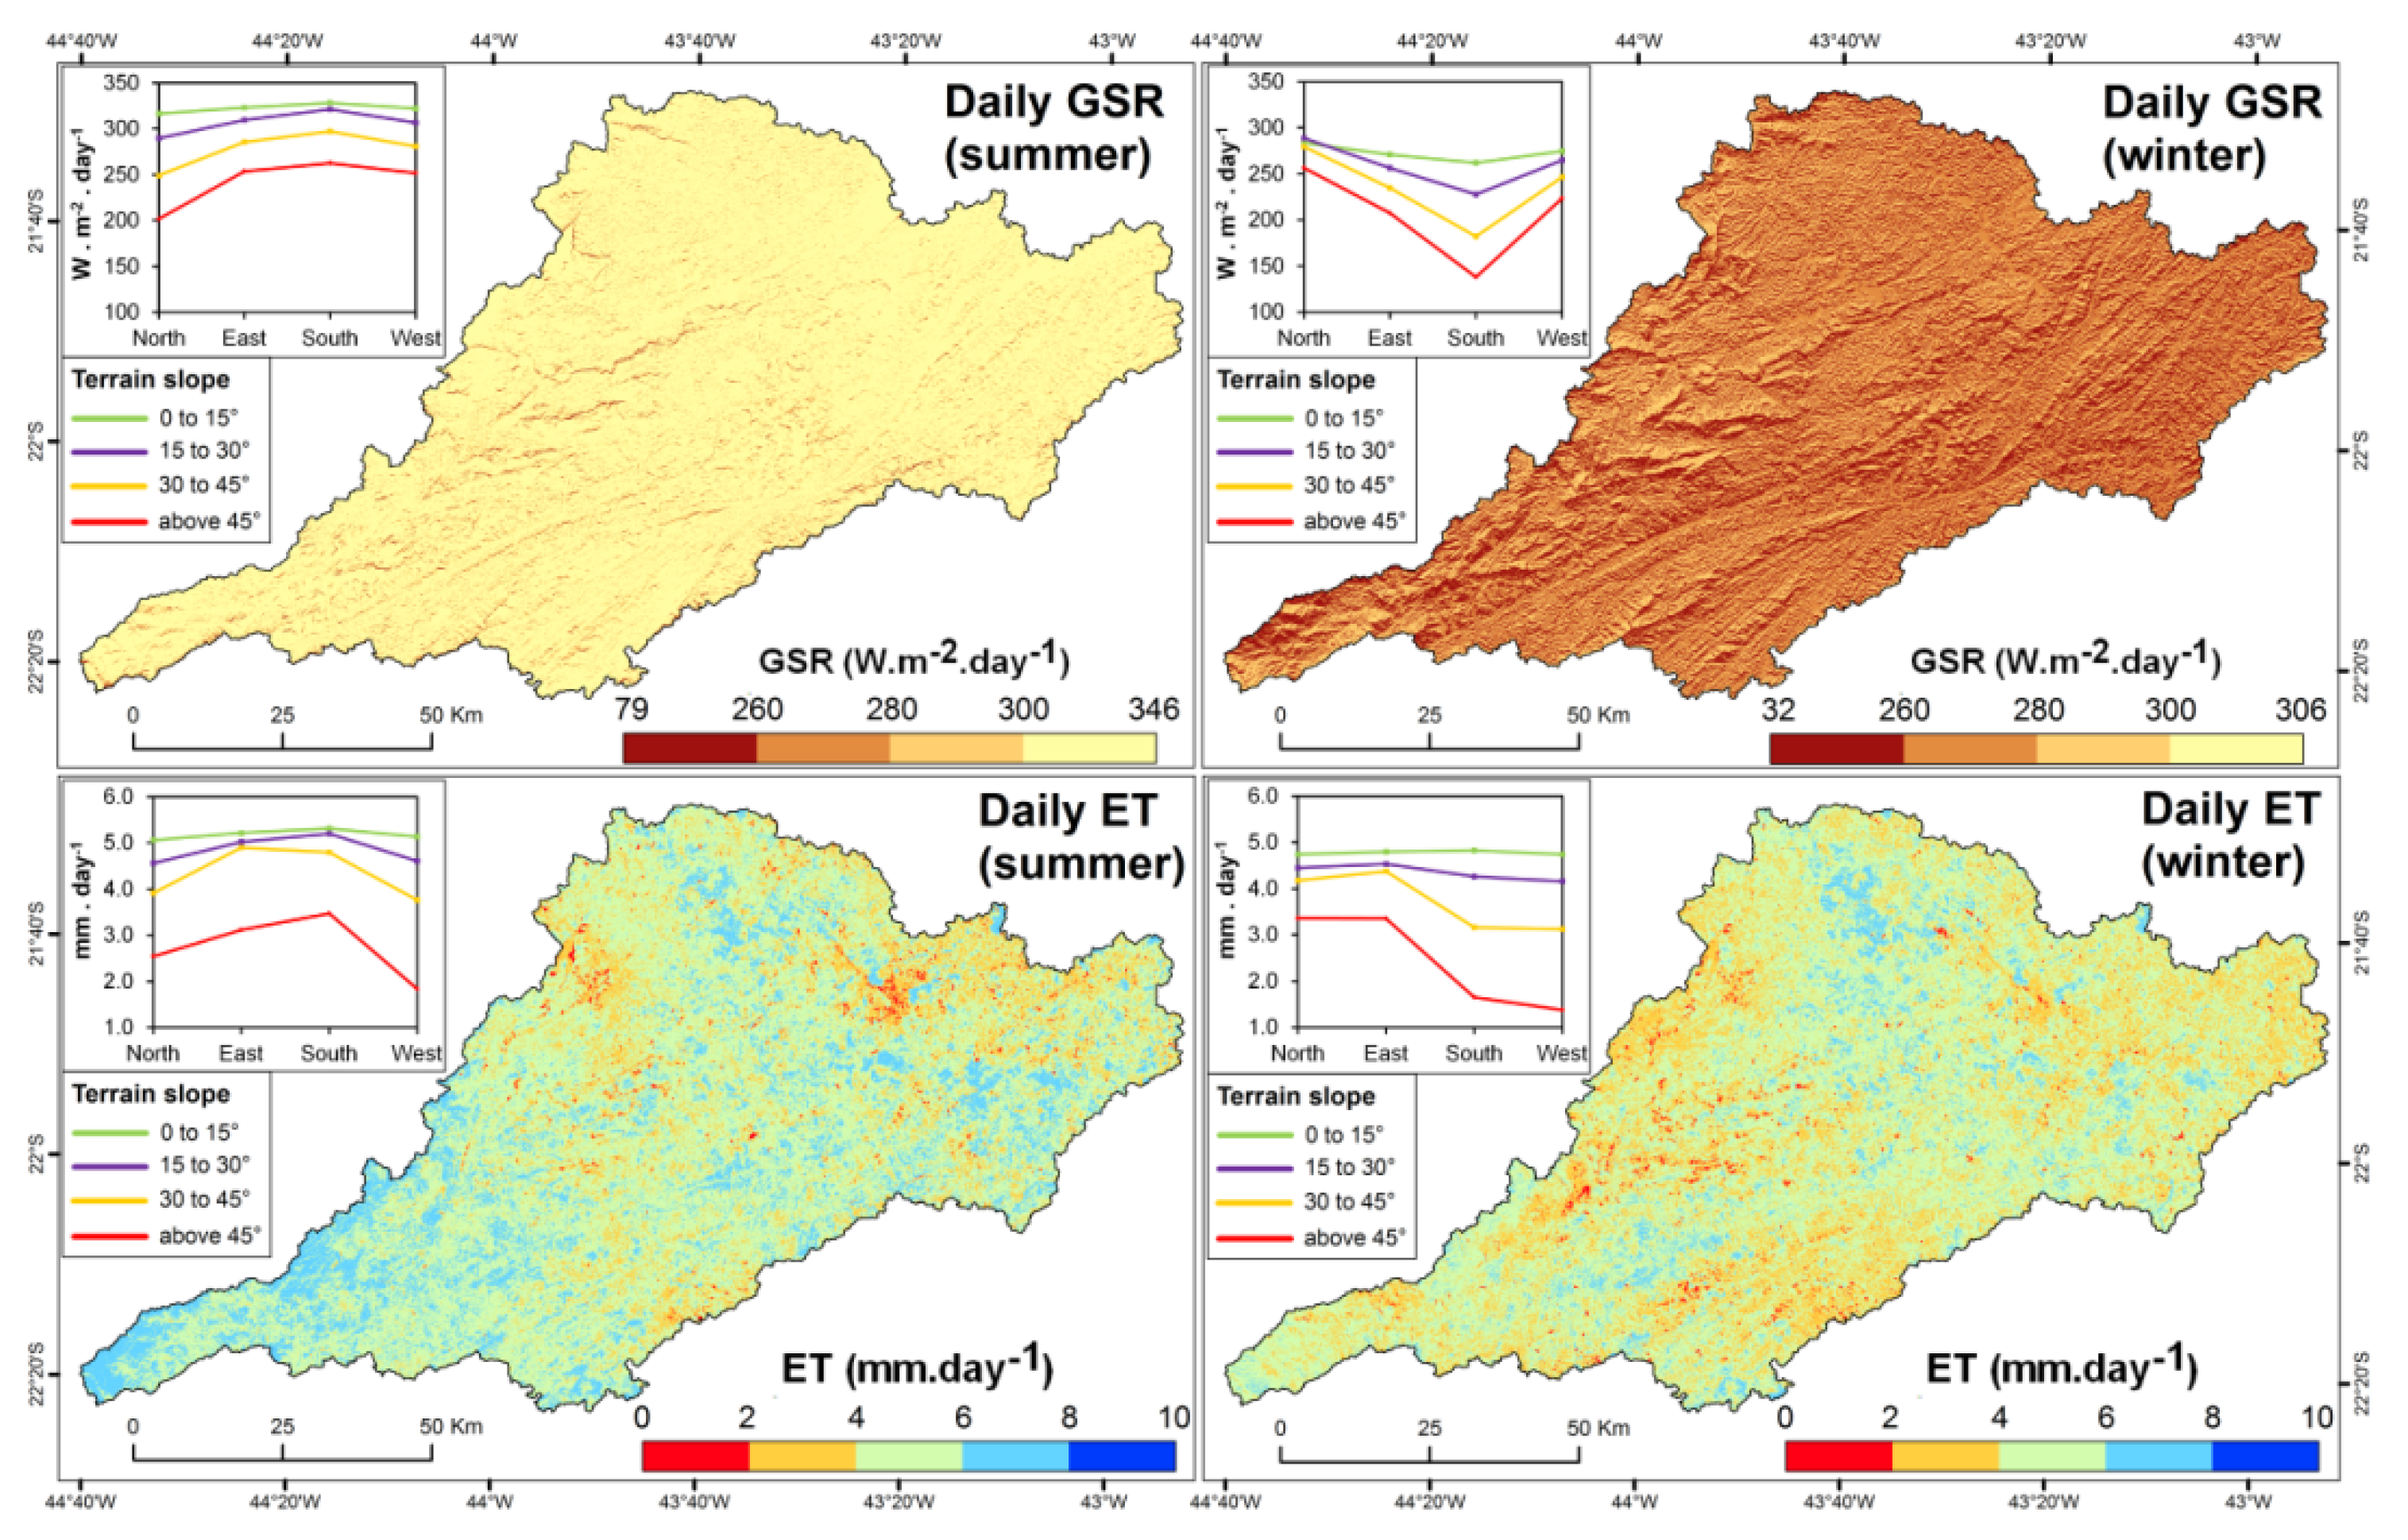
3.1. Spatial Distribution of GSRT 24 and ET24 over the Terrain Angles
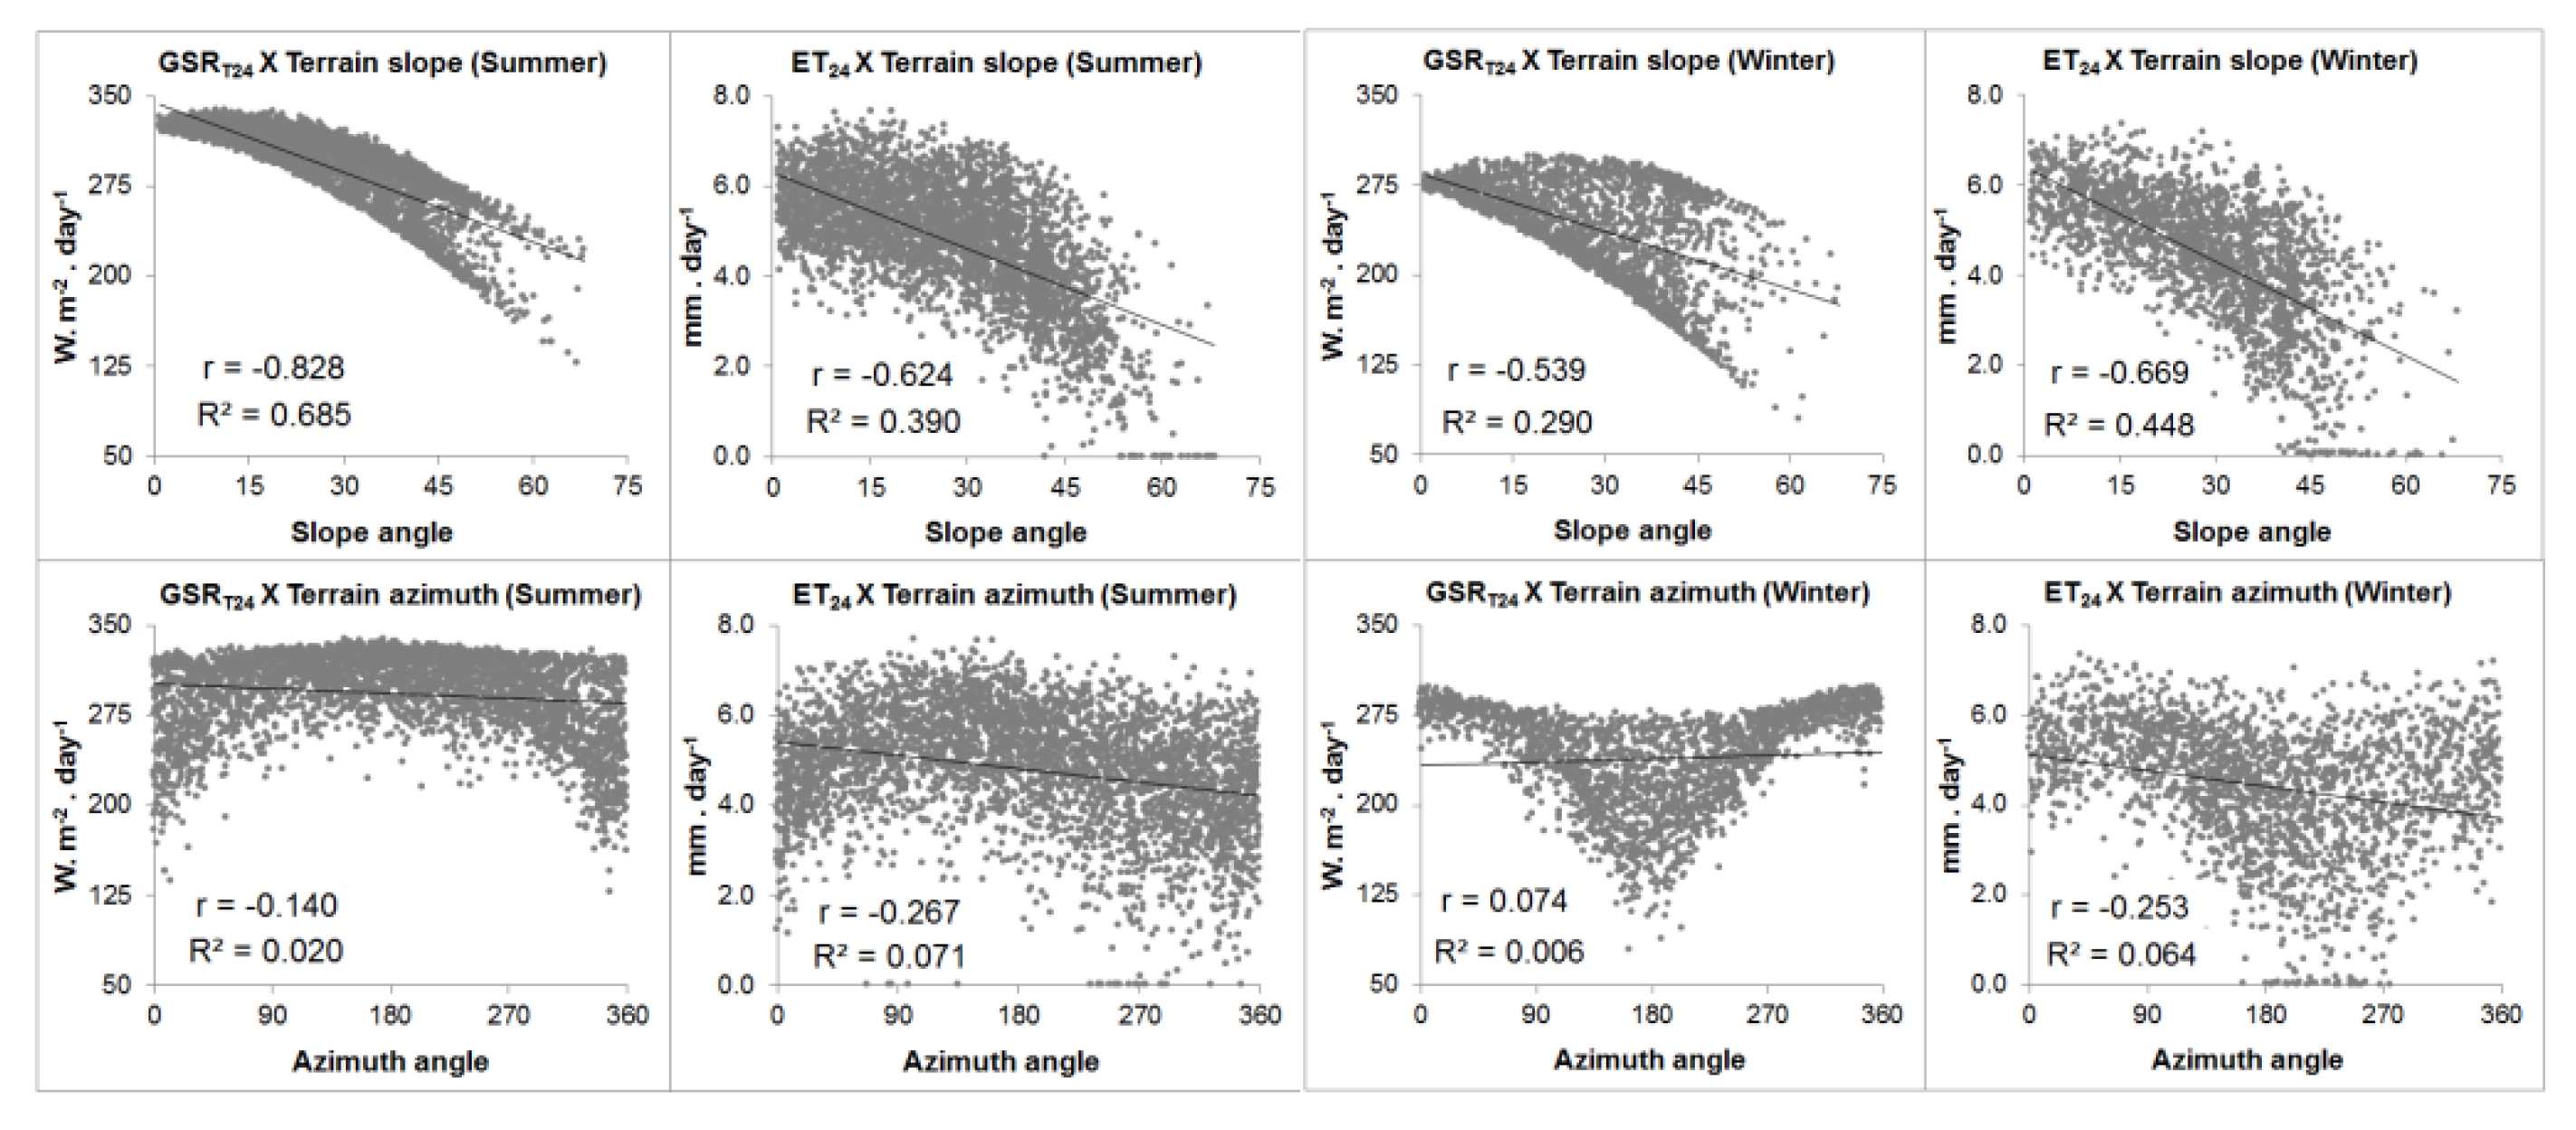
3.2. Statistical Relations between Terrain Angles, GSRT 24, and ET24
4. Discussion
5. Conclusions
Conflicts of Interest
References
- Gao, Y.C.; Long, D.; Li, Z.L. Estimation of daily actual evapotranspiration from remotely sensed data under complex terrain over the upper Chao river basin in North China. Int. J. Remote Sens. 2008, 29, 3295–3315. [Google Scholar] [CrossRef]
- Aguilar, C.; Herrero, J.; Polo, M.J. Topographic effects on solar radiation distribution in mountainous watersheds and their influence on reference evapotranspiration estimates at watershed scale. Hydrol. Earth Syst. Sci. 2010, 14, 2479–2494. [Google Scholar] [CrossRef]
- Chen, X.; Su, Z.; Ma, Y.; Yang, K.; Wang, B. Estimation of surface energy fluxes under complex terrain of Mt. Qomolangma over the Tibetan Plateau. Hydrol. Earth Syst. Sci. 2013, 17, 1607–1618. [Google Scholar] [CrossRef]
- Elhaddad, A.; Garcia, L.A. ReSET-Raster: Surface Energy Balance Model for Calculating Evapotranspiration Using a Raster Approach. J. Irrig. Drain. Eng. 2011, 137, 203–210. [Google Scholar] [CrossRef]
- NASA. LDAS Land Data Assimilation Systems. Available online: https://ldas.gsfc.nasa.gov/gldas/ (accessed on 12 December 2017).
- MAPBIOMAS. Project MapBiomas—Collection 2 of Brazilian Land Cover & Use Map Series. Available online: http://mapbiomas.org/ (accessed on 12 December 2017).
- Duffie, J.A.; Beckman, W.A. Solar Engineering of Thermal Processes, 4th ed.; John Wiley & Sons: Hoboken, NJ, USA, 2013; 910p. [Google Scholar]
- Wong, L.T.; Chow, W.K. Solar radiation model. Appl. Energy 2001, 69, 191–224. [Google Scholar] [CrossRef]
- Waters, R.; Allen, R.G.; Tasumi, M.; Trezza, R. Surface Energy Balance Algorithms for Land; Idaho Implementation; Advance Training and Users Manual, Version 1.0; Idaho Department of Water Resources: Boise, ID, USA, 2002; p. 98. [Google Scholar]
- Tasumi, M.; Allen, R.G.; Trezza, R. At-surface reflectance and Albedo from satellite for operational calculation of land surface energy balance. J. Hydrol. Eng. 2008, 13, 51–63. [Google Scholar] [CrossRef]
- Soenen, S.A.; Peddle, D.R.; Coburn, C.A. SCS + C: A modified Sun-Canopy Sensor topographic correction in forested terrain. IEEE Trans. Geosci. Remote Sens. 2005, 43, 2148–2159. [Google Scholar] [CrossRef]
- ASCE–EWRI. The ASCE Standardized Reference Evapotranspiration Equation; Report 0-7844-0805-X; ASCE Task Committee on Standardization of Reference Evapotranspiration; American Society of Civil Engineers: Reston, VA, USA, 2005; p. 70. [Google Scholar]


| Variable | Unit | Source | Spatial Res. | Temporal Res. | Provider |
|---|---|---|---|---|---|
| Surface reflectance | - | OLI/Landsat-8 1 | 30 m | 16 days | USGS 5 |
| Thermal radiance | * | TIRS/Landsat-8 2 | 30 m | 16 days | USGS 5 |
| Altitude | m | SRTMGL1 3 | 30 m | - | USGS 5 |
| Temperature | K | GLDAS-2.1 GLDAS-2.1 GLDAS-2.1 GLDAS-2.1 | ~25 km | 3 h | NASA 6 NASA 6 NASA 6 NASA 6 |
| Specific humidity | Kg/Kg | ~25 km | 3 h | ||
| Wind speed | m/s | ~25 km | 3 h | ||
| Pressure | Pa | ~25 km | 3 h | ||
| Land Cover | class | MAPBIOMAS 4 | 30 m | Yearly | MAPBIOMAS 4 |
| Terrain Slope | 0 to 15° | 15 to 30° | 30 to 45° | above 45° | |
|---|---|---|---|---|---|
| Summer | Mean (mm) | 5.18 | 4.85 | 4.35 | 2.74 |
| CV (%) | 2.10 | 6.04 | 12.82 | 24.95 | |
| Winter | Mean (mm) | 4.78 | 4.35 | 3.71 | 2.43 |
| CV (%) | 1.09 | 3.87 | 18.06 | 43.61 | |
| Terrain Azimuth | 315 to 45° (N) | 45 to 135° (E) | 135 to 225° (S) | 225 to 315° (W) | |
|---|---|---|---|---|---|
| Summer | Mean (mm) | 4.31 | 4.85 | 4.94 | 4.24 |
| CV (%) | 17.87 | 12.56 | 11.64 | 23.62 | |
| Winter | Mean (mm) | 4.35 | 4.45 | 3.84 | 3.75 |
| CV (%) | 9.52 | 9.48 | 26.99 | 28.58 | |
Publisher’s Note: MDPI stays neutral with regard to jurisdictional claims in published maps and institutional affiliations. |
© 2018 by the authors. Licensee MDPI, Basel, Switzerland. This article is an open access article distributed under the terms and conditions of the Creative Commons Attribution (CC BY) license (https://creativecommons.org/licenses/by/4.0/).
Share and Cite
Lima, R.N.d.S.; Ribeiro, C.B.d.M. Spatial Variability of Daily Evapotranspiration in a Mountainous Watershed by Coupling Surface Energy Balance and Solar Radiation Model with Gridded Weather Dataset. Proceedings 2018, 2, 342. https://doi.org/10.3390/ecrs-2-05155
Lima RNdS, Ribeiro CBdM. Spatial Variability of Daily Evapotranspiration in a Mountainous Watershed by Coupling Surface Energy Balance and Solar Radiation Model with Gridded Weather Dataset. Proceedings. 2018; 2(7):342. https://doi.org/10.3390/ecrs-2-05155
Chicago/Turabian StyleLima, Ricardo Neves de Souza, and Celso Bandeira de Melo Ribeiro. 2018. "Spatial Variability of Daily Evapotranspiration in a Mountainous Watershed by Coupling Surface Energy Balance and Solar Radiation Model with Gridded Weather Dataset" Proceedings 2, no. 7: 342. https://doi.org/10.3390/ecrs-2-05155
APA StyleLima, R. N. d. S., & Ribeiro, C. B. d. M. (2018). Spatial Variability of Daily Evapotranspiration in a Mountainous Watershed by Coupling Surface Energy Balance and Solar Radiation Model with Gridded Weather Dataset. Proceedings, 2(7), 342. https://doi.org/10.3390/ecrs-2-05155