Evaluation of Geospatial Tools for Generating Accurate Glacier Velocity Maps from Optical Remote Sensing Data †

 ,
,  ,
, 
Abstract
:1. Introduction
2. Experiments
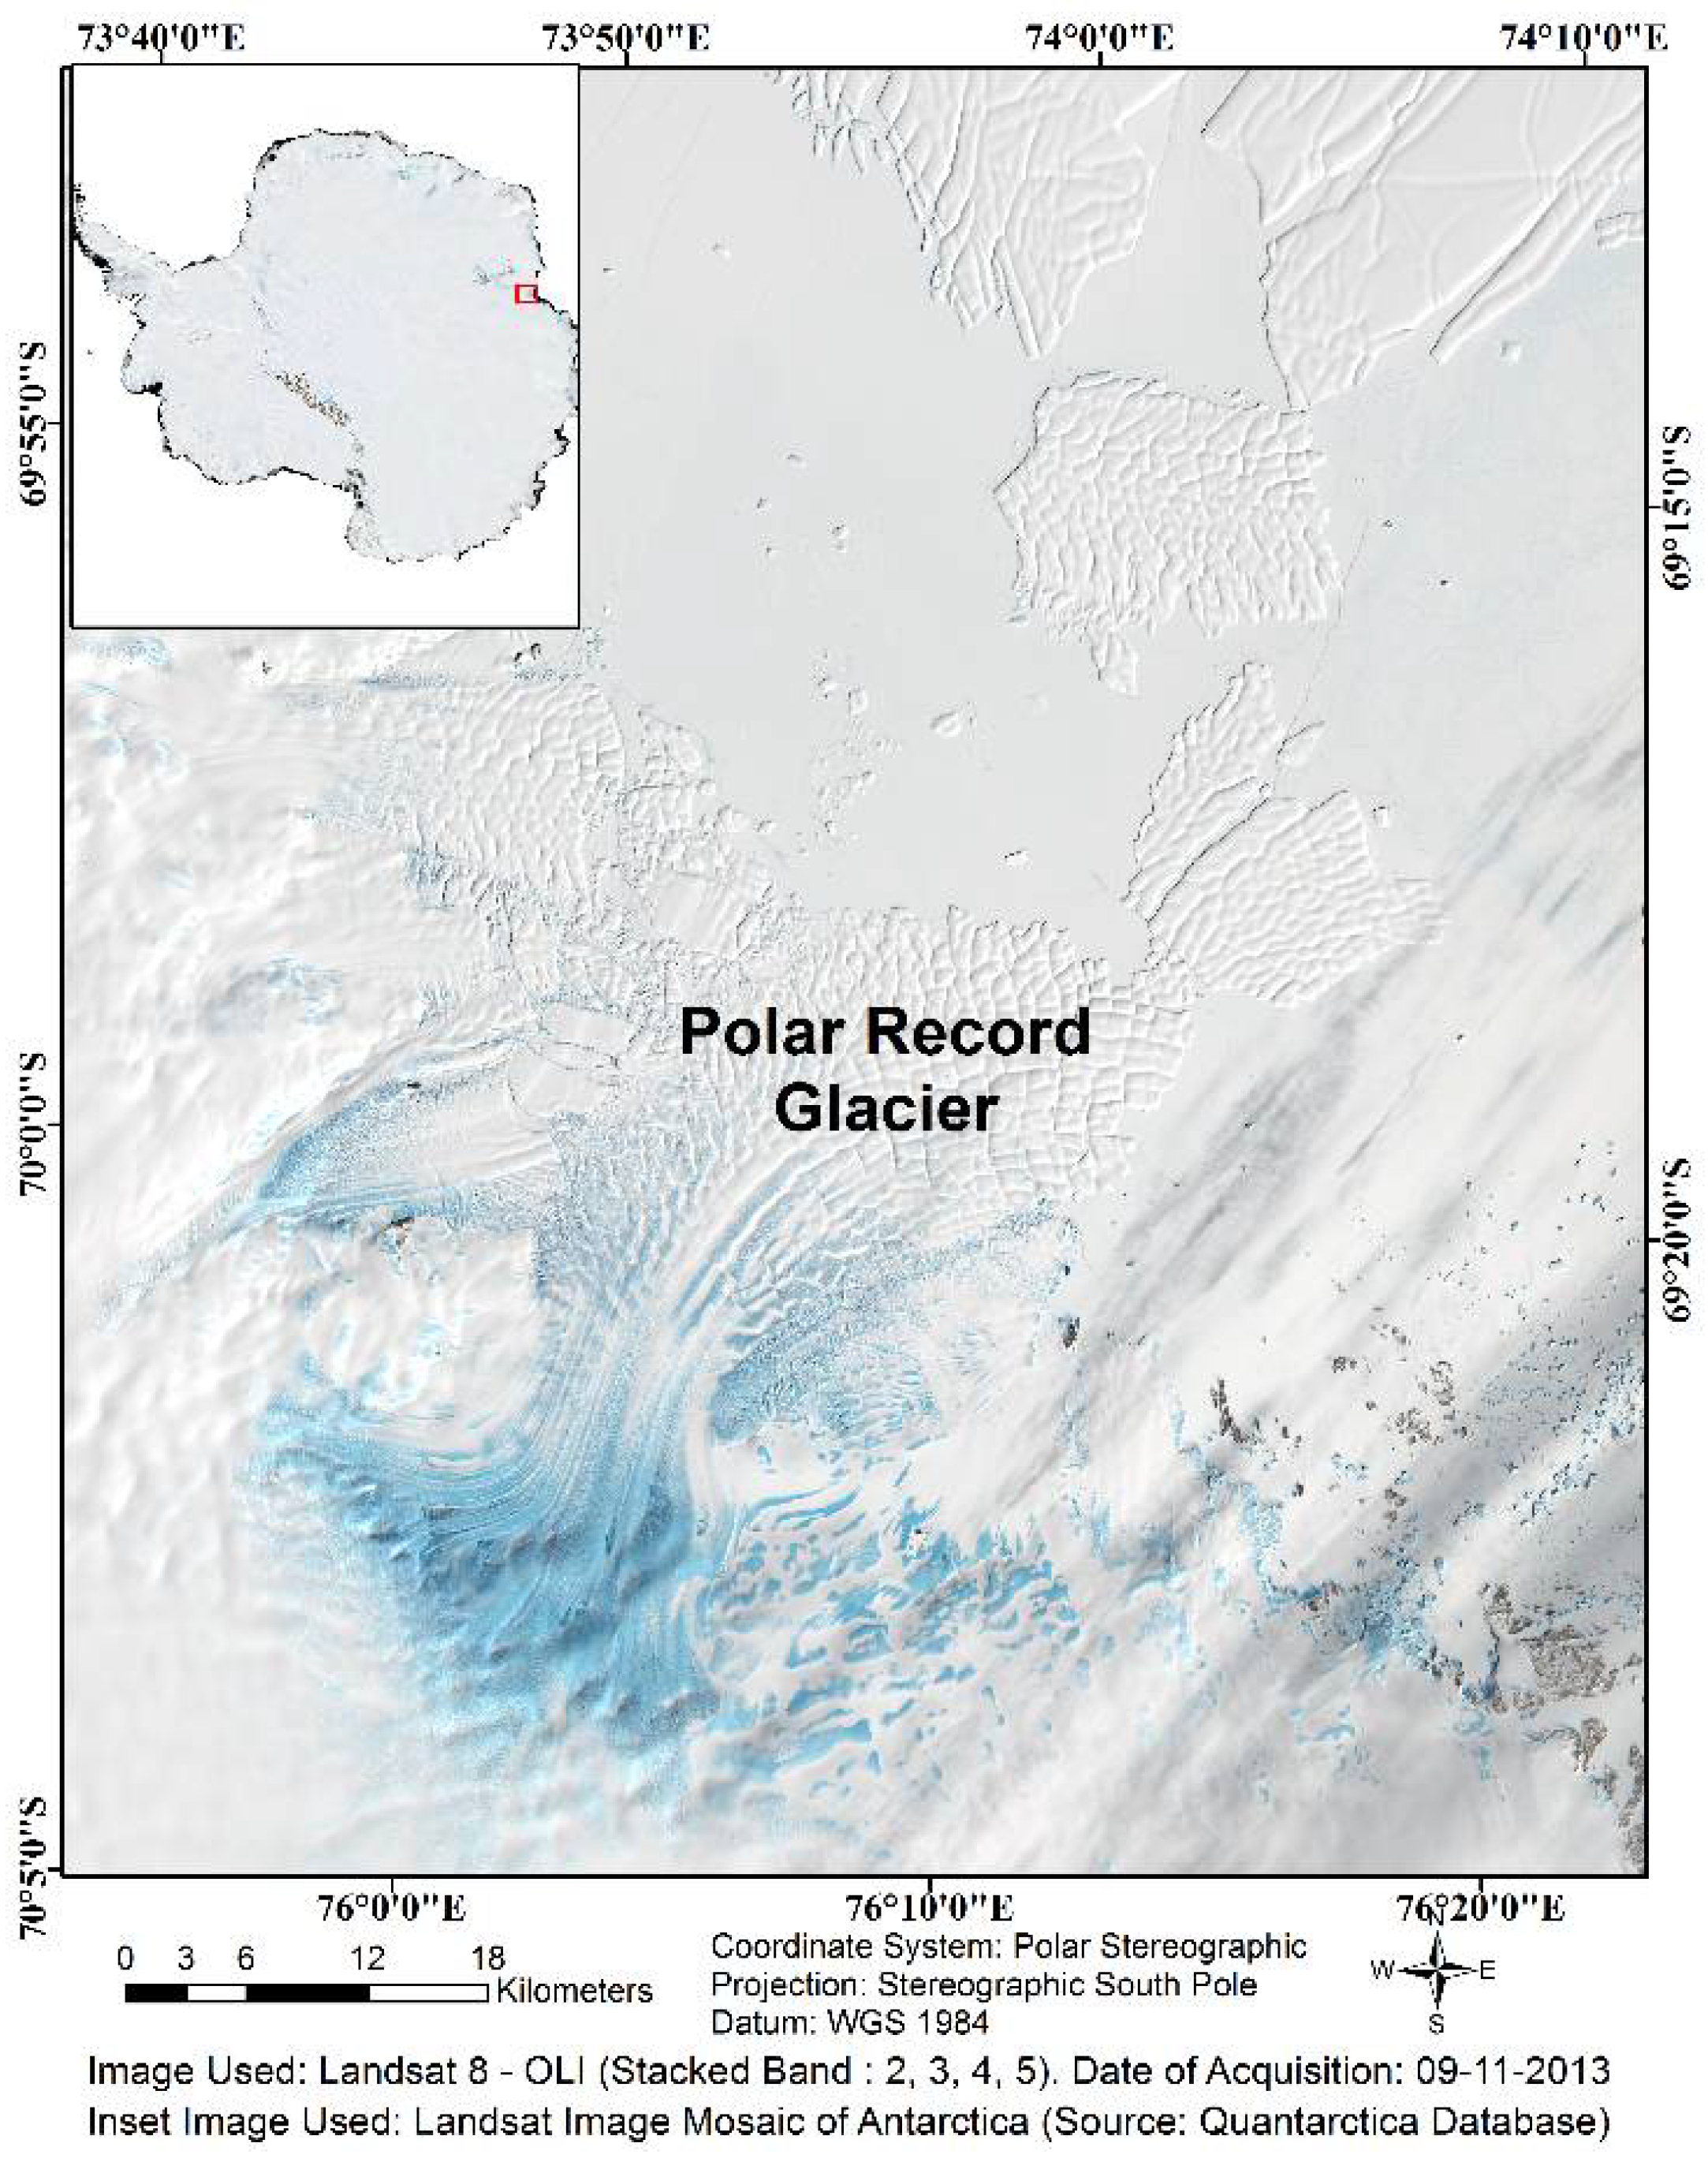
2.1. Study Area
2.2. Materials Used
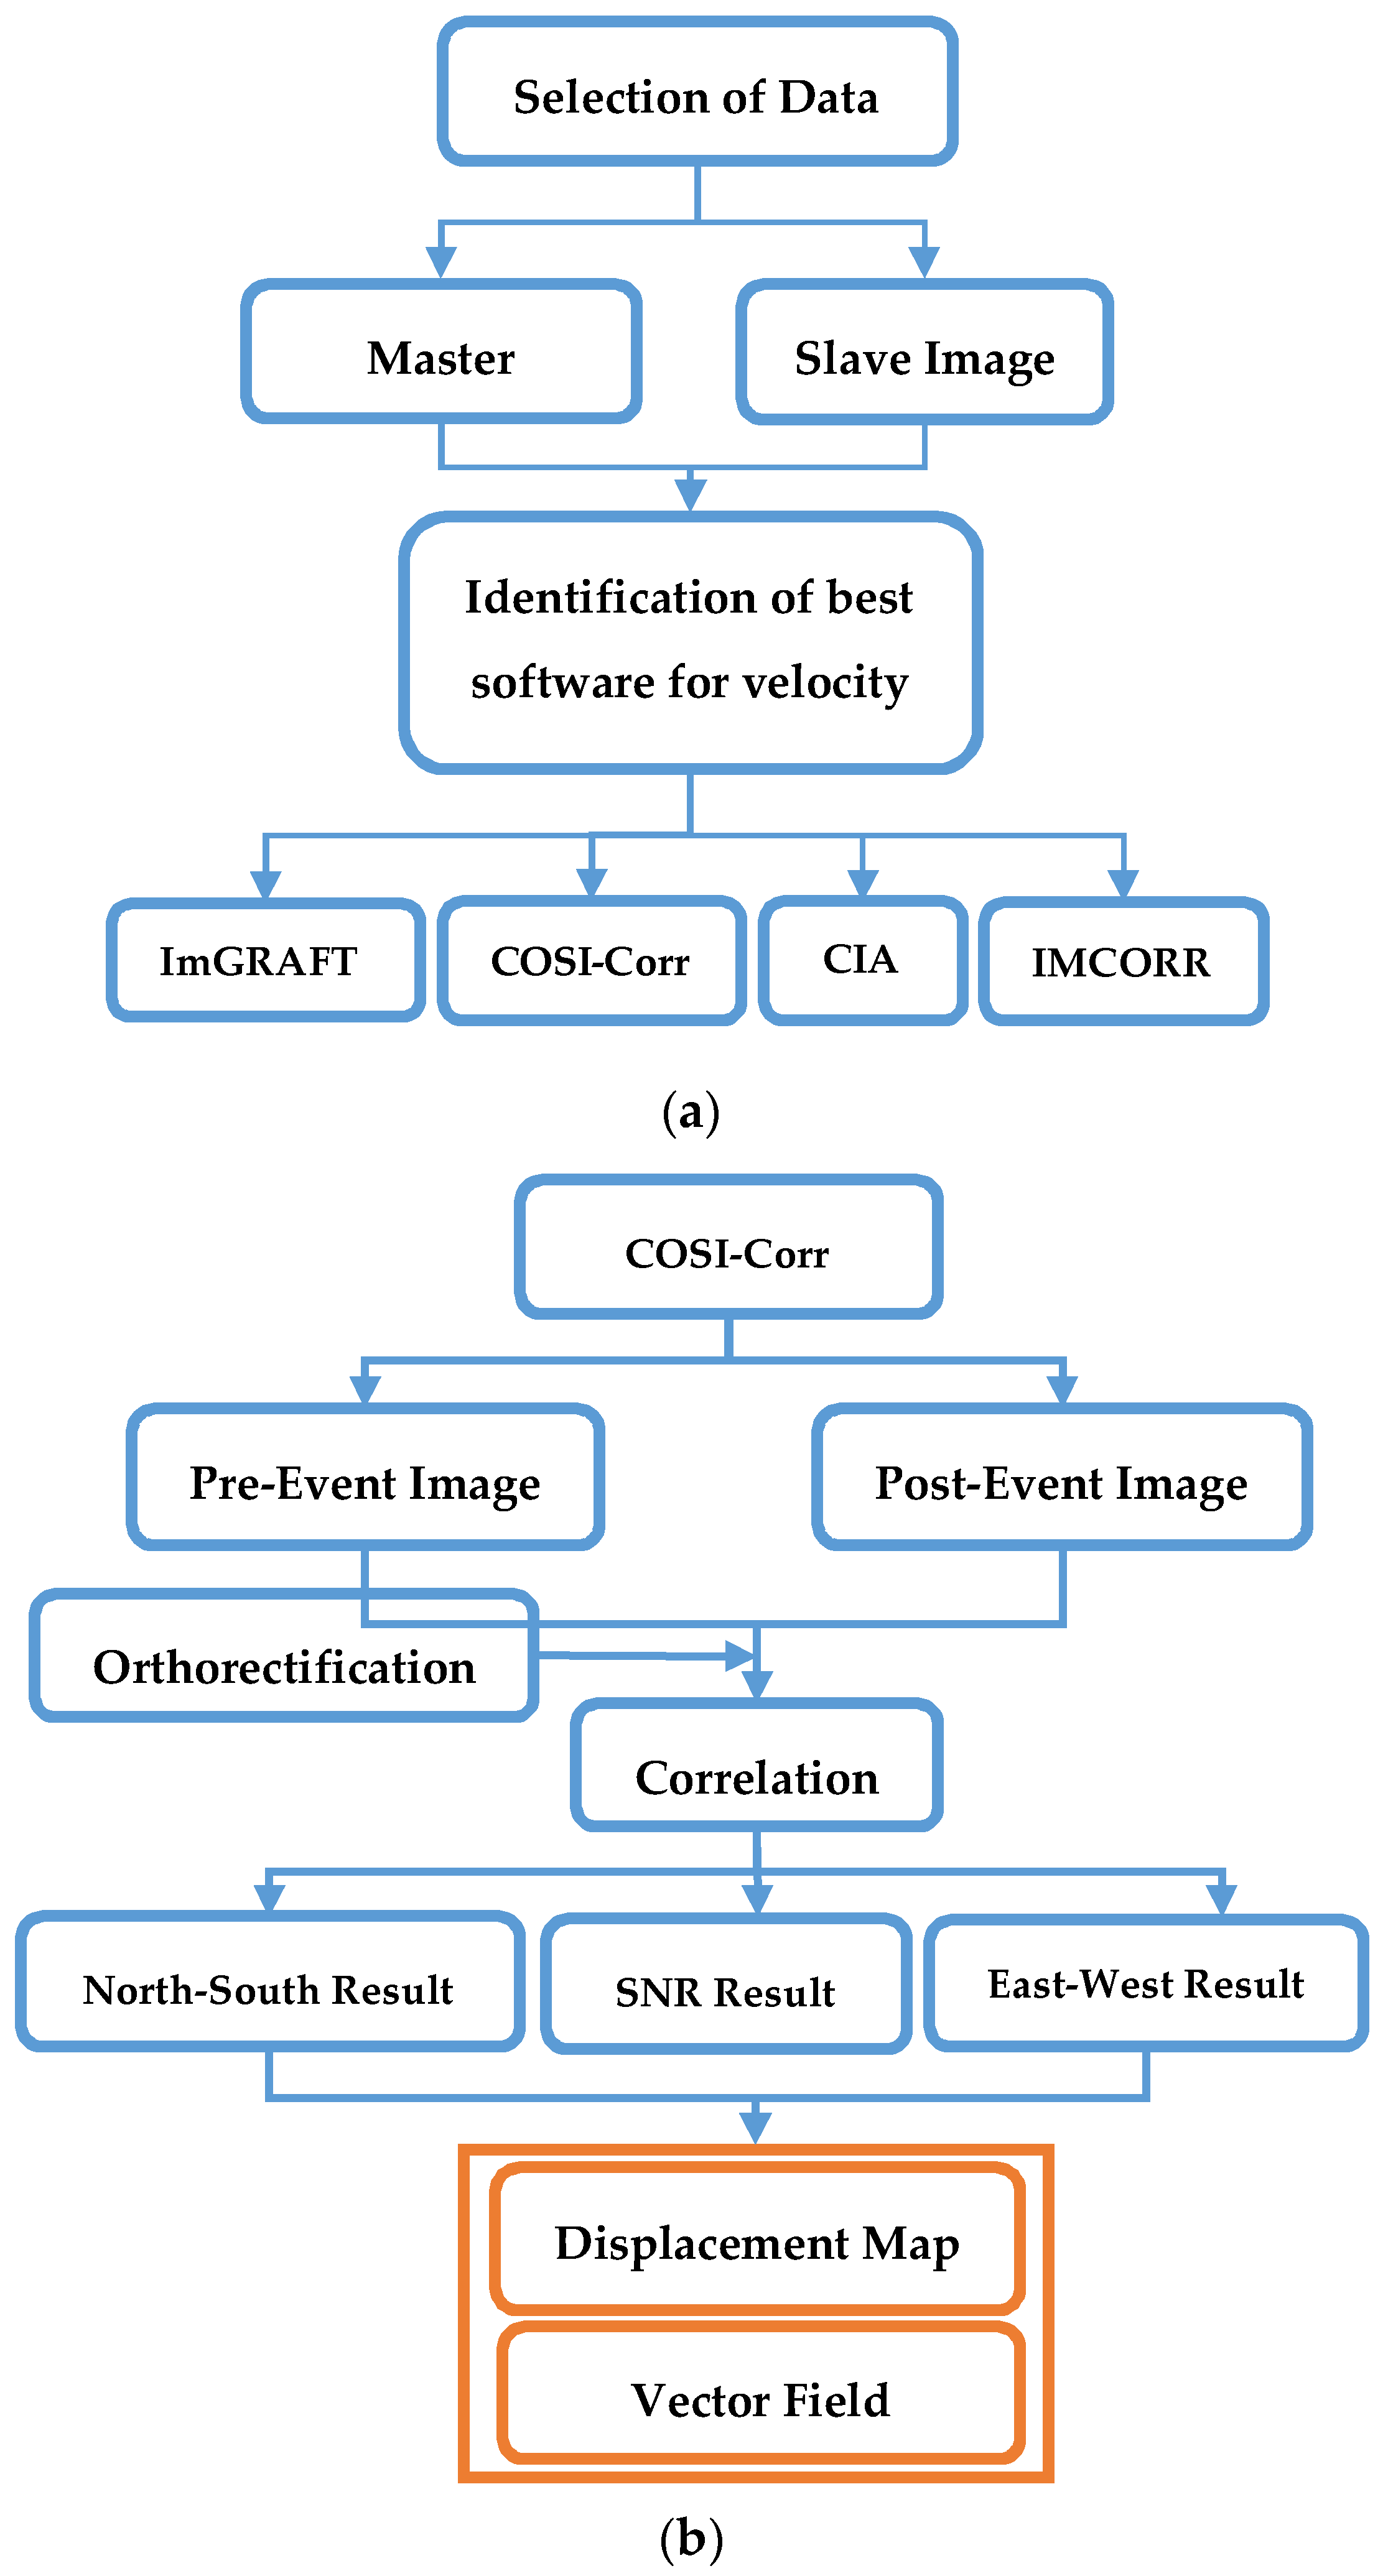
2.3. Method Adopted
- ImGRAFT: This is a toolbox in the MATLAB for feature tracking, using template matching to map displacement and satellite images [7].
- COSI-Corr: This is a software package developed under IDL (Interactive Data Language) and integrated under the ENVI software. It is a method of detection of sub-pixel changes using a pair of ortho images [8].
- IMCORR: This takes two images and a series of input parameters and attempts to match small subscenes (called ‘chips’) from the two images. The program uses a fast Fourier transform-based version of a normalized cross-covariance method [9].
- Image correlation software CIAS: The software is based on Normalized Cross-Correlation (NCC). It uses the NCC and NCC-O (Normalized Cross Correlation and Orientation in Fourier domain) algorithms [10].
3. Results
3.1. Analysis of Different Geospatial Tools for Velocity Estimation
- ImGRAFT: ImGRAFT provided good displacement measurements, but the direction of the glacier flow was not provided. The speed of the glacier obtained by ImGRAFT agreed with the velocities derived by the other techniques, but this tool was unable to trace the direction of the flow.
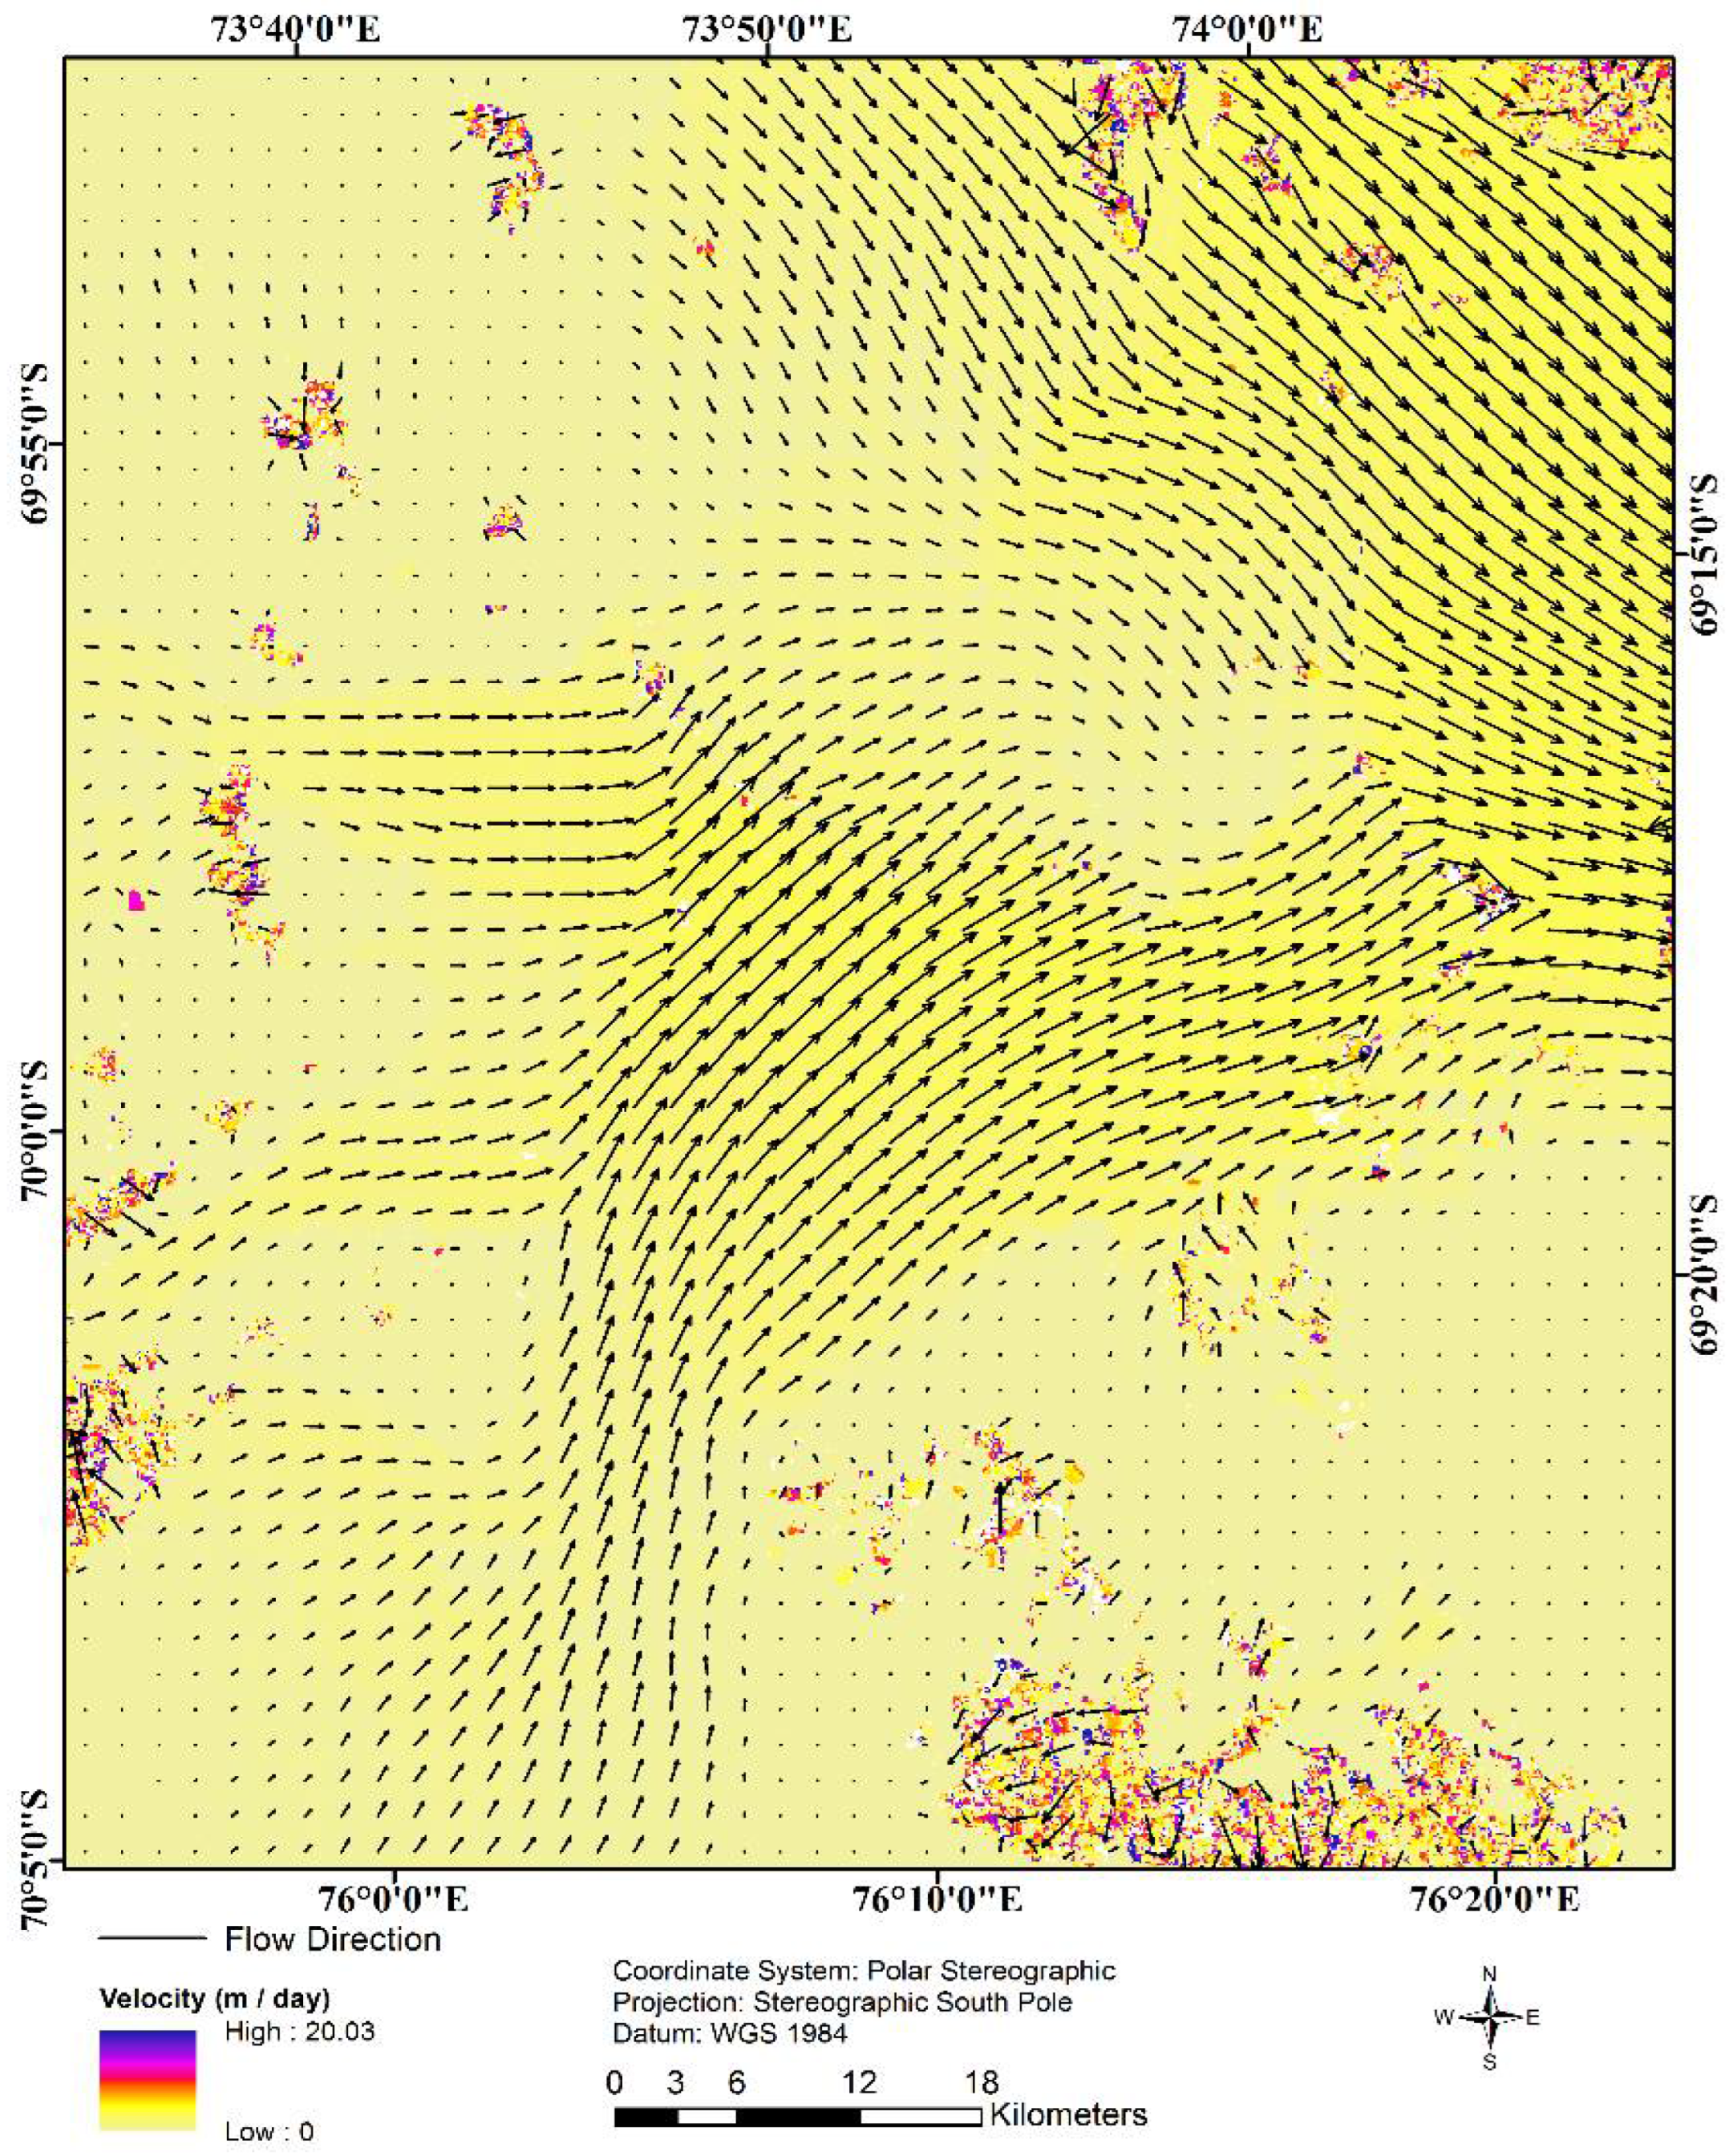
- COSI-Corr: the COSI-Corr software package gave precise flow speed along with the direction of the flow of the glacier at the pixel level. The velocity obtained using this technique was well defined, along with the vectors in the direction of the flow of the glacier.
- IMCORR: The results of IMCORR feature tracking yielded a pixel-level direction of the flow, but the its magnitude was not estimated at the pixel level, rather, the values were bundled. The output could not provide numerical values of the highest and lowest flow speeds.
- Image correlation software CIAS: The velocities derived using the CIAS software also gave a bundled velocity, and the flow direction was also not identified.
3.2. Calculation of the Velocity of the PRG
4. Discussion
5. Conclusions
Author Contributions
Acknowledgments
Conflicts of Interest
Abbreviations
| ImGRAFT | Image GeoRectification and Feature Tracking |
| COSI-Corr | Co-registration of Optically Sensed Images and Correlation |
| IMCORR | Image correlation |
| ENVI | Exelis Visual Information Solutions |
| IDL | Interactive Data Language |
| OLI | Operational Land Imager |
| PRG | Polar Record Glacier |
| NCC-O | Normalized Cross Correlation and Orientation in Fourier domain |
References
- Jeong, S.; Howat, I.; Ahn, Y. Improved Multiple Matching Method for Observing Glacier Motion with Repeat Image Feature Tracking. IEEE Trans. Geosci. Remote Sens. 2017, 55, 2431–2441. [Google Scholar] [CrossRef] [PubMed]
- Jawak, S.D.; Pandit, P.; Luis, A.J.; Malik, K.; Sinha, V.S.P. Derivation of velocity of the Potsdam Glacier, east Antarctica using SAR interferometry. In Proceedings of the 38th Asian Conference on Remote Sensing (ACRS 2017), Delhi, India, 23–27 October 2017; Available online: http://www.a-a-r-s.org/acrs/administrator/components/com_jresearch/files/publications/94.pdf (accessed on 26 January 2018).
- Pandit, P.H.; Jawak, S.D.; Luis, A.J. Deriving Velocity of the Polar Record Glacier, East Antarctica Using SAR Interferometry, Science and Geopolitics of Himalaya, Arctic & Antarctic-Focussing on Climate Change” (SaGHAA 2017), 30 November–1 December 2017; JNU Convention Centre, Jawaharlal Nehru University: New Delhi, India, 2017. [Google Scholar]
- Heid, T.; Kääb, A. Evaluation of existing image matching methods for deriving glacier surface displacements globally from optical satellite imagery. Remote Sens. Environ. 2012, 118, 339–355. [Google Scholar] [CrossRef]
- Berthier, E.; Raup, B.; Scambos, T. New velocity map and mass-balance estimate of Mertz Glacier, East Antarctica, derived from Landsat sequential imagery. J. Glaciol. 2003, 49, 503–511. [Google Scholar] [CrossRef]
- Cruwys, L.; Rees, G. The Polar Record Glacier. Polar Rec. 2001, 37, 154–156. Available online: https://www.researchgate.net/publication/231761602_The_Polar_Record_Glacier (accessed on 8 September 2017). [CrossRef]
- Messerli, A.; Grinsted, A. Image georectification and feature tracking toolbox: ImGRAFT. Geosci. Instrum. Methods Data Syst. 2015, 4, 23–34. Available online: https://www.geosci-instrum-method-data-syst.net/4/23/2015/gi-4-23-2015.html (accessed on 7 September 2017). [CrossRef]
- Ayoub, F.; Leprince, S.; Avouac, J. Co-registration and correlation of aerial photographs for ground deformation measurements. ISPRS J. Photogramm. Remote Sens. 2009, 64, 551–560. [Google Scholar] [CrossRef]
- IMCORR Software | National Snow and Ice Data Center. Available online: https://nsidc.org/data/velmap/imcorr.html (accessed on 16 November 2017).
- Kääb, A.; Vollmer, M. Surface Geometry, Thickness Changes and Flow Fields on Creeping Mountain Permafrost: Automatic Extraction by Digital Image Analysis. Permafr. Periglac. Process. 2000, 11, 315–326. Available online: http://onlinelibrary.wiley.com/doi/10.1002/1099-1530(200012)11:4%3C315::AID-PPP365%3E3.0.CO;2-J/abstract (accessed on 7 September 2017). [CrossRef]
- Zhou, C.; Zhou, Y.; Deng, F.; Ai, S.; Wang, Z.; Dongchen, E. Seasonal and interannual ice velocity changes of Polar Record Glacier, East Antarctica. Ann. Glaciol. 2014, 55, 45–51. Available online: https://www.cambridge.org/core/journals/annals-of-glaciology/article/seasonal-and-interannual-ice-velocity-changes-of-polar-record-glacier-east-antarctica/000359880DA75122DF96186F3099B02C (accessed on 18 September 2017). [CrossRef]
- Liu, T.; Niu, M.; Yang, Y. Ice Velocity Variations of the Polar Record Glacier (East Antarctica) Using a Rotation-Invariant Feature-Tracking Approach. Remote Sens. 2017, 10, 42. Available online: https://www.mdpi.com/2072-4292/10/1/42 (accessed on 3 January 2018). [CrossRef]

| S. No. | Sensor | Path | Row | Date of Acquisition | Source |
|---|---|---|---|---|---|
| 1. | Landsat 8-OLI | 126 | 109 | 9 November 2013 | Earthexplorer 1 |
| 2. | Landsat 8-OLI | 126 | 109 | 27 November 2013 | Earthexplorer 1 |
Publisher’s Note: MDPI stays neutral with regard to jurisdictional claims in published maps and institutional affiliations. |
© 2018 by the authors. Licensee MDPI, Basel, Switzerland. This article is an open access article distributed under the terms and conditions of the Creative Commons Attribution (CC BY) license (https://creativecommons.org/licenses/by/4.0/).
Share and Cite
Jawak, S.D.; Kumar, S.; Luis, A.J.; Bartanwala, M.; Tummala, S.; Pandey, A.C. Evaluation of Geospatial Tools for Generating Accurate Glacier Velocity Maps from Optical Remote Sensing Data. Proceedings 2018, 2, 341. https://doi.org/10.3390/ecrs-2-05154
Jawak SD, Kumar S, Luis AJ, Bartanwala M, Tummala S, Pandey AC. Evaluation of Geospatial Tools for Generating Accurate Glacier Velocity Maps from Optical Remote Sensing Data. Proceedings. 2018; 2(7):341. https://doi.org/10.3390/ecrs-2-05154
Chicago/Turabian StyleJawak, Shridhar D., Shubhang Kumar, Alvarinho J. Luis, Mustansir Bartanwala, Shravan Tummala, and Arvind C. Pandey. 2018. "Evaluation of Geospatial Tools for Generating Accurate Glacier Velocity Maps from Optical Remote Sensing Data" Proceedings 2, no. 7: 341. https://doi.org/10.3390/ecrs-2-05154
APA StyleJawak, S. D., Kumar, S., Luis, A. J., Bartanwala, M., Tummala, S., & Pandey, A. C. (2018). Evaluation of Geospatial Tools for Generating Accurate Glacier Velocity Maps from Optical Remote Sensing Data. Proceedings, 2(7), 341. https://doi.org/10.3390/ecrs-2-05154